Hull Momentum AM
- Indicateurs
- Andriy Matviyevs'kyy
- Version: 26.2
- Mise à jour: 18 septembre 2023
- Activations: 5
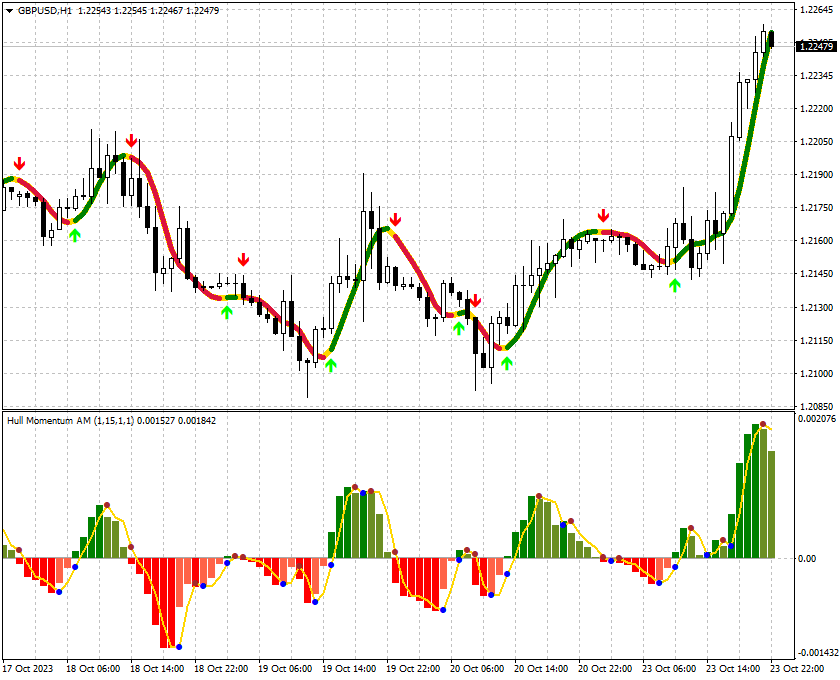
This indicator is an oscillator built on the principle of the classic Momentum.
The indicator is part of a series of indicators - Hull Line AM, Hull Momentum AM, Hull Candles AM, Hull Signal AM.
The indicator represents the difference between the current price and the price some number of periods ago.
The difference from the classic indicator Momentum is the preliminary smoothing of prices according to the method proposed by Alan Hull.
Using the indicator:
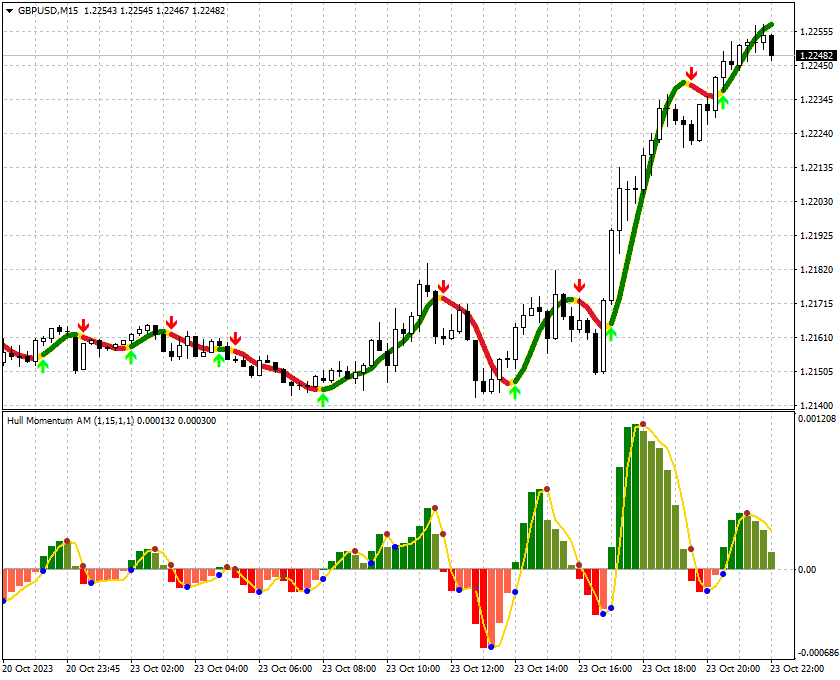
It should be taken into account that the values of the indicator on the zero bar (which has not finished forming yet) may change, so decisions should be made after the end of the bar formation, at the moment of opening a new zero bar.
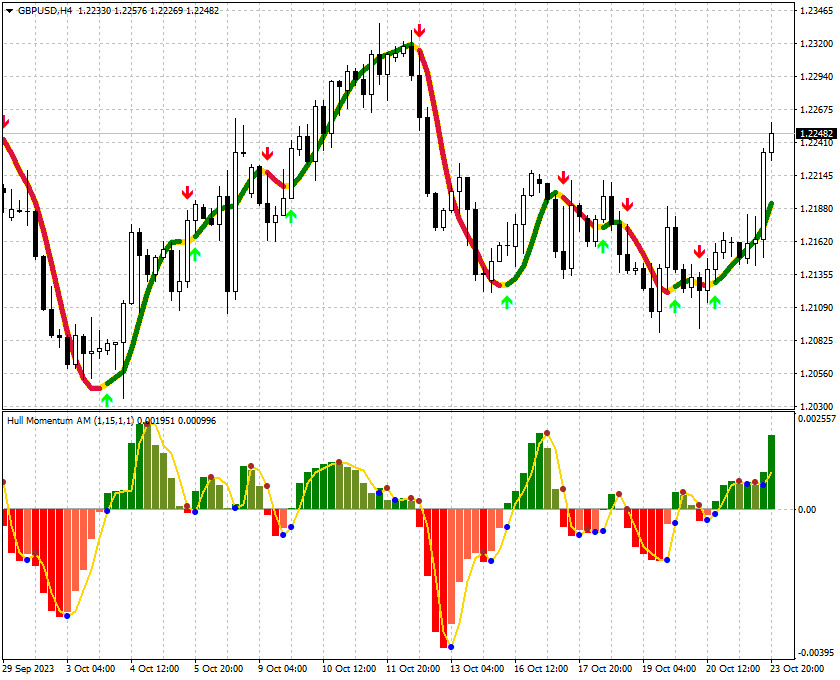
Confirmation of the indicator signals is usually the price breaking the high (for buying) or low (for selling) of the bar on which the signal was given.
As a signal, the indicator crosses the zero line. When the zero line is crossed by the indicator from top to bottom, a sell signal is given, when from the bottom up, a buy signal is given.
The second type of signal is a fall or rise in the indicator values. If the indicator values begin to decline after growth, this is a sell signal. If the indicator values begin to grow after falling, this is a signal to buy.
The indicator also uses divergence analysis. If prices make a new high on the chart, which is higher than the previous one, and the indicator at this time makes a new high on its chart, but lower than the previous one, this means that an upward downward movement may soon begin to reverse. And vice versa, if prices make a new low on the chart, which is lower than the previous one, and the indicator at this time makes a new low on its chart, but higher than the previous one, this means that a downward trend reversal may soon begin.