• Aperçu
  • Avis (23)
  • Commentaires (241)
  • Nouveautés

RelicusRoad Pro MT5

5
Maintenant 147 $ (augmentant à 499 $ après quelques mises à jour) - Comptes illimités (PCS ou Mac)


Manuel d'utilisation RelicusRoad + Vidéos de formation + Accès au groupe Discord privé + Statut VIP


UNE NOUVELLE FAÇON DE REGARDER LE MARCHÉ


RelicusRoad est l'indicateur de trading le plus puissant au monde pour le forex, les contrats à terme, les crypto-monnaies, les actions et les indices, offrant aux traders toutes les informations et tous les outils dont ils ont besoin pour rester rentables. Nous fournissons des analyses techniques et des plans de trading pour aider chaque trader à réussir, du débutant à l'avancé. C'est un indicateur de trading clé qui fournit suffisamment d'informations pour prédire les marchés futurs. Nous croyons en une solution complète au lieu de plusieurs indicateurs différents sur le graphique qui n'ont aucun sens. Il s'agit d'un indicateur tout-en-un qui affiche des signaux, des flèches + des informations sur l'action des prix imbattables et très précises.


Basé sur une IA puissante, RelicusRoad fournit les informations et les outils manquants pour vous éduquer et faire de vous un pro du trading, un trader performant.


Presque tous les indicateurs techniques sont en retard, ce qui signifie qu'ils ne peuvent signaler que ce qui s'est déjà produit. Ainsi, ils ne font que confirmer ce que vous pouvez voir dans le passé, où le prix a déjà été. Nous croyons aux indicateurs avancés pour prédire les prix futurs sans redessiner et ne pas trop compter sur des indicateurs retardés qui peuvent changer et provoquer un redessin. Si vous négociez et prenez une position basée sur un indicateur retardé, vous savez que vous jouez déjà principalement. Nous pensons qu'avant même de penser à prendre position, vous devez comprendre le marché et savoir où et pourquoi le prix évolue. RelicusRoad vous aide à faire exactement cela.


Oui, il fournit une analyse technique et de l'action des prix, et oui, il existe plus de 7 stratégies de trading parmi lesquelles vous pouvez apprendre, suivre et maîtriser. Il s'agit d'un système tout-en-un qui fournit des signaux d'entrée de transaction, avec des niveaux de prise de profit et d'arrêt de perte inclus, mais plus important encore, il vous apprend à voir le POURQUOI.


Construit sur plus de 10 ans d'expérience commerciale. RelicusRoad a été développé pour qu'un indicateur puisse vous dire tout ce que vous devez savoir sur n'importe quel marché, en un coup d'œil. Soutenu par une communauté de débutants et de commerçants professionnels partageant les mêmes idées. Soyez motivé par les commentaires positifs ou les innombrables bénéfices quotidiens partagés dans le "Hall de la réputation".


#Nous avons également une version TradingView disponible afin que vous puissiez effectuer une analyse imbattable en déplacement, en étant capable de prédire le prix n'importe où, n'importe quand.


FONCTIONNALITÉS ET PARAMÈTRES

1) Financement des talents (7 options + paramètres)

2) RelicusRoad AI (intelligence artificielle)

3) Niveaux de liquidité de RelicusRoad (action sur les prix)

4) Stratégie de liquidité RelicusRoad (action sur les prix) (2 options)

5) RelicusRoad Signal Lines 1 & 2 (basé sur la stratégie) (7 options + paramètres)

6) Niveaux d'action de RelicusRoad (leader)

7) Niveaux hauts/bas quotidiens de RelicusRoad (en tête)

8) Offre et demande RelicusRoad (en retard et en avance) (Options + Paramètres)

9) Lignes de support et de résistance multi-TF (en retard et en avance)

10) Nuage de signal RelicusRoad (action sur les prix)

11) Niveaux d'inversion de Fibonacci (action des prix)

12) Barre de tendance multi-TF (ADX et ParabolicSAR)

13) Horaires des sessions du marché de l'automobile (New York, Londres, Tokyo)

14) Minuteur de bougie (rouge = marché fermé)


SIGNAUX & FLÈCHES

15) Flèches à motif de bougies (action sur les prix)

16) Flèches fractales (action sur les prix)

17) Flèches d'inversion (liquidité) - TAKE PROFIT & STOP LOSS

18) Flèches de tendance (MACD)

19) Stratégie #5 Flèches (Tendance Globale)

20) Flèches d'ordre ouvert (bleu et rouge)

21) Stop Loss / Take Profit Flèches (Gris)

..... et de nombreuses options!


**REGARDEZ LES VIDÉOS ET LES PHOTOS CI-DESSOUS**

Avis 20
Birds_eye
307
Birds_eye 2024.04.25 20:33 
 

A good indicator, easy to set up and customize to trading strategy.

JeanMarc2222
858
JeanMarc2222 2024.03.13 20:37 
 

Fantastic indicator!

Sebastian Schmidt
1228
Sebastian Schmidt 2024.01.19 18:30 
 

Ja da geht die Sonne auf... Vielen Dank für die gute Arbeit und dieses geniale Handelssystem. Ein Muss für jeden der den Erfolg sucht, aber Erfolg bislang noch nicht konnte...

Produits recommandés
Mt5 Market Profile
Mcblastus Gicharu Ndiba
Market Profile Introducing the Market Profile MetaTrader Indicator—your gateway to mastering market dynamics with precision and insight. This powerful tool delivers a classic Market Profile analysis, revealing price density over time and highlighting crucial levels, including the value area and control value for any trading session.  Compatible with timeframes from M1 to D1, it adapts to daily, weekly, monthly, or even intraday sessions, offering you unmatched flexibility. Lower timeframes pro
BookMap HeatMap
Roberto Spadim
1 (2)
This Indicator creates a heatmap based on depth of market of the current symbol or another symbol. Other symbol is useful when you trade futures market and a contract has 'mini' and 'full' split. For example, in Brazil (B3 - BMF&Bovespa), WDO and DOL are future Forex contract of BRL/USD (where 1 DOL = 5 WDO) and big banks work mostly with DOL (where liquidity is important). Please use with M1 timeframe , objects are too small to be displayed at higher timeframes (MT5 limit). The number of level
First and foremost, the Insight Flow Indicator stands out as a Non-Repainting, Non-Redrawing, and Non-Lagging tool. This makes it a prime choice for both manual and algorithmic trading, ensuring reliable and consistent signals. User Manual: Settings, Inputs, and Strategy The Insight Flow Indicator leverages price action, strength, and momentum to provide a clear edge in the market. Equipped with advanced filters, it eliminates noise and false signals, enhancing trading potential. By using multip
Was: $249  Now: $99   Market Profile defines a number of day types that can help the trader to determine market behaviour. A key feature is the Value Area, representing the range of price action where 70% of trading took place. Understanding the Value Area can give traders valuable insight into market direction and establish the higher odds trade. It is an excellent addition to any system you may be using. Inspired by Jim Dalton’s book “Mind Over Markets”, this indicator is designed to suit the
Market Profile MetaTrader System  — is a classic Market Profile implementation that can show the price density over time, outlining the most important price levels, value area, and control value of a given trading session. This indicator can be attached to timeframes between M1 and D1 and will show the Market Profile for daily, weekly, monthly, or even intraday sessions. Lower timeframes offer higher precision. Higher timeframes are recommended for better visibility. It is also possible to use a
This indicator has been developed to identify and display these trends quickly and easily, allowing you to see instantly, those currency pairs which are trending, and those which are not – and in all timeframes, with just one click. The 28 currency pairs are displayed as a fan as they sweep from strong to weak and back again, and this is why we call it the ‘currency array’. All 28 pairs are arrayed before you, giving an instant visual description of those pairs that are trending strongly, those
General Description In the simplest terms this is a contrarian intra-day scalping system. Built to try and let correct trades run as far as possible and flip the trade when indicated. The indicator looks at historical daily trading ranges to lay out levels at which it takes long and short positions based on the statistical levels. The indicator is built around index futures, mainly around S&P and the DOW but can be used an any futures contract mainly using AMP Futures to trade. The indicator is
Volume by Price MT5
Brian Collard
3.25 (4)
The Volume by Price Indicator for MetaTrader 5 features Volume Profile and Market Profile TPO (Time Price Opportunity). Volume and TPO histogram bar and line charts. Volume Footprint charts. TPO letter and block marker collapsed and split structure charts. Static, dynamic and flexible range segmentation and compositing methods with relative and absolute visualizations. Session hours filtering and segment concatenation with Market Watch and custom user specifications. Graphical layering, positio
Introducing "X Marks the Spot" – Your Ultimate MetaTrader 5 Indicator for Perfect Trades! Are you tired of the guesswork in trading? Ready to take your MetaTrader 5 experience to a whole new level? Look no further – "X Marks the Spot" is here to revolutionize your trading strategy! What is "X Marks the Spot"? "X Marks the Spot" is not just another indicator – it's your personal trading compass that works seamlessly on all timeframes . Whether you're a beginner or an experienced trader,
Cet indicateur vous montrera les valeurs TP et SL (dans cette devise) que vous avez déjà définies pour chaque commande sur les graphiques (fermées à la ligne de transaction/commande) qui vous aideront beaucoup à estimer vos profits et pertes pour chaque commande. Et il vous montre également les valeurs PIP. le format affiché est "Valeurs monétaires de nos valeurs de profit ou de perte / PIPs". La valeur TP sera affichée en couleur verte et la valeur SL sera affichée en couleur rouge. Pour tou
Value Chart Candlesticks
Flavio Javier Jarabeck
4.7 (10)
The idea of a Value Chart indicator was presented in the very good book I read back in 2020 , " Dynamic Trading Indicators: Winning with Value Charts and Price Action Profile ", from the authors Mark Helweg and David Stendahl. The idea is simple and the result is pure genius: Present candlestick Price analysis in a detrended way! HOW TO READ THIS INDICATOR Look for Overbought and Oversold levels. Of course, you will need to test the settings a lot to find the "correct" one for your approach.
FREE
Blahtech VWAP MT5
Blahtech Limited
5 (1)
Was: $69  Now: $34   Blahtech VWAP - Volume Weighted Average Price (VWAP) is the ratio of price to total volume. It provides an average price over a specified time interval.  Links [  Install  |  Update  |  Documentation   ] Feature Highlights Configurable VWAP Line Sessions, intervals, anchored or continuous Previous day settlement line Standard Deviation bands Alerts at bar close or real time Automatic Broker or Tick volumes Significantly reduced CPU usage Input Parameters Expert Advisor
Blahtech Supply Demand MT5
Blahtech Limited
4.54 (13)
Was: $299  Now: $99   Supply Demand uses previous price action to identify potential imbalances between buyers and sellers. The key is to identify the better odds zones, not just the untouched ones. Blahtech Supply Demand indicator delivers functionality previously unavailable on any trading platform. This 4-in-1 indicator not only highlights the higher probability zones using a multi-criteria strength engine, but also combines it with multi-timeframe trend analysis, previously confirmed swings
Avant d'installer l'indicateur HeatMap assurez vous d'utiliser un broker qui vous donne accès au Depth of market (DOM) !! Cet indicateur crée sur votre graphiques une heatmap vous permettant de voir les ordres limites d'achat ou de vente facilement et en temps réel. Vous avez la possibilité de changer de réglage et les couleurs de la HeatMap afin de s'adapter à  tous les marchés et à tous les graphiques. Voici un exemple de réglage que vous pouvez utiliser  avec le SPX500 sur le broker AMPGlob
L'indicateur construit les cotations actuelles, qui peuvent être comparées aux cotations historiques et, sur cette base, faire une prévision de l'évolution des prix. L'indicateur dispose d'un champ de texte pour une navigation rapide jusqu'à la date souhaitée. Option : Symbole - sélection du symbole que l'indicateur affichera ; SymbolPeriod - sélection de la période à partir de laquelle l'indicateur prendra des données ; IndicatorColor - couleur de l'indicateur ; HorisontalShift -
Deriv Boom sell
Yaovi Inoussa Atchou
Notre indicateur BOOM SELL ALERT est spécialement conçu pour prendre des bougies sur BOOM 1000, BOOM 500 est un outil optimisé pour la période M1 (1 minute), vous garantissant de recevoir des informations opportunes et exploitables. L'indicateur est une combinaison de plusieurs indicateurs. - Oscillateur AO - Stochastique COMMENT UTILISER CET INDICATEUR Pour bien utiliser cet indicateur, il faut utiliser SCHAFF TREND RSX ( 5 MIN OU M5) SI la tendance SCHAFF RSX est VERTE et que vous avez un sig
To get access to MT4 version please click here . - This is the exact conversion from TradingView: "Hull Suite" By "Insilico". - This is a light-load processing and non-repaint indicator. - You can message in private chat for further changes you need. Here is the source code of a simple Expert Advisor operating based on signals from  Hull Suite . #include <Trade\Trade.mqh> CTrade trade; int handle_hull= 0 ; input group "EA Setting" input int magic_number= 123456 ; //magic number input double fixe
Reverse side scalper is the manual trading system, that works on choppy(anti-trend) market. As a rule markets are on 80% choppy and only 20% is trend phase. System is based on custom step Moving and RSI and reverse pattern. System defines up movement, down movement, trend / choppy phases. Indicator plots Buy signal arrow when current direction is down and phase is trend, Sell signal arrow is plotted when currently is up movement and phase is trend. As a rule it allows to "catch" local maximum/mi
TPO Profile MT5
Kyra Nickaline Watson-gordon
Definition : TPO is a Time Price Opportunity. Instead of using bars or candles with an Open, High, Low, and Close price, each "bar" in a Market Profile is represented by horizontal bars against the price It is called Market Profile terminology. In other words time-price-opportunity (TPO) profiles are histograms of how much time was spent at each price within the span of the profile. By using a TPO chart, you are able to analyze the amount of trading activity, based on time, for each price leve
Crash 1000 Scalping Indicator for the Crash 1000 Deriv Synthetic Index. Introduction The Crash 1000 Scalping Indicator is a specialized tool designed for the Crash 1000 index on the Deriv Synthetic market. This indicator is particularly useful for scalping on the M1 timeframe, helping traders to identify precise entry and exit points for buy positions. It is designed to be non-repainting, providing clear signals with audible alerts and push notifications, and is compatible with mobile devices th
Adjustable Consecutive Fractals  looks for 2 or more fractals in one direction and sends out a on screen alert, sound alert and push notification, for strong reversal points . Adjustable Consecutive Fractals, shows the fractals on chart along with a color changing text for buy and sell signals when one or more fractals appear on one side of price. Adjustable Consecutive Fractals is based Bill Williams Fractals . The standard Bill Williams fractals are set at a non adjustable 5 bars, BUT withe
BoxInside MT5
Evgeny Shevtsov
5 (3)
This indicator calculates the volume profile and places labels that correspond to the VAH, VAL and POC levels, for each candle individually. Indicator operation features The indicator works on the timeframes from M3 to MN, but it uses the history data of smaller periods: M1 - for periods from M3 to H1, M5 - for periods from H2 to H12, M30 - for the D1 period, H4 - for the W1 period, D1 - for the MN period. The color and location of the VAL, VAH and POC labels on the current candle are consider
FREE
Aggression Volume
Flavio Javier Jarabeck
4.14 (14)
Aggression Volume Indicator is the kind of indicator that is rarely found in the MQL5 community because it is not based on the standard Volume data provided by the Metatrader 5 platform. It requires the scrutiny of all traffic Ticks requested on the platform... That said, Aggression Volume indicator requests all Tick Data from your Broker and processes it to build a very special version of a Volume Indicator, where Buyers and Sellers aggressions are plotted in a form of Histogram. Additionally,
FREE
Noize Absorption Index - is the manual trading system that measures the difference of pressure between bears forces and bulls forces. Green line - is a noize free index that showing curent situation. Zero value of index shows totally choppy/flat market.Values above zero level shows how powerfull bullish wave is and values below zero measures bearish forces.Up arrow appears on bearish market when it's ready to reverse, dn arrow appears on weak bullish market, as a result of reverse expectation.
Tout d'abord, il convient de souligner que cet outil de trading est un indicateur non repeint, non redessiné et non retardé, ce qui le rend idéal pour le trading professionnel. Cours en ligne, manuel utilisateur et démonstration. L'indicateur Smart Price Action Concepts est un outil très puissant à la fois pour les nouveaux et les traders expérimentés. Il regroupe plus de 20 indicateurs utiles en un seul, combinant des idées de trading avancées telles que l'analyse du trader Inner Circle et
PipFinite Impulse PRO MT5
Karlo Wilson Vendiola
5 (13)
Are You Tired Of Getting Hunted By Spikes And Whipsaws? Don't become a victim of the market's erratic moves.. Do Something About It! Instantly make smarter decisions with Impulse Pro's precise balance of filters and accurate statistics. Timing Is Everything In Trading To learn more, please visit www.mql5.com/en/blogs/post/718212 Anticipate the next big move before it unfolds in 3 Simple Steps! Advantages You Get Early impulse detection algorithm. Flexible combination to different tr
Notre indicateur   Basic Support and Resistance   est la solution dont vous avez besoin pour augmenter votre analyse technique.Cet indicateur vous permet de projeter les niveaux de support et de résistance sur le graphique /   Version MT4 Caractéristiques Intégration des niveaux de Fibonacci: avec la possibilité d'afficher les niveaux de Fibonacci aux côtés des niveaux de support et de résistance, notre indicateur vous donne un aperçu encore plus profond du comportement du marché et des zone
PipFinite Exit EDGE MT5
Karlo Wilson Vendiola
4.86 (29)
Did You Have A Profitable Trade But Suddenly Reversed? In a solid strategy, exiting a trade is equally important as entering. Exit EDGE helps maximize your current trade profit and avoid turning winning trades to losers. Never Miss An Exit Signal Again Monitor all pairs and timeframes in just 1 chart www.mql5.com/en/blogs/post/726558 How To Trade You can close your open trades as soon as you receive a signal Close your Buy orders if you receive an Exit Buy Signal. Close your Sell orde
The Antique Trend Indicator is a revolutionary trend trading and filtering solution with all the important features of a trend tool built into one tool! The Antique Trend indicator is good for any trader, suitable for any trader both for Forex and binary options. There is no need to configure anything, everything has been perfected by time and experience, it works great during flats and trends. The Antique Trend indicator is a tool for technical analysis of financial markets, reflecting curre
Tout d'abord, il convient de souligner que ce système de trading est un indicateur non repainting, non redrawing et non lagging, ce qui le rend idéal pour le trading professionnel. Cours en ligne, manuel utilisateur et démonstration. Le "Système de Trading de Support et Résistance Intelligent" est un indicateur avancé conçu pour les traders novices et expérimentés. Il permet aux traders de bénéficier de précision et de confiance sur le marché du forex. Ce système complet combine plus de 7 strat
Les acheteurs de ce produit ont également acheté
TrendMaestro5
Stefano Frisetti
note: this indicator is for METATRADER4, if you want the version for METATRADER5 this is the link:  https://www.mql5.com/it/market/product/108106 TRENDMAESTRO ver 2.4 TRENDMAESTRO recognizes a new TREND in the bud, he never makes mistakes. The certainty of identifying a new TREND is priceless. DESCRIPTION TRENDMAESTRO identifies a new TREND in the bud, this indicator examines the volatility, volumes and momentum to identify the moment in which there is an explosion of one or more of these data a
FxaccurateLS
Shiv Raj Kumawat
WHY IS OUR FXACCCURATE LS MT5 THE PROFITABLE ? PROTECT YOUR CAPITAL WITH RISK MANAGEMENT Gives entry, stop and target levels from time to time. It finds Trading opportunities by analyzing what the price is doing during established trends. POWERFUL INDICATOR FOR A RELIABLE STRATEGIES We have made these indicators with a lot of years of hard work. It is made at a very advanced level. Established trends provide dozens of trading opportunities, but most trend indicators completely ignore them!
Boom and Crash Trend Detector is a  Non-Repaint   MT5 trading system usually being sold for 50 0$ . Most people use this for Deriv but can be used to forex too. The boom and crash spike indicator is a spike detecting software, with Multiple features, these features include. Spike Alert ( from 10 to 100-second warning before spike) Continues spike Alert (for double or continuous spikes at a time) supports all Boom/crash Indices M6 time frame works best here . Bigger time frame trend pointer f
CET INDICATEUR, BASÉ SUR L'INTELLIGENCE ARTIFICIELLE, identifie les points de retournement possibles du marché en lisant l'empreinte, et signale À L'AVANCE les petits mouvements du marché avant qu'ils ne se produisent. Contrairement aux indicateurs de prix et de volume, qui génèrent des entrées « tardives », c'est-à-dire lorsqu'une confirmation de prix ou de volume a déjà eu lieu sur un changement de direction, et donc souvent le mouvement est déjà terminé, cet indicateur signale, en fonction d
IVISTscalp5
Vadym Zhukovskyi
5 (5)
Nous vous présentons l'indicateur iVISTscalp5, qui est non seulement unique, mais également efficace dans les opérations de trading. Cet indicateur est basé sur des données temporelles et est le résultat de nombreuses années d'expérience et d'analyse approfondie des marchés financiers. L'indicateur iVISTscalp5 est un excellent outil pour le trading manuel. La commodité, la simplicité et la visualisation - toute la complexité est cachée à l'intérieur. Nous avons simplifié au maximum les paramètre
Bill Williams Advanced
Siarhei Vashchylka
5 (8)
Bill Williams Advanced is designed for automatic chart analysis using Bill Williams' "Profitunity" system. The indicator analyzes four timeframes at once. Manual (Be sure to read before purchasing) Advantages 1. Automatically analyzes the chart using the "Profitunity" system of Bill Williams. The found signals are placed in a table in the corner of the screen. 2. Equipped with a trend filter based on the Alligator indicator. Most of the system signals are recommended to be used only accordi
Go Way TREND
Ywsf Hsyn Hmad Alrsh
Suivez la tendance. Oui, attendez le signal d'entrée, qu'il soit d'achat ou de vente, sur une image de 15 minutes, et vérifiez le signal s'il apparaît sur une image de 30 minutes (il faut parfois une heure ou plus pour que le signal apparaisse. Vous pouvez revenir au cadre de 15 minutes et revenez au cadre de 30 minutes, et répétez cette opération jusqu'à ce que le signal principal apparaisse pour vous. Si le signal apparaît sur le cadre de 30 minutes, entrez avec le prix et le profit est pris
Currently, the product's selling price is over $480; however, we are offering a monthly rental system for only $30. This allows many people to enjoy and experience our products during this launch stage, which will likely lead to positive reviews from users, making it more enjoyable | We hope that if there are more than 10 positive reviews, the GOOD NEWS is that the next use will last for 3 months at a fixed price of only $30 | Take advantage of our promo opportunity, before it goes back to sell
Piranha version 2
Maria Strudov
5 (1)
"Piranha" - an autonomous trading system that determines overbought and oversold levels on the chart. Red and blue zones represent overbought and oversold levels respectively. Entry points are marked with arrows: a downward arrow in the red zone for "sell" and an upward arrow in the blue zone for "buy". The Take profit level is indicated by the green moving average. Key features: Adjusting the Take profit level as the green moving average changes position. Averaging ability when a new market e
Introducing the Power Trade Plus indicator designed by a small group of traders with a few years of experience trading the market profitably.  The Power Trade Plus is derived from the Power Trade indicator,  the indicator strive in powerful sniper entries and take profit levels,  with an algorithm that's can determine the markets volatility and Provides entries based on the current market volatility. This indicator is much more effective in stock ,currencies and indices.
L'oscillateur de l'indice de précision (Pi-Osc) de Roger Medcalf de Precision Trading Systems La version 2 a été soigneusement recodée pour être ultra-rapide à charger sur votre graphique, et quelques autres améliorations techniques ont été incorporées pour améliorer l'expérience. Le Pi-Osc a été créé pour fournir des signaux de synchronisation de trading précis conçus pour trouver des points d'épuisement extrêmes, les points auxquels les marchés sont contraints d'aller simplement pour élim
VTrende Pro
Andrii Diachenko
5 (1)
VTrende Pro - MTF indicator for trend trading with a display panel for MT5 *** Videos can be translated into any language using subtitles (video language - Russian) Although the signals of the VTrende Pro indicator can be used as signals of a full-fledged trading system, it is recommended to use them in conjunction with the Bill Williams TS. VTrende Pro is an extended version of the VTrende indicator. Difference between Pro version and VTrende: - Time zones - Signal V - signal 1-2 waves
Limited Offer:    Take advantage of our limited-time offer on the FxBears Powers Indicator! When you purchase this powerful tool, you'll also receive the renowned FxBears EA, an expert advisor that automatically executes the indicator's signals. Don't miss out on this unbeatable combination to enhance your trading strategy! No more losses with this indicator, test it for years ago and see if there is losses in one day results. but before testing it please see the explaining video down here. 
Contact us to receive a comprehensive user guide after purchasing. William Delbert Gann, commonly known as W.D. Gann, was an exceptional market analyst renowned for his unique trading style in the early 20th century.  His trading techniques were based on a blend of mathematics, geometry, astrology, and ancient mathematics. Gann believed that stock market movements followed specific patterns and cycles, rather than being random. His methodologies, celebrated for their accuracy and relevance, con
The indicator is designed to close positions on the market in time. For example: to take profits ahead of schedule if the price has not reached TakeProfit, and the market is turning around. The indicator analyzes the momentum, not the trend. He does not give any information about the trend. The indicator is well suited for finding divergence. The Ershov 38 Parrots indicator dynamically adjusts to the market and detects price movement impulses of medium and high amplitude. It almost does not rea
EQ Cutrim Theory
Marco Aurelio Santos Costa
Ronal Cutrim has been a dedicated mathematician for 14 years and has more than 10 years of experience in the financial market. The concept of the theory is simple, find imbalance between buyers and sellers. Which makes a lot of sense, because nothing goes up forever, nothing falls forever.   When you find an asset with a mathematical probability of unbalanced equilibrium, it is a great way to get into trading:  TUTORIAL: Turn on the subtitles, the video is subtitled
Smooth price for Monarch
Konstantin Gruzdev
5 (1)
The Smooth Price technical indicator is used for plotting a smoothed line as close to the price of the financial instrument as possible, and serves to eliminate its noise components. The indicator is part of the Monarch trading system, but here it is presented as an independent technical analysis tool. The indicator is based on the cluster digital filter , which, unlike the ClusterSMA , is applied directly to the price time series. Smooth Price does not redraw (except the very last, zero bar) an
Классификатор силы тренда. Показания на истории не меняет. Изменяется классификация только незакрытого бара. По идее подобен полной системе ASCTrend, сигнальный модуль которой, точнее его аппроксимация в несколько "урезанном" виде, есть в свободном доступе, а также в терминале как сигнальный индикатор SilverTrend . Точной копией системы ASCTrend не является. Работает на всех инструментах и всех временных диапазонах. Индикатор использует несколько некоррелируемых между собой алгоритмов для класси
Currency Index Watcher is a simple and user-friendly tool for whoever wish to trade Forex using currencies indexes. Currency Index Watcher is configurable and usable directly from the panel. Indexes of 8 custom currencies EUR, USD, GBP, JPY, CHF, AUD, CAD, NZD (default) Any 3-chars symbol from your market watch could be used (BTC = bitcoin, RUB = ruble, CNH = yuan etc ...) : double click the symbol label  Ability to select which currencies and made-of pairs will be analyzed : check/uncheck want
SmartTrendMt5
Andrey Spiridonov
The SmartTrendMt5 trend indicator generates signals based on the principle of combined analysis of calculated reference points within the Keltner channel. The indicator plots the Keltner channel in a separate window (by default, red lines and a blue line - the middle of the channel), and also draws the histogram of calculated reference points for each candle (by default, the histogram bars are yellow). The should be attached to a chart of any timeframe and any trading symbol in the usual way.
Weis Wave with Alert MT5
Trade The Volume Waves Single Member P.C.
4.93 (15)
Rental/Lifetime Package Options and Privileges  * For optimum results the yearly or lifetime package is suggested due to live training ! Rent Monthly Six Months   Yearly/Lifetime Weis Wave with Speed with Alert+Speed Index x x x Manual  x x x Quick Set up Video x x x Blog x x x Lifetime Updates x x x Setup and Training Material x x Free Rectangle Break Alert Tool      x Discord Access Channel "The SI traders" x 2-hour live methodology training x How to trade with it:    http://ww
Forex Relative Performance indicator This indicator calculates the relative strength of major currencies against the US dollar. The basic idea behind this indicator is "to buy strong currency and to sell weak currency". This indicator allows you to quickly identify the best forex pair to trade according to your trading style (Intraday, Scalping, Swing, or Long Term)
The latest most requested Binary Options arrow indicator in the Garuda Signals product line is now on MT5! Binary options signal based on multiple time frame cross over analysis. Gets confirmation from the most consistent signals known to man; Ichimoku, SMA, Bollinger Bands; and also uses the 1 Hour time frame as trend confirmation , so you don't have to open up multiple chart and waste time. - Can be used for all time frames up to 1 hour, but is most POWERFUL for 1 and 5 min options. - Place yo
Le niveau Premium est un indicateur unique avec une précision de plus de 80 % des prédictions correctes ! Cet indicateur a été testé par les meilleurs Trading Specialists depuis plus de deux mois ! L'indicateur de l'auteur que vous ne trouverez nulle part ailleurs ! À partir des captures d'écran, vous pouvez constater par vous-même la précision de cet outil ! 1 est idéal pour le trading d'options binaires avec un délai d'expiration de 1 bougie. 2 fonctionne sur toutes les paires de de
SuavizadorDePrecio
Cesar Juan Flores Navarro
Funciona identificando picos de máximos y mínimos, para luego eliminarlos haciendo una linea o curva, pudiendo el usuario ingresar el valor de que tanto puede suavizar. Nos facilita poder ver la tendencia así como ver el cruce que puede hacer con otros indicadores, mostrando a simple vista los inicios y salidas de una tendencia u operación. Así también facilita la visualización de subidas y bajadas.
Pendiente de Precio
Cesar Juan Flores Navarro
Indicador en base a la pendiente de la linea de precio, dibuja una línea de color cuando sube a base de los precios que previamente has sido procesados o linealizados, y cuando baja la pendiente la linea linealizada toma otro color. En este caso se a considerado 6 lineas de diferentes procesos desde pendientes largas hacia las cortas, observándose que cuando coincidan las pendientes se produce un máximo o mínimo, lo que a simple vista nos permitirá hacer una COMPRA O VENTA.
WanaScalper
Isaac Wanasolo
1 (1)
A scalping indicator based on mathematical patterns, which on average gives signals with relatively small SL, and also occasionally helps to catch big moves in the markets (more information in the video) This indicator has three main types of notifications: The first type warns of a possible/upcoming signal on the next bar The second type indicates the presence of a ready signal to enter the market/open a position The third type is for SL and TP levels - you will be notified every time price r
Индикатор Coefficient Of Determination (COD) представляет собой значение коэффициента детерминации или квадрат коэффициента корреляции между зависимой переменной — ценой и объясняющей переменной — тиковым объемом. Что это дает нам на практике? COD отлично распознает кульминацию трендовых движений, что позволяет подбирать оптимальные точки и ловить развороты рынка. Как использовать индикатор: Наиболее популярная торговая стратегия строится совместно с трендовым индикатором Moving Average (MA), пе
Fibonacci Multiple 12
Cesar Juan Flores Navarro
Fibonacci Múltiple 12, utiliza la serie fibonacci plasmado en el indicador fibonacci, aumentadolo 12 veces según su secuencia. El indicador fibonacci normalmente muestra una vez, el presente indicador se mostrara 12 veces empezando el numero que le indique siguiendo la secuencia. Se puede utilizar para ver la tendencia en periodos cortos y largos, de minutos a meses, solo aumentado el numero MULTIPLICA.
Recommended TimeFrame >= H1. 100% Non Repainted at any moment.  Use it carefully, only with Trend Direction. Trading Usage: 2 Variants: as Range System or as BreakOut System (Both Only With Trend Direction)::: (Always use StopLoss for minimise Risk); [1] as Range System: (Recommended) in UP TREND:  - BUY in Blue Line , then if price goes down by 50 points (on H1) open Second BUY.   Close in any Profit you wish: TrailingStop(45 points) or Close when Price touches upper Gold Line. in DOWN TR
Plus de l'auteur
La stratégie de trading Moving Average Convergence Divergence (MACD) est un outil d'analyse technique populaire utilisé pour identifier les changements de momentum et de direction de tendance. Le MACD est calculé en soustrayant la moyenne mobile exponentielle (EMA) sur 26 périodes de la EMA sur 12 périodes. Une EMA sur 9 périodes, appelée "ligne de signal", est ensuite tracée sur le MACD pour agir comme déclencheur des signaux d'achat et de vente. Le MACD est considéré comme étant en territoire
FREE
RelicusRoad Pro
Relicus LLC
4.64 (103)
Maintenant 147 $ (augmentant à 499 $ après quelques mises à jour) - Comptes illimités (PCS ou Mac) Manuel d'utilisation RelicusRoad + Vidéos de formation + Accès au groupe Discord privé + Statut VIP UNE NOUVELLE FAÇON DE REGARDER LE MARCHÉ RelicusRoad est l'indicateur de trading le plus puissant au monde pour le forex, les contrats à terme, les crypto-monnaies, les actions et les indices, offrant aux traders toutes les informations et tous les outils dont ils ont besoin pour rester renta
La stratégie de trading Moving Average Convergence Divergence (MACD) est un outil d'analyse technique populaire utilisé pour identifier les changements de momentum et de direction de tendance. Le MACD est calculé en soustrayant la moyenne mobile exponentielle (EMA) sur 26 périodes de la EMA sur 12 périodes. Une EMA sur 9 périodes, appelée "ligne de signal", est ensuite tracée sur le MACD pour agir comme déclencheur des signaux d'achat et de vente. Le MACD est considéré comme étant en territoire
FREE
Voulez-vous gérer plusieurs comptes en même temps avec des risques et des tailles de lot gérés tout en négociant sur un seul compte (maître) ? Traits: Maître (Principal) / Esclave (Copier des Comptes) Slippage accepté (différence de prix) Multiplier/Diviser (Copier la division du lot ou le facteur de multiplication) Facteur de lot (facteur de division ou de multiplication) Tout fermer (bouton Fermer toutes les positions actives ) À venir: Tout fermer - Esclave uniquement Fermer toutes les
FREE
Filtrer:
Naoki Hozumi
673
Naoki Hozumi 2024.06.16 05:46 
 

L'utilisateur n'a laissé aucun commentaire sur la note

Birds_eye
307
Birds_eye 2024.04.25 20:33 
 

A good indicator, easy to set up and customize to trading strategy.

JeanMarc2222
858
JeanMarc2222 2024.03.13 20:37 
 

Fantastic indicator!

Bernardo Rippe Di Dio Castagna
406
Bernardo Rippe Di Dio Castagna 2024.01.21 19:35 
 

The indicator I found has an impressive range of functions that offer endless possibilities for exploration. It includes Scalping, Reversal, Market structure, and Road features, among others. I'm grateful to have discovered it. The Support/Resistance features have been particularly helpful for all my strategies. Moreover, the user support and communication are excellent, and the Discord channel is very useful.

Sebastian Schmidt
1228
Sebastian Schmidt 2024.01.19 18:30 
 

Ja da geht die Sonne auf... Vielen Dank für die gute Arbeit und dieses geniale Handelssystem. Ein Muss für jeden der den Erfolg sucht, aber Erfolg bislang noch nicht konnte...

Steffen Schmidt
322
Steffen Schmidt 2024.01.19 13:44 
 

Now that I am happy to report a great result from my experience with this Indicator 4 feature are repainting, work on removing/ replacing these. Here’s my feedback for alerts/ notifications working flawlessly XAUUSD - M1 // SCALP BUY || 2409.28 || TP: 2409.58 || SL: 2408.98 // RelicusRoad XAUUSD - M1 // SuperTrend UpTrend 2024.07.31 14:36 // RelicusRoad XAUUSD - M1 // SuperTrend DownTrend 2024.07.31 14:45 // RelicusRoad XAUUSD - M1 // MAO BUY || 2420.43 // RelicusRoad

Dmitrii Corpan
485
Dmitrii Corpan 2023.11.06 22:29 
 

L'utilisateur n'a laissé aucun commentaire sur la note

Relicus LLC
20699
Réponse du développeur Waleed Ur Rehman 2023.11.07 06:35
Indicator manual has been sent to your private message
cyjj94118
101
cyjj94118 2023.11.05 05:35 
 

L'utilisateur n'a laissé aucun commentaire sur la note

Relicus LLC
20699
Réponse du développeur Waleed Ur Rehman 2023.11.05 06:32
Indicator manual and discord invitation link has been sent to your private message
manu kwabena
73
manu kwabena 2023.10.29 11:45 
 

The indicator is wonderful it works perfectly

njdatas
19
njdatas 2023.10.21 04:21 
 

L'utilisateur n'a laissé aucun commentaire sur la note

Relicus LLC
20699
Réponse du développeur Waleed Ur Rehman 2023.10.21 06:03
Indicator manual has been sent to your private message
Mohamed Asif
97
Mohamed Asif 2023.10.12 13:50 
 

I must say this is the best trade application over the months I have found with an affordable price, most importantly the support team is just out of this world. this is honest feedback from someone personally bought and tested the application as well as the user support. they will teach you trade skills with no cost. MARK the word NOCOST they will assist in helping and teaching trade tricks to gain extra money. the developer team are always reachable, and they will do everything possible to make sure application work as said. yes 100% profitable for an expert and a new trader. step by step assistance. not to mention but: Salahuddin is the best support person. super friendly and gives all ideas he can ... awesome work behind the product. 100% recommended for anyone to make a passive income.

Gwaihirwin
34
Gwaihirwin 2023.09.26 20:34 
 

Good indicator, the best I have used by far

Jake John Freeman
304
Jake John Freeman 2023.09.23 13:00 
 

I've come back to give 5* again! This indicator is 100% the most useful thing I have ever bought. The support team are fantastic. Great for all levels of trader, very reasonably priced for the quality of product. The thing I am most impressed with is the dedication of the support team and developer, they really do care about this product and their customers.

A Lixu
48
A Lixu 2023.09.15 17:33 
 

L'utilisateur n'a laissé aucun commentaire sur la note

TheStoneMX
135
TheStoneMX 2023.09.10 01:30 
 

Very nice tool!!! the only thing is that does not repaint well when you choose different time frames.... but I got aronund and creating a new chart for different timeframes. It has a lot of info, still trying to de decypher still some of it. but all good.

plushack
64
plushack 2023.09.08 14:30 
 

New user to RR and currently have both MT4 and MT5 versions. Considering MT5 version is quite a new release, it has few little bugs there and there, however... It doesn't affect my opinion on quality of this indicator. Developer behind it is constantly working on fixing bugs, adding functionality etc. It changed my overview on the market and improved my RRR quite much. Highly recommended.

janf1974
24
janf1974 2023.09.05 10:21 
 

I have only had it for a day so not in the position to really rate this but I used it to open my first trade this morning and made 1200 usd. I will need to really use it over time to give my hounest opinion. I am struggling to get good training material for this product as some features are still a black hole for me.

cutter44
201
cutter44 2023.08.26 23:37 
 

its cool

Denis Sokolovsky
421
Denis Sokolovsky 2023.08.25 23:08 
 

I have been waiting for months since I saw this product in the MT4 section, to be also available on MT5, and finally , it happened. There is a very good team behind the product who is working daily on it with a mind full of ideas. The product currently has a lot of bugs, but I believe it all will be fixed as soon as possible with the launch of MT5 version, and my full 5* is a gratitude and motivation for the team behind it. Thank you :)

189114nickynomates
788
189114nickynomates 2023.08.24 13:01 
 

A must have for every serious trader who wants to trade using disipline ans their own destiny. Will review more in a few weeks time. Price is a no brainer great introduction cost.

12
Répondre à l'avis
Version 2.270 2024.09.26
- Supertrend alerts improvement
Version 2.269 2024.09.21
- Performance Improvements
Version 2.268 2024.09.17
- A few bug fixes and improvements
Version 2.267 2024.09.16
- A few bug fixes
Version 2.266 2024.09.16
- Performance Improvement
Version 2.265 2024.09.14
- Fixed a bug
Version 2.264 2024.09.14
- Fixed a few bugs
Version 2.263 2024.09.10
**Update v2.263**
- Lots of performance improvements
- Minor bug fixes
- Updated logic of saving settings
Version 2.262 2024.09.05
- Added Alerts Settings Option
- Improved Performance for Dynamic Circles and a few other features
Version 2.261 2024.09.05
**Update v2.260**
- Added Settings -> Multi-TF Trend Bar
- Added Settings -> Advanced Chart Settings
- Performance Improvements
- A few reported bugs fixed
Version 2.259 2024.09.03
**Update v2.259**
- Added Alerts for SuperTrend
- Added Alerts for SignalCloud
- Added Alerts for Fractals
- Added Alerts for Trading Sessions
- Added Alerts for Multi-TF Trend Bar
- Improved -> SuperTrend
- Improved -> Performance
Version 2.258 2024.08.29
**Update v2.258**
- Added -> Daily Pivots Alerts
- Added -> Scalp Pivots Alerts
- Updated -> Dynamic Circles Alerts
- Updated -> Scalp Pivots Logic (more performance)
Version 2.257 2024.08.28
- Bug Fix
Version 2.256 2024.08.28
- Alerts Improved -> Road Levels
- Alerts Improved -> Action Levels
- Alerts Improved -> Daily High Low Open Levels
- Alerts Improved -> Signal Line 1 & 2
- A few improvements
Version 2.255 2024.08.14
- Fixed an SR Bug
- SR Alerts Functionality Added
- Road Alerts Functionality Added
Version 2.253 2024.08.11
- Fixed a few bugs and improved performance
- Added Alert On/Off buttons for all the 19 features
- Added Dynamic Circles Settings
- Added SuperTrend Settings
- Added Signal Cloud Settings
- Added Fractals Settings
- Added Trading Sessions Settings
- Added Reversal Arrows Settings
- Added Scalping Arrows Settings
- Added Trend Arrows Settings
- Added Global Arrows Settings
- Added Candle Arrows Settings
Version 2.252 2024.08.05
Minor Input Bug Fix
Version 2.251 2024.08.05
- Added Dynamic Circles Settings Window
- Added Supertrend Settings Window
- Added Signal Cloud Settings Window
- Added Fractals Settings Window
- Added Sessions Settings Window
- Fixed Sessions bug that made them not display for the current day
Version 2.250 2024.08.03
- Updated Color Schemes
Version 2.249 2024.08.03
- Revised Scalp Pivots Algo
- Added Scalp Pivots Settings
- Improved a lot of things in the background
Version 2.247 2024.07.31
- Added Daily Pivots Settings
Version 2.246 2024.07.30
- Performance Improvements
Version 2.244 2024.07.29
- Massive Performance Improvement
Version 2.243 2024.07.24
- Performance Improvements
Version 2.242 2024.07.23
**Critical Update v2.242 **
- Fixed SR issue
Version 2.241 2024.07.22
- Daily High/Low/Open label issue fixed
Version 2.240 2024.07.21
- SR Multi-TF Fix
- Daily HLO settings added
Version 2.239 2024.07.18
- Performance Update
Version 2.238 2024.07.18
- Replaced FairValueGaps with MultiTF TrendBar Button (FVGs will be back in the coming updates, they are removed due to display conflict)
- Signal Lines Settings Added
- Improved performance
- Fixed a few bugs
Version 2.237 2024.07.12
- Lots of improvements
Version 2.236 2024.07.09
- Performance Improvements
Version 2.235 2024.07.09
- Designed to be a very stable version
Version 2.234 2024.07.06
- Updated Road Settings Feature
- Updated Support & Resistance Settings Feature
- Updated Action Levels Settings Feature
- Fixed the Refresh button not recalculating issue.
- Improved performance
Version 2.231 2024.06.27
Performance improvements
Version 2.230 2024.06.25
* Fixed a bug
Version 2.229 2024.06.23
**Added Settings Tab**
**Added Videos Tab**
**Added lots of features and improved performance**
Version 2.228 2024.05.14
-- Improved icons scaling
-- Added color settings for fractals
Version 2.227 2024.02.22
Session Times updated.
Version 2.226 2024.02.21
**Updates:**
1. 🕹️ **All Candle Patterns Now Toggleable in Input Settings**
2. 🛠️ **Fixed Profit/Loss Calculations Issue**
3. 🔧 **Added Action Level Adjustment Input (Multiplier)**
4. 🕒 **Added Session Names at Server Time**
5. 📈 **Updated Fair Value Gaps Input Values**
Version 2.225 2024.02.20
📊 Daily High/Lows Correctly Displayed for Higher Timeframes
🔄 Daily Pivots Improved for Accurate Display on Higher Timeframes
Version 2.224 2024.02.19
**Updates:**
1. 🛠️ **Fixed Bug for Fair Value Gaps**
2. 🚀 **Significant Performance Improvement**
Version 2.223 2024.02.17
🛠️ **Signal Cloud Histogram Fixed** for MT4 and MT5
Version 2.222 2024.02.17
**Updates:**
1. ✨ **Added Fair Value Gaps** (As Requested)
2. 🔄 **Replaced Multi-TF Trend Button with Fair Value Gaps Button** (Moved to Input Settings)
3. 🆕 **Updated Icons** for Signal Lines, Daily High/Lows & SuperTrend
Version 2.221 2024.02.15
**Updates:**
1. 📅 **Sessions Now Show Upcoming Sessions**
2. 🔛 **Added Multiple On/Off for Candle Patterns** (Input Settings)
3. 🐛 **Fixed a Dynamic Circles Bug**
4. 🚀 **Performance Improvement**
Version 2.220 2024.02.10
**Updates:**
1. 🛠️ **Fixed - Chart Theme Not Changing on MT5** (Theme Change Icon)
2. ⏱️ **Added - Manual Offset to Session Times**
3. 🔄 **Events Revised - for better compatibility with other EAs and Indicators**
4. 🌗 **Fixed - Dark and Light Theme Issue**
Version 2.219 2024.02.06
**Updates:**
1. 🔘 **Option to Disable Dynamic Circles Labels**
2. 🚀 **Updated Dynamic Circles Performance** (Reduced Chart Issues)
3. 🐛 **Issue Fixed: SuperTrend Disappears on Pressing Refresh Button**
Version 2.218 2024.02.01
**Updates:**
1. 🏷️ **Added Labels to Dynamic Circles**
2. 🔢 **SR Extend to 10 Future Bars**
3. 🚨 **Improved Alerts** (Option to turn off Dynamic Circles Alerts)
4. 📊 **Daily High Lows Extended to All Timeframes**
5. 🏷️ **Corrected Daily High Lows Labels on All Timeframes**
6. 📈 **Performance Improvements**
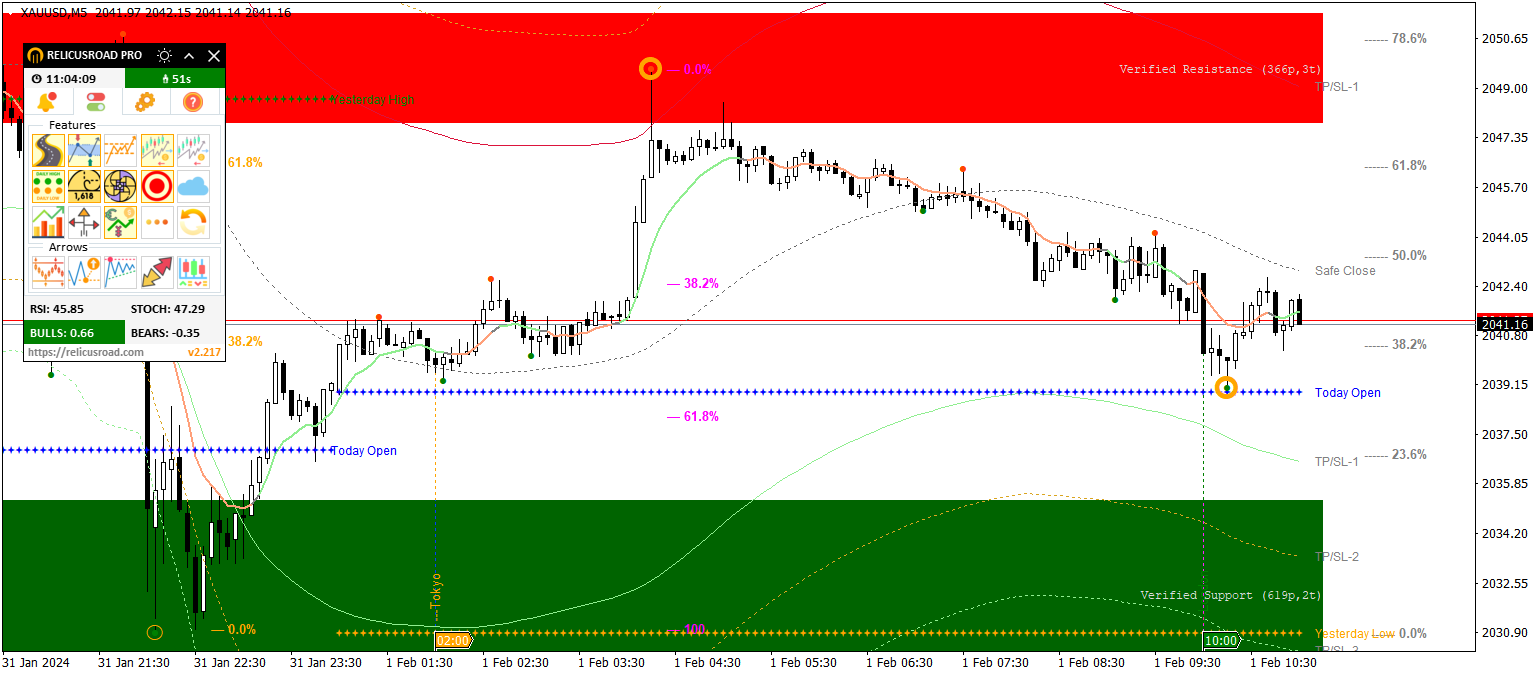
Version 2.217 2024.01.31
**Updates:**
1. 🛠️ **Added Tooltips to Arrows** (More details in next update)
2. 🔧 **Improved SR Labels Alignment**
3. 🔍 **Increased SR Minimum Box Length**
4. 🔄 **Changed Arrow Count in Reversal Arrows**
5. 📝 **Fixed Naming Scheme in Strat 5 and MAO Arrows**
6. 📐 **Fixed SR Text Alignment**
7. 🚀 **Dynamic Circles Performance Improvements** (Optimized Code)
8. ✏️ **Renamed DynamicReversals to DynamicCircles**
9. 📈 **General Performance Improvements**
Version 2.216 2024.01.30
**Updates:**
1. ✨ **Added Slow Calculations Option to Dynamic Circles**
2. 🎨 **Added Features Background Tint & Automated Colors**
3. 🛠️ **Fixed Tooltip Position and Size**
4. 🐛 **Fixed SR Display Issue (When Enabled Later)**
5. 🔧 **Fixed Road Text Colors (Improved Visibility on White)**
Version 2.215 2024.01.29
**Updates:**
1. 🚀 Performance Improvements
2. 📊 Default to Tab 2 in Tester
3. 🧩 Separated Fractals from SR
4. 🔧 Size & Width Settings for Strategy 5
5. 📈 TPs Strategy 5
6. 🛠️ Preparation of Feature Settings on InfoPanel
7. 🕒 "Coming Soon" Added
Version 2.214 2024.01.29
A few improvements
Version 2.213 2024.01.28
**Updates:**
1. 🛠️ Alerts Fixed
2. ➕ Dynamic Circles Alerts
3. ➕ SuperTrend Alerts
4. 🎨 Color/Width Settings Expanded (see input settings)
5. 📈 SupportResistance Optimization
6. 🚀 Buffers Enhanced
7. 🐛 Removed Array Out Of Range Bug
Version 2.212 2024.01.24
New Features:
"Refresh Button on InfoChart" - Instantly fix chart issues with a new refresh button.
"SuperTrend TimeFrame Selection" - Select different time frames for SuperTrend analysis.
"SuperTrend Alerts" - Receive alerts for SuperTrend indicators.

Improvements:
General enhancements for a smoother user experience.
Version 2.211 2024.01.23
** Buttons extended functionality added
Version 2.210 2024.01.22
-- Update
** Applied a lot of improvements to avoid bugs
** Added buttons for controlling the On/Off

-- Next Update
** Optimization of features
** Detailed settings
** A few bug fixes
Version 2.209 2024.01.18
** Bugs Fixes
** Added Icons for Features
Version 2.208 2024.01.15
** UI Updates
** Bugs Fixes
Version 2.207 2024.01.09
* Major Update Part 1/3
Version 1.219 2023.11.01
* Fixed a few bugs
Version 1.218 2023.10.30
* A few performance improvements
* Colorblind fix
Version 1.217 2023.10.30
* Color settings should now work properly

* Size f signals can now be adjusted through input settings
Version 1.216 2023.10.30
* Alerts should now work better
Version 1.215 2023.10.17
Performance Updates
Version 1.214 2023.10.14
* Strategy 5 arrows now work

* Added strategy selection option (features will automatically turn on/off according to the strategy)

* Alerts optimized

* A few performance improvements
Version 1.213 2023.10.12
-- Limit Bars added
Version 1.212 2023.10.11
Fixed Alerts Issue
Version 1.210 2023.09.29
Bug Fixes
Version 1.209 2023.09.29
A few performance updates
Version 1.208 2023.09.22
Rerolled a few changes to fix the bugs.
Version 1.207 2023.09.08
* A fix option added to avoid conflict with Trade Manager/Assistant
Version 1.206 2023.09.08
* Bugs fixes
Version 1.205 2023.08.29
A few improvements
Version 1.203 2023.08.26
* Removed Signal Cloud because of bugs
Version 1.202 2023.08.24
A few fixes.
Version 1.201 2023.08.23
Version Fix
Version 1.2 2023.08.23
* Added Reversal Arrows

* Fixed a few bugs

* Improved performance
Version 1.1 2023.08.21
Added: Background now changes with the theme.