TrendCheck
- Indicateurs
- Pavel Krysanov
- Version: 1.0
- Activations: 5
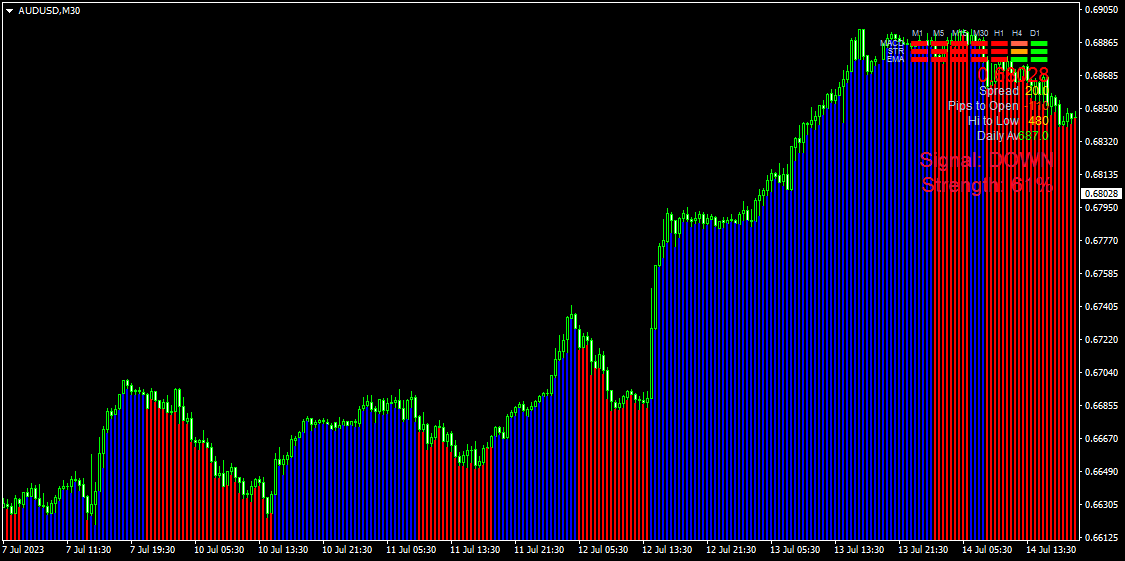
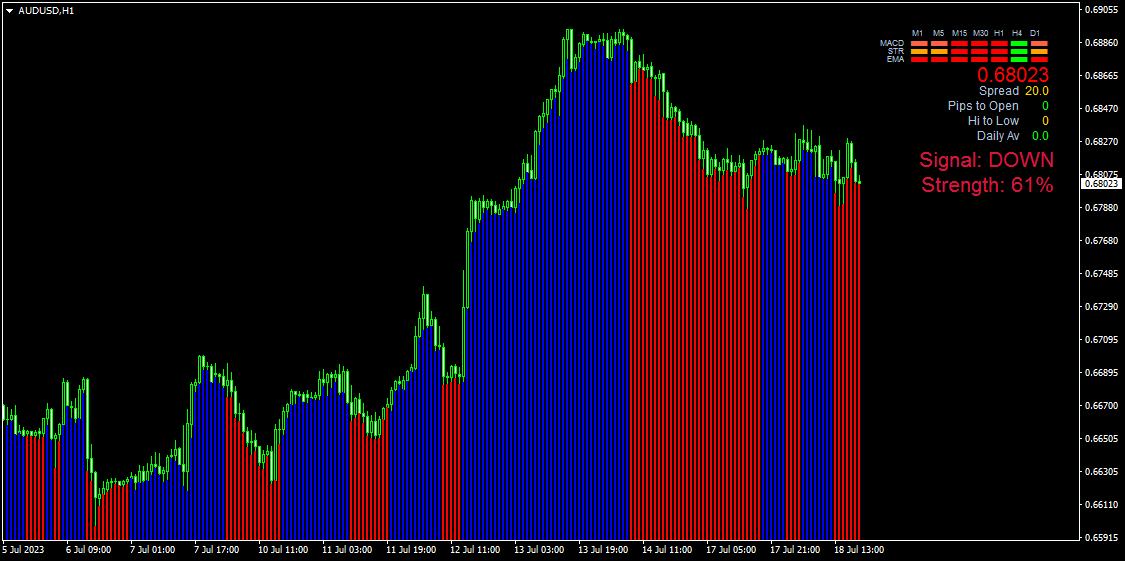
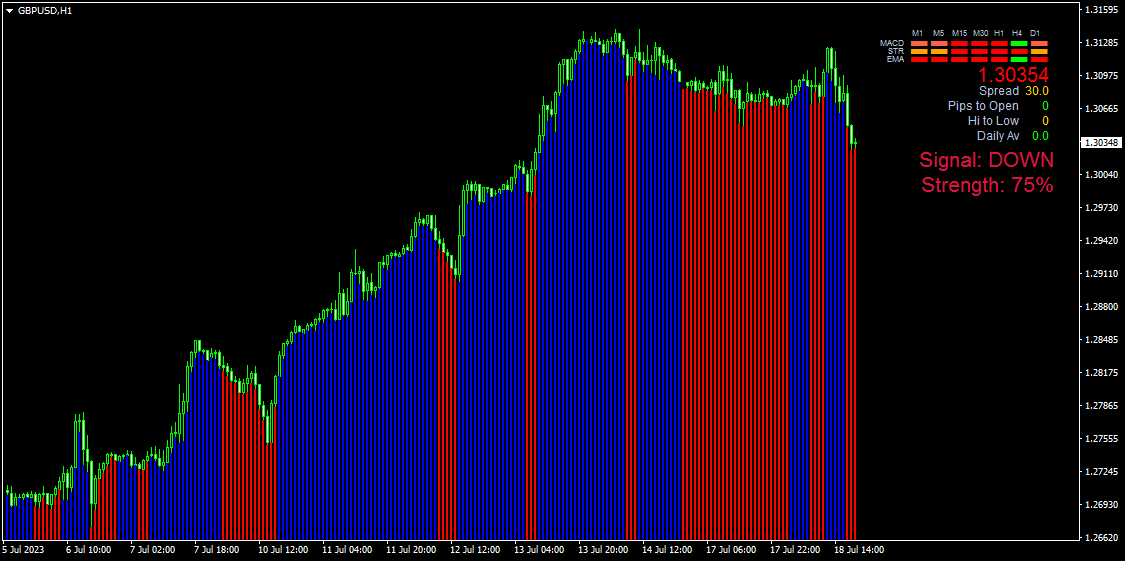
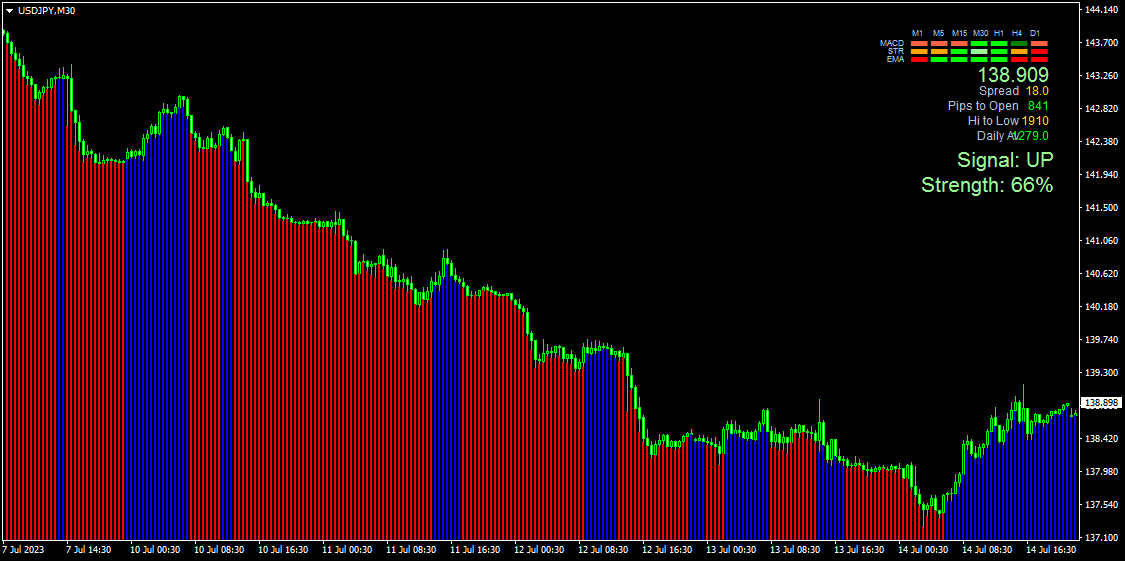
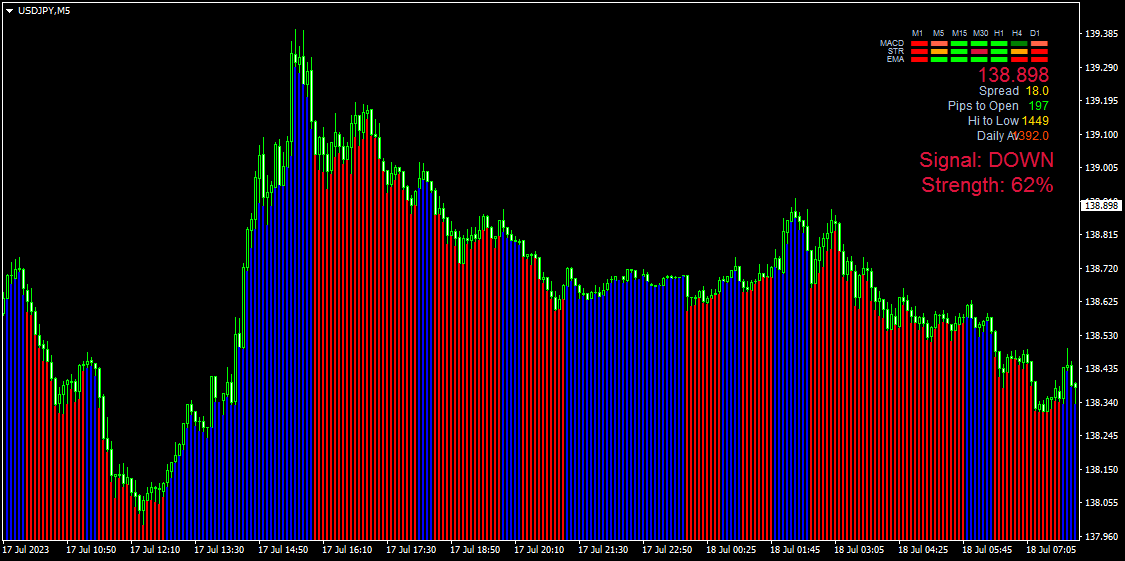
Cet indicateur dessine une ligne horizontale bleue ou rouge sous chaque bougie, qui indique la direction de la tendance. La ligne bleue signifie que la tendance est à la hausse, la ligne rouge est la tendance à la baisse.
L'indicateur a une nouvelle logique, qui le distingue considérablement de nombreux analogues. Il donne des signaux d'entrée et de sortie précoces, ne redessine pas ses valeurs - c'est-à-dire que si l'indicateur a donné un signal pour entrer dans une transaction, alors ce signal ne disparaîtra pas et ne bougera pas - il restera là où il est apparu, et il donne également des signaux à l'ouverture d'une bougie, ce qui donne au trader un avantage significatif dans le trading.
L'indicateur est très facile à utiliser. Lorsqu'une ligne rouge apparaît sous les bougies, vous devez ouvrir une transaction de VENTE, et lorsqu'une bougie bleue apparaît, vous devez ouvrir une transaction d'ACHAT.
Un indicateur est affiché dans le coin supérieur droit de l'indicateur, qui indique la direction de la tendance sur toutes les périodes de la paire sélectionnée, ainsi que le signal actuel et sa force.
Paramètres de l'indicateur :
période - période indicatrice
EnableAlerts - la présence d'un signal sonore
EmailAlert - envoyer un message électronique lorsqu'un signal se produit
MobileAlert - envoyer un message mobile lorsqu'il y a un signal
ShowInformation - s'il faut afficher des informations sur la direction de la tendance et sa force dans le coin supérieur gauche