Easy ICT Price Action For MT5
- Indicateurs
- Han Qin Lin
- Version: 7.8
- Mise à jour: 9 mars 2024
- Activations: 10
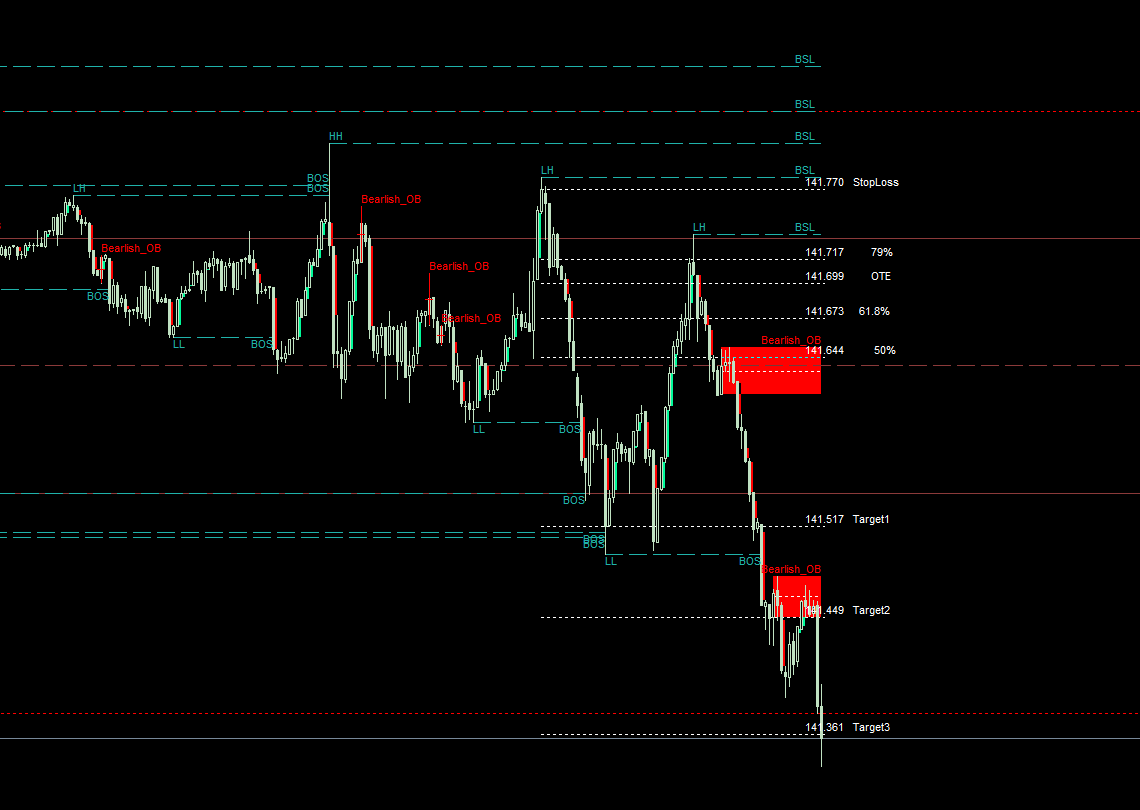
ICT, SMC, Smart Money Concept, Support and Resistance, Trend Analysis, Price Action, Market Structure, Order Blocks, Breaker Blocks, Momentum Shift, Strong Imbalance, HH/LL/HL/LH, Fair Value Gap, FVG, Premium & Discount Zones, Fibonacci Retracement, OTE, Buyside Liquidity, Sellside Liquidity, Liquidity Voids, Market Sessions, NDOG, NWOG,Silver Bullet,ict template
Dans le marché financier, une analyse de marché précise est cruciale pour les investisseurs. Pour aider les investisseurs à mieux comprendre les tendances du marché et la liquidité, nous fournissons un manuel d'utilisation pour une analyse de marché avancée. Voici une brève introduction à certaines fonctionnalités et à leurs méthodes de mise en œuvre :
1. Affichage de la structure du marché à haut délai :
En définissant des paramètres, vous pouvez afficher la structure du marché à haut délai sur le graphique. Cela vous aidera à mieux comprendre les tendances et la structure générale du marché. Vous pouvez personnaliser la période de temps en fonction de vos besoins et afficher la structure du marché sur le graphique.
2. Affichage de la liquidité :
La liquidité est l'un des indicateurs importants sur le marché. En définissant des paramètres, vous pouvez afficher la liquidité des acheteurs et des vendeurs sur le graphique. Vous pouvez personnaliser le texte et les couleurs pour mieux identifier les différents niveaux de liquidité. Vous pouvez également choisir d'afficher la liquidité pendant la session de Londres AM et l'heure du déjeuner de New York.
3. Affichage de l'écart de valeur équitable :
L'écart de valeur équitable désigne la différence entre le prix du marché et la valeur équitable. En définissant des paramètres, vous pouvez afficher l'écart de valeur équitable sur le graphique et utiliser différentes couleurs pour indiquer s'il est en hausse ou en baisse. Cela vous aidera à mieux comprendre la relation entre l'offre et la demande sur le marché.
4. Affichage de la session de Londres AM :
La session de Londres AM est une période importante sur le marché des changes. En définissant des paramètres, vous pouvez afficher la plage horaire de la session de Londres AM sur le graphique et personnaliser la couleur de fond et le style de ligne. Cela vous aidera à mieux saisir les caractéristiques et les tendances du marché de Londres.
5. Affichage de l'heure d'ouverture de New York :
L'heure d'ouverture de New York est un autre moment important sur le marché des changes. En définissant des paramètres, vous pouvez afficher l'heure d'ouverture de New York sur le graphique et personnaliser les couleurs et les styles de ligne. Cela vous aidera à mieux comprendre la situation à l'ouverture du marché de New York.
6. Affichage de l'écart de la plage d'ouverture :
L'écart de la plage d'ouverture désigne la différence entre le prix d'ouverture du marché et le prix de clôture de la veille. En définissant des paramètres, vous pouvez afficher l'écart de la plage d'ouverture sur le graphique et personnaliser les couleurs pour l'identification. Cela vous aidera à mieux comprendre la situation à l'ouverture du marché.
7. Affichage du Silver Bullet Time :
Le Silver Bullet Time désigne des moments spéciaux sur le marché. En définissant des paramètres, vous pouvez afficher le Silver Bullet Time sur le graphique et personnaliser les couleurs pour l'identification. Cela vous aidera à mieux saisir les opportunités importantes sur le marché.
8. Affichage de la session de New York AM :
La session de New York AM est une autre période importante sur le marché des changes. En définissant des paramètres, vous pouvez afficher la plage horaire de la session de New York AM sur le graphique et personnaliser la couleur de fond et le style de ligne. Cela vous aidera à mieux saisir les caractéristiques et les tendances du marché de New York.
9. Affichage de la session de New York PM :
La session de New York PM est une autre période importante sur le marché des changes. En définissant des paramètres, vous pouvez afficher la plage horaire de la session de New York PM sur le graphique et personnaliser la couleur de fond et le style de ligne. Cela vous aidera à mieux saisir les caractéristiques et les tendances du marché de New York.
10. Affichage des niveaux de prix élevés/bas précédents sur une base quotidienne/hebdomadaire/mensuelle :
En définissant des paramètres, vous pouvez afficher les niveaux de prix élevés et bas précédents sur le graphique sur une base quotidienne, hebdomadaire et mensuelle. Cela vous aidera à mieux comprendre les tendances des prix et les niveaux importants sur le marché.
Ce sont quelques-unes des fonctionnalités et des méthodes de mise en œuvre de notre analyse de marché avancée. Vous pouvez ajuster les paramètres en fonction de vos besoins et ajouter les extraits de code à votre code pour obtenir les fonctionnalités souhaitées. Nous espérons que ce manuel d'utilisation vous aidera à mieux analyser et prendre des décisions sur le marché. Bonne chance dans vos investissements !


Super Bien