Holy Trinity Volatility
- Indicateurs
- Adeniyi Adedipe
- Version: 1.737
- Mise à jour: 25 avril 2024
- Activations: 7
Holy Trinity Volatility Indicator
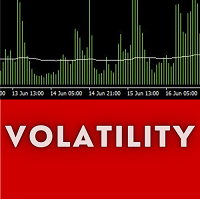
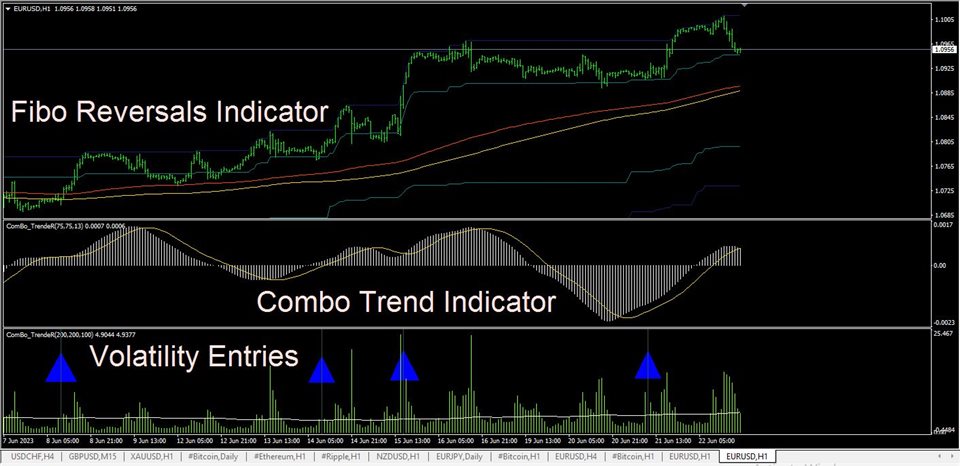
This indicator reflects the peak time of the day wherein there's is expected to be sharp price actions. It also presents the markets as just waking up from the dull and less volatile Asian (and or London) trading sessions into a bustling time of highly liquid price flows.
NOTE:
This indicator informs the trader ahead of peak price movements - one bar just before the real actions starts.
Enter when the volatility line falls below the Tripple Exponential Moving Average Signal line. This represents a calm time for market entry or exit.
