Oracle Scalper
- Indicateurs
- Andrey Kozak
- Version: 2.0
- Mise à jour: 27 juin 2023
- Activations: 20
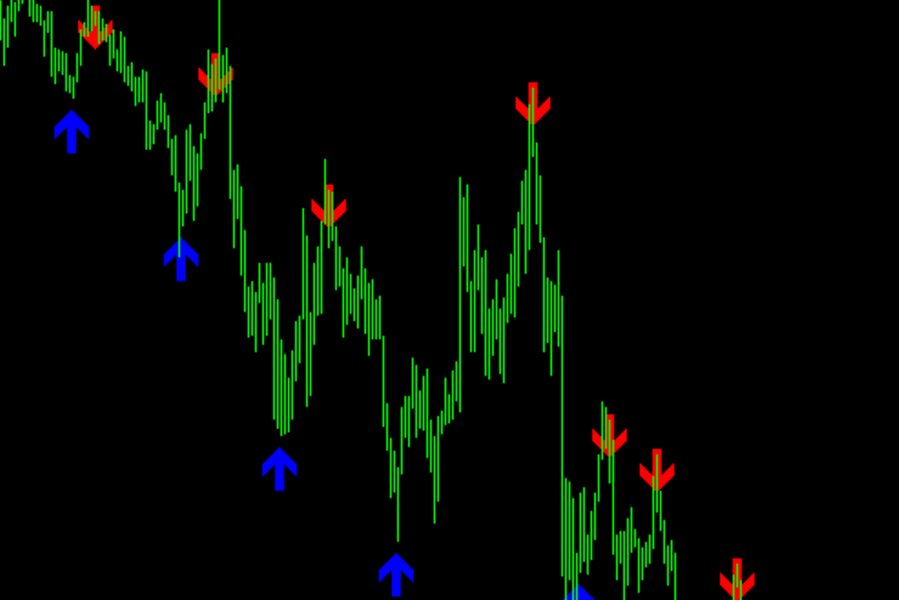
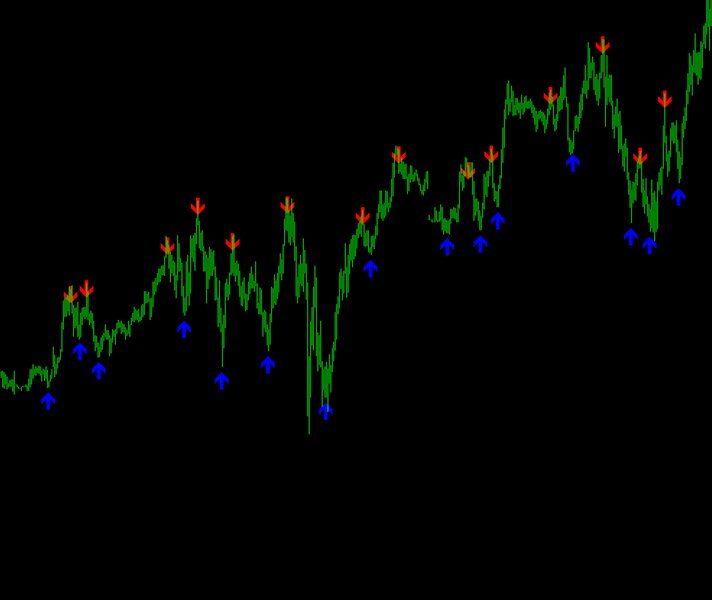
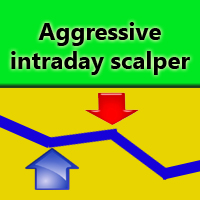
An arrow indicator is an indicator that displays arrows on a chart to indicate the direction of the market. The red arrow indicates an implied down move, while the blue arrow indicates an implied up move. The indicator works on all timeframes and all currency pairs.
Trading strategy based on arrow indicator:
Position entry:
- When the red arrow appears, open a sell position (short).
- When the blue arrow appears, open a buy position (long).
- Entry is made at the opening of the next bar after the arrow appears.
- The lot size is calculated taking into account the parameters of risk and available capital.
Position management:
- Set the Stop Loss level at a distance of 50-150 from the entry point, depending on the currency pair.
- Additionally, you can apply a trailing stop to protect profits and protect against potential reverse movements.
Closing a position:
- Close the position upon reaching the Take Profit level, which can be set at a distance of 25-45 points (depending on the currency pair) from the entry point.
- If an opposite arrow appears, close the current position and open a new position according to the new direction.
Indicator settings:
- period - specify the averaging period.
- UpperBorder - the upper border of the channel for opening sell trades.
- LowerBorder - the lower border of the channel for opening buy trades.
- moment - Averaging period for calculating the iMomentum indicator.
- sar - iSAR indicator period.
- width - specify the size of the signal arrows that are displayed on the screen.

