ZigZag Support Resistance
- Indicateurs
- Emmanuel Tshepang Mosweu
- Version: 1.0
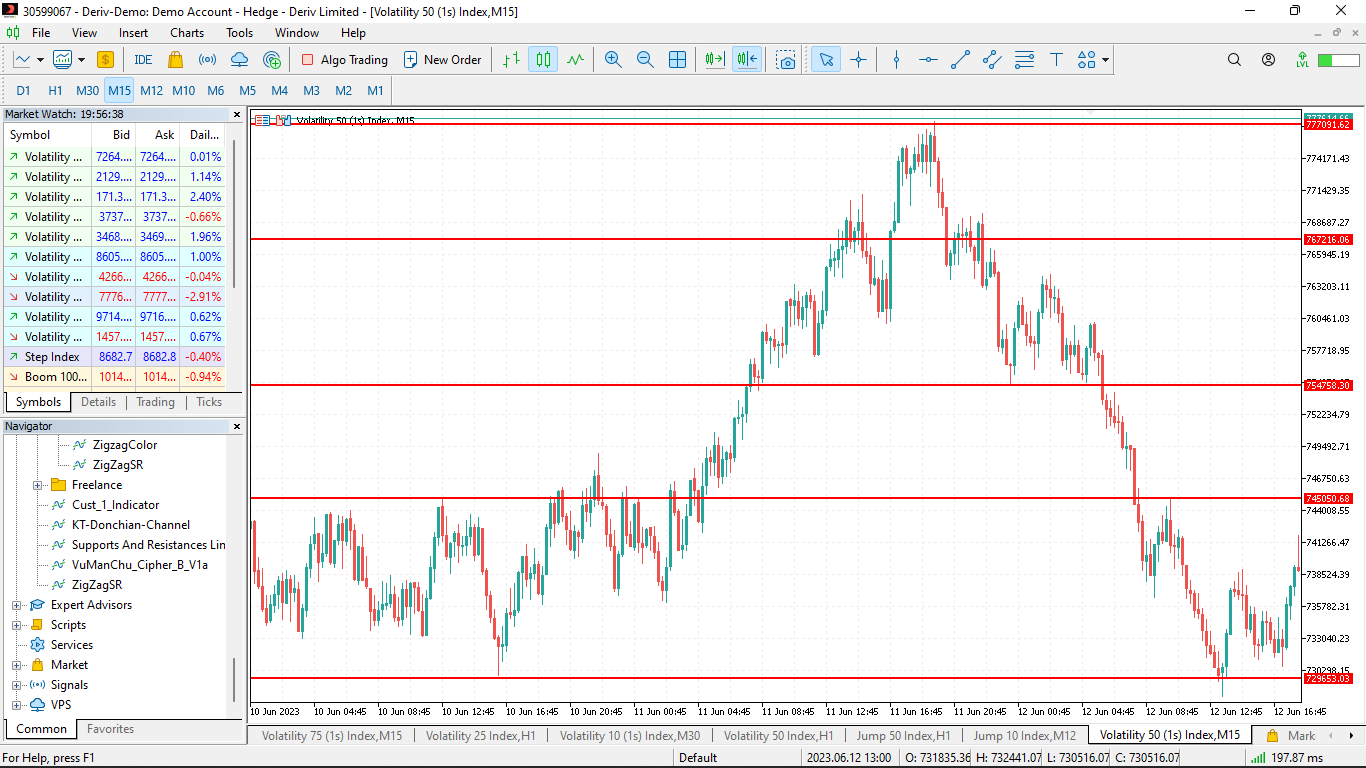
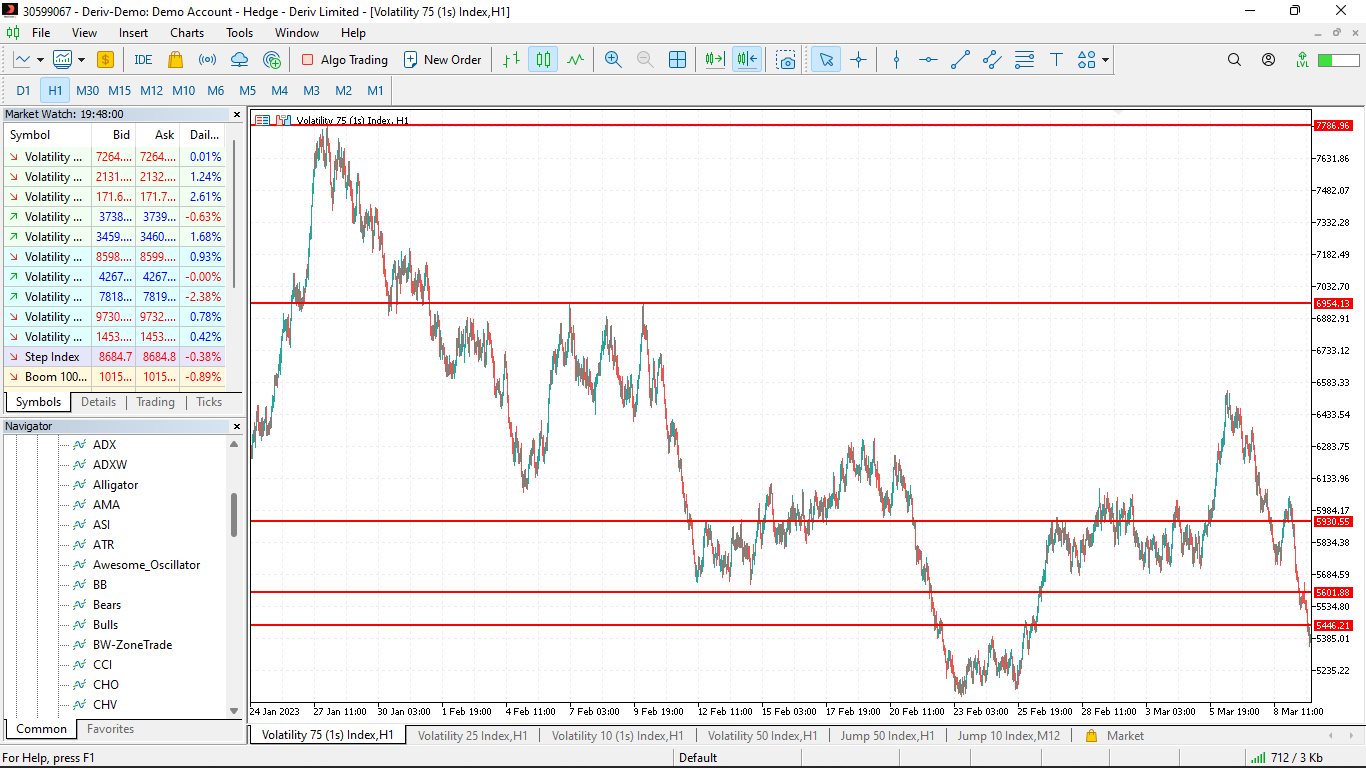
This indicator uses the Zigzag indicator to identify swing highs and swing lows in the price chart. Once it has identified the swing highs and swing lows, it can use them to determine potential support and resistance levels. A support level is formed when the price drops and bounces back up from a swing low, indicating that there is buying pressure at that level. A resistance level is formed when the price rises and reverses downward from a swing high, suggesting selling pressure at that level.
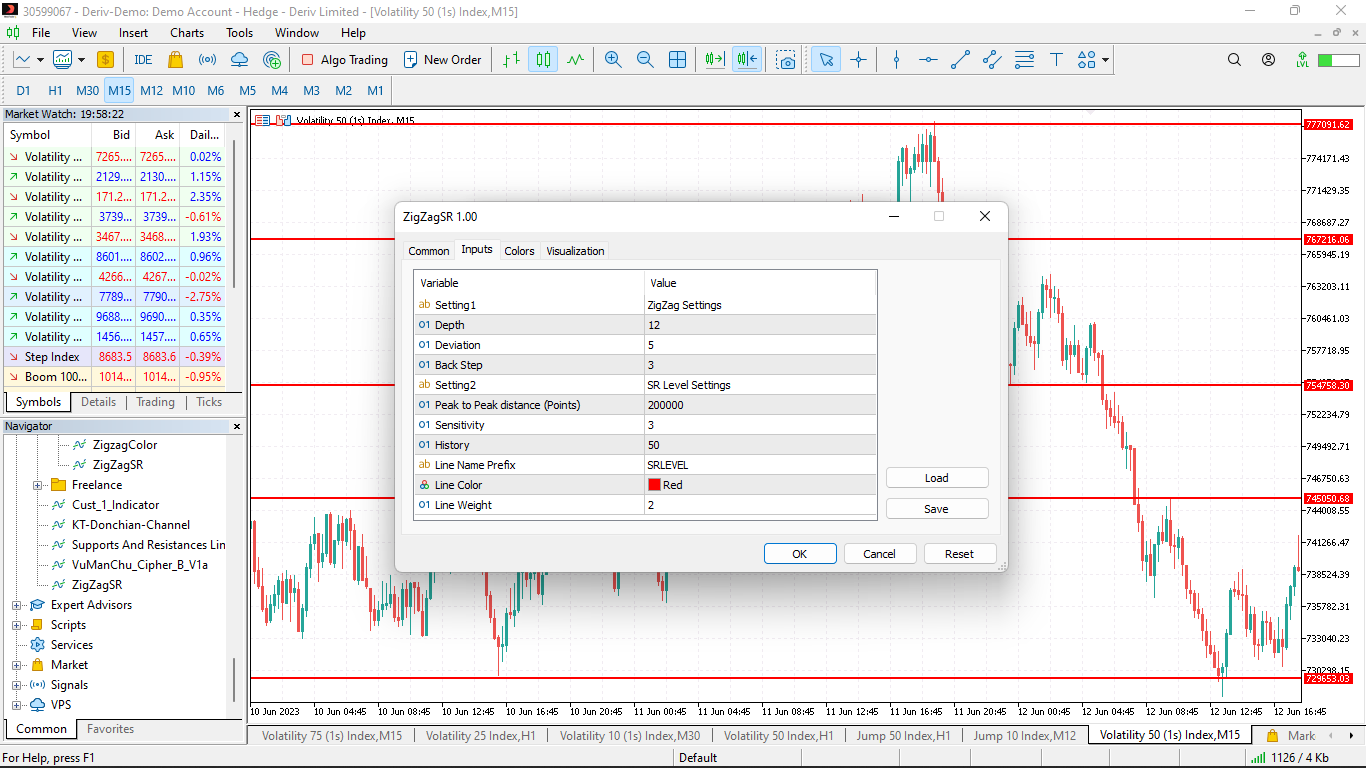
Parameters:
ZigZag Settings: Depth, Deviation & Back Step
SR Level Settings:
Peak to Peak distance (Points): The distance in which the indicator searches for peaks that form a resistance/Support zone. The higher the distance the the few the levels. This parameter can be used to filter out inconsistencies (noise) in the Peaks.
Sensitivity: How many peaks found in a similar zone could be considered as peaks.
History: How many Peaks from the present time to consider when searching for the SR levels
Line Colour: Colour of the SR Levels
Line Weight: Size of the SR Levels
This indicator can help with the following:
-
Confirming trend reversals: The Zigzag indicator can be useful in confirming potential trend reversals. When the indicator changes direction, it suggests a shift in the price momentum. Traders can look for instances where the indicator changes from making higher swing highs to lower swing highs (or vice versa) to identify possible trend reversals.
-
Highlighting chart patterns: The Zigzag indicator can help highlight various chart patterns, such as double tops, double bottoms, head and shoulders patterns, and more. These patterns often indicate potential trend reversals or continuation patterns. By combining the Zigzag indicator with pattern recognition, traders can gain additional insights into the market's direction.
-
Setting dynamic stop-loss levels: Support and resistance levels identified by the Zigzag indicator can be used as dynamic stop-loss levels. When entering a trade, you can set your stop-loss order slightly below the support level for long positions or above the resistance level for short positions. This approach allows you to manage risk and protect your capital.


Nice indicator, is verifying its effectiveness in the gold variety, thank you author