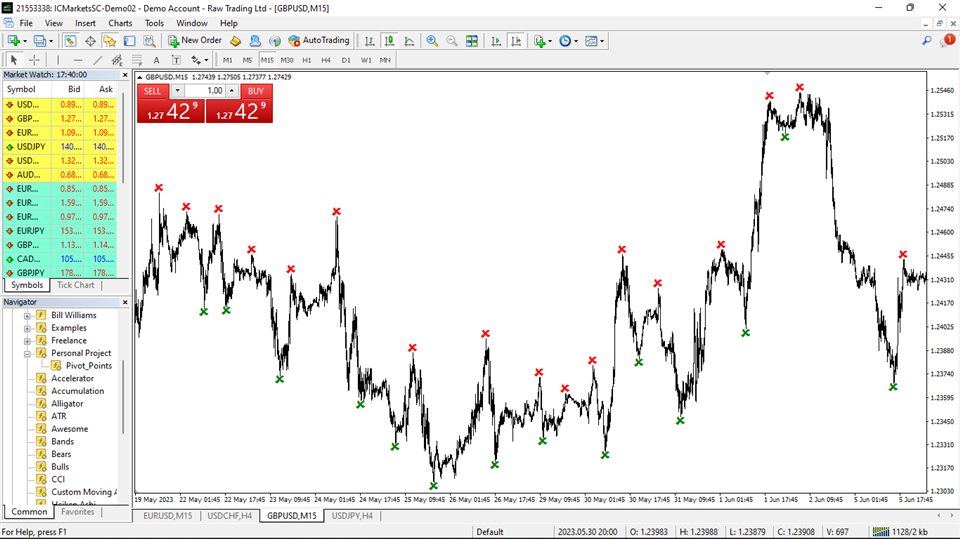
Th indicator is a technical analysis tool that helps identify significant changes in price trends and filter out minor price fluctuations. It is used to highlight price swings and provide a clearer picture of market movements. The Pivots are found by checking if a certain candle is the highest/lowest in a given number of candles that come before and after it. This indicator has only one input, its period. The Higher the period, the more strict the indicator is about what constitutes a Pivot. This indicator an be useful in the following ways:
1. Identification of Price Swings: This indicator marks the peaks and troughs of price movements, filtering out noise and focusing on larger price swings.
2. Visualization of Trends and Reversals: This indicator provides a visual representation of price trends and reversals. By identifying the swing highs and lows, it creates a series of visuals that form a pattern on the chart. Traders can easily identify the direction of the prevailing trend based on Price action shown. High highs and Higher lows signify an up trend, and lower highs and lower lows signify a down trend.
3. Filtering Noise and Consolidation: One of the key benefits of this indicator is its ability to filter out minor price fluctuations, noise, and sideways consolidation. By focusing on significant price swings, it helps traders see the broader trend and potential trading opportunities.
4. Support and Resistance Levels: This indicator can also be used to identify potential support and resistance levels. When the price breaks through a previous swing high or low marked by the Pivot Points, it could signal a breakout and the establishment of a new support or resistance level.
5: High Highs and Higher Lows: It helps traders quickly identify price action patterns.
It's important to note that this indicator should not be used in isolation and is best utilized as part of a comprehensive trading strategy. It provides a simplified view of price swings and helps traders identify trends and important levels, but it does not provide specific buy or sell signals. As with any technical indicator, it is recommended to combine it with other analysis techniques for more accurate decision-making.


guter Indikator in Zusammenarbeit und Auswertung anderer Indikatoren