Fast Polynom moving average and channel
- Indicateurs
- BeeXXI Corporation
- Version: 2.22
- Mise à jour: 7 juillet 2024
- Activations: 7
A useful and convenient tool for traders when analyzing and making decisions.
Peculiarity
- The main feature of this indicator is its fast algorithm.
- The gain in the speed of calculating the polynomial and its value of the standard deviation in comparison with classical algorithms reaches several thousand times.
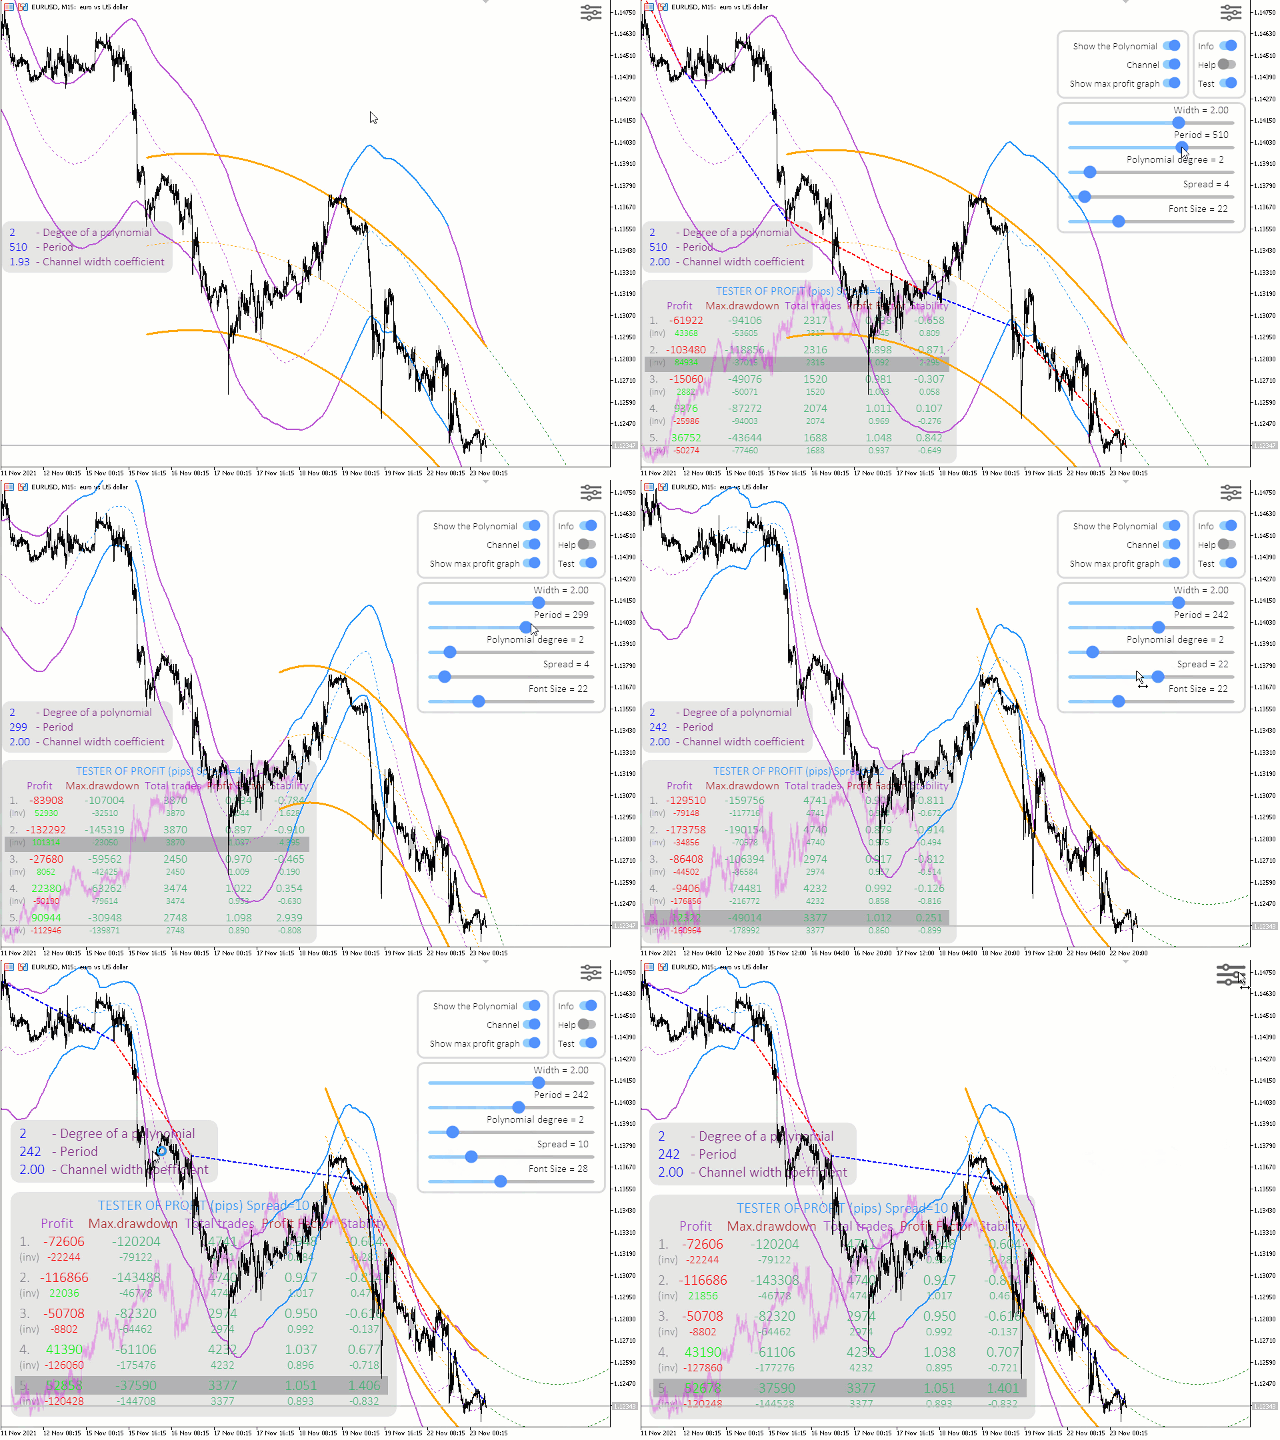
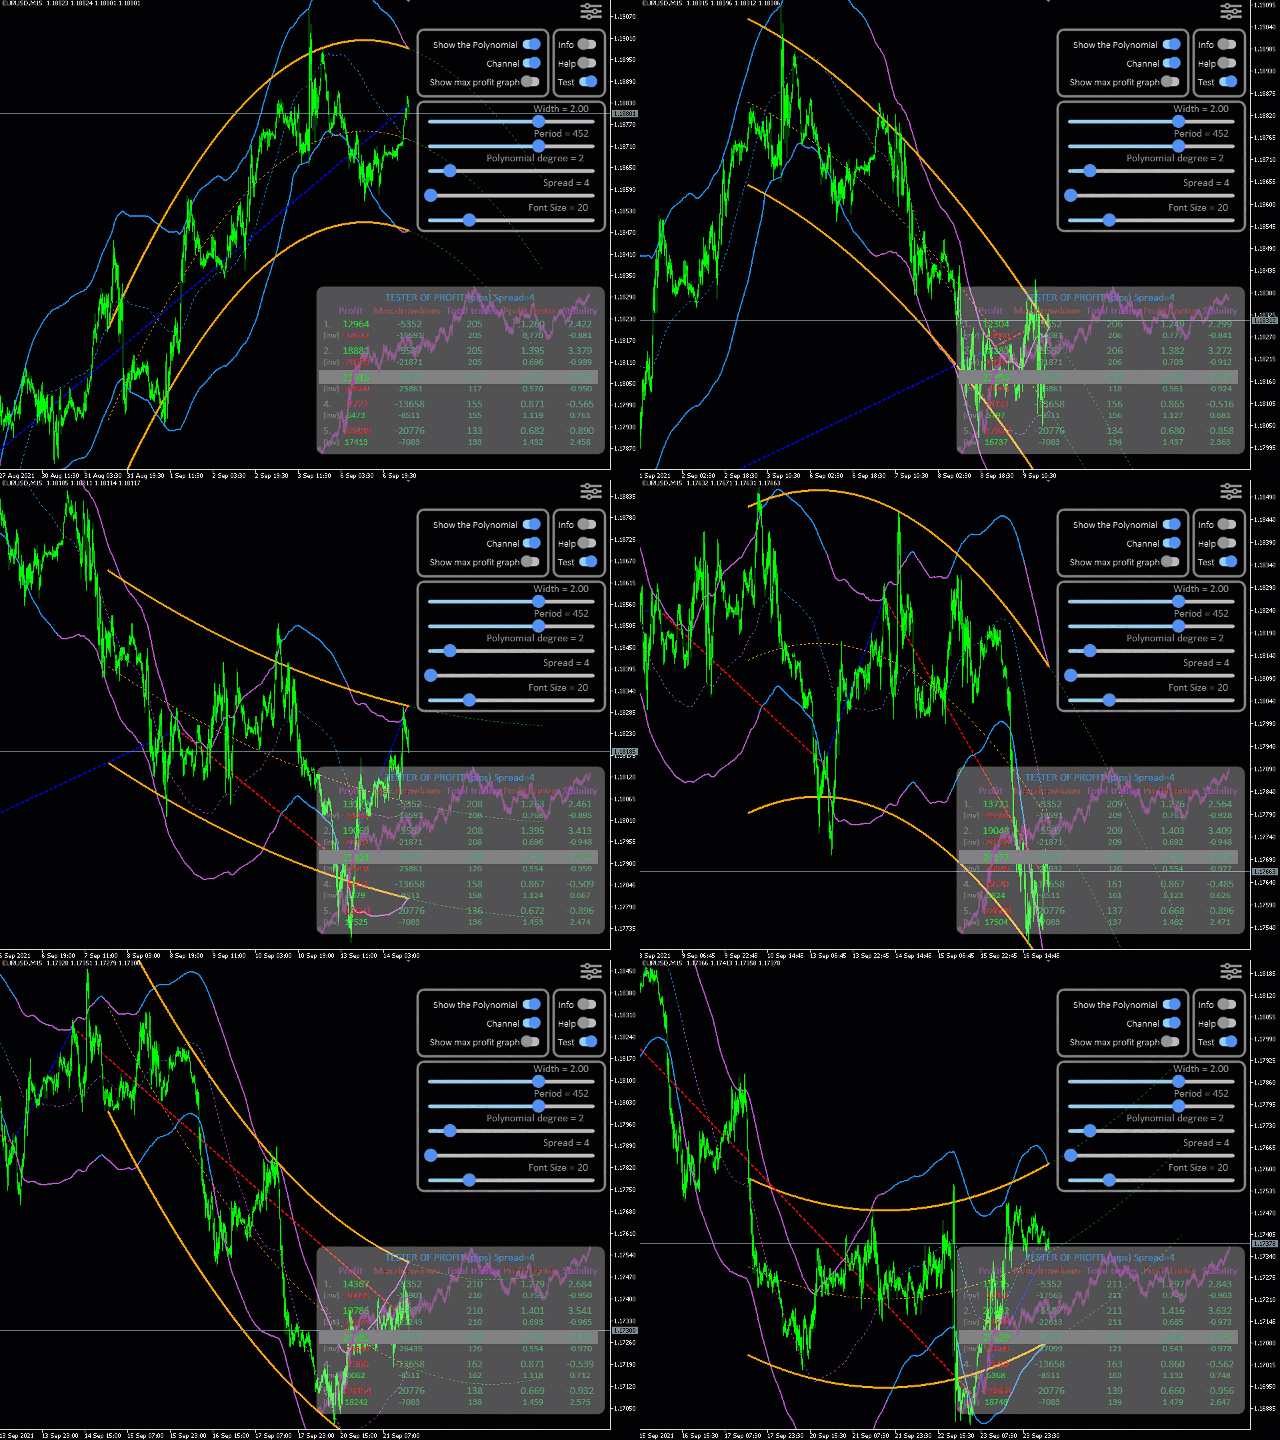
- Also, this indicator includes a Strategy Tester with a clear visualization of transactions, an equity chart and simultaneous calculation and display of the following data in the form of a table:
- profit (in points)
- maximum drawdown (in points)
- total number of transactions
- profit Factor (total profit / total loss)
- stability (total profit / maximum drawdown)
Built-in tester
- 20 strategies are given as an example: 5 channel and 5 non-channel, as well as their inverse strategies (when Sell and Buy are swapped).
- A brief description of the strategies can be seen by hovering the mouse pointer over the line in the tables of the corresponding strategy.
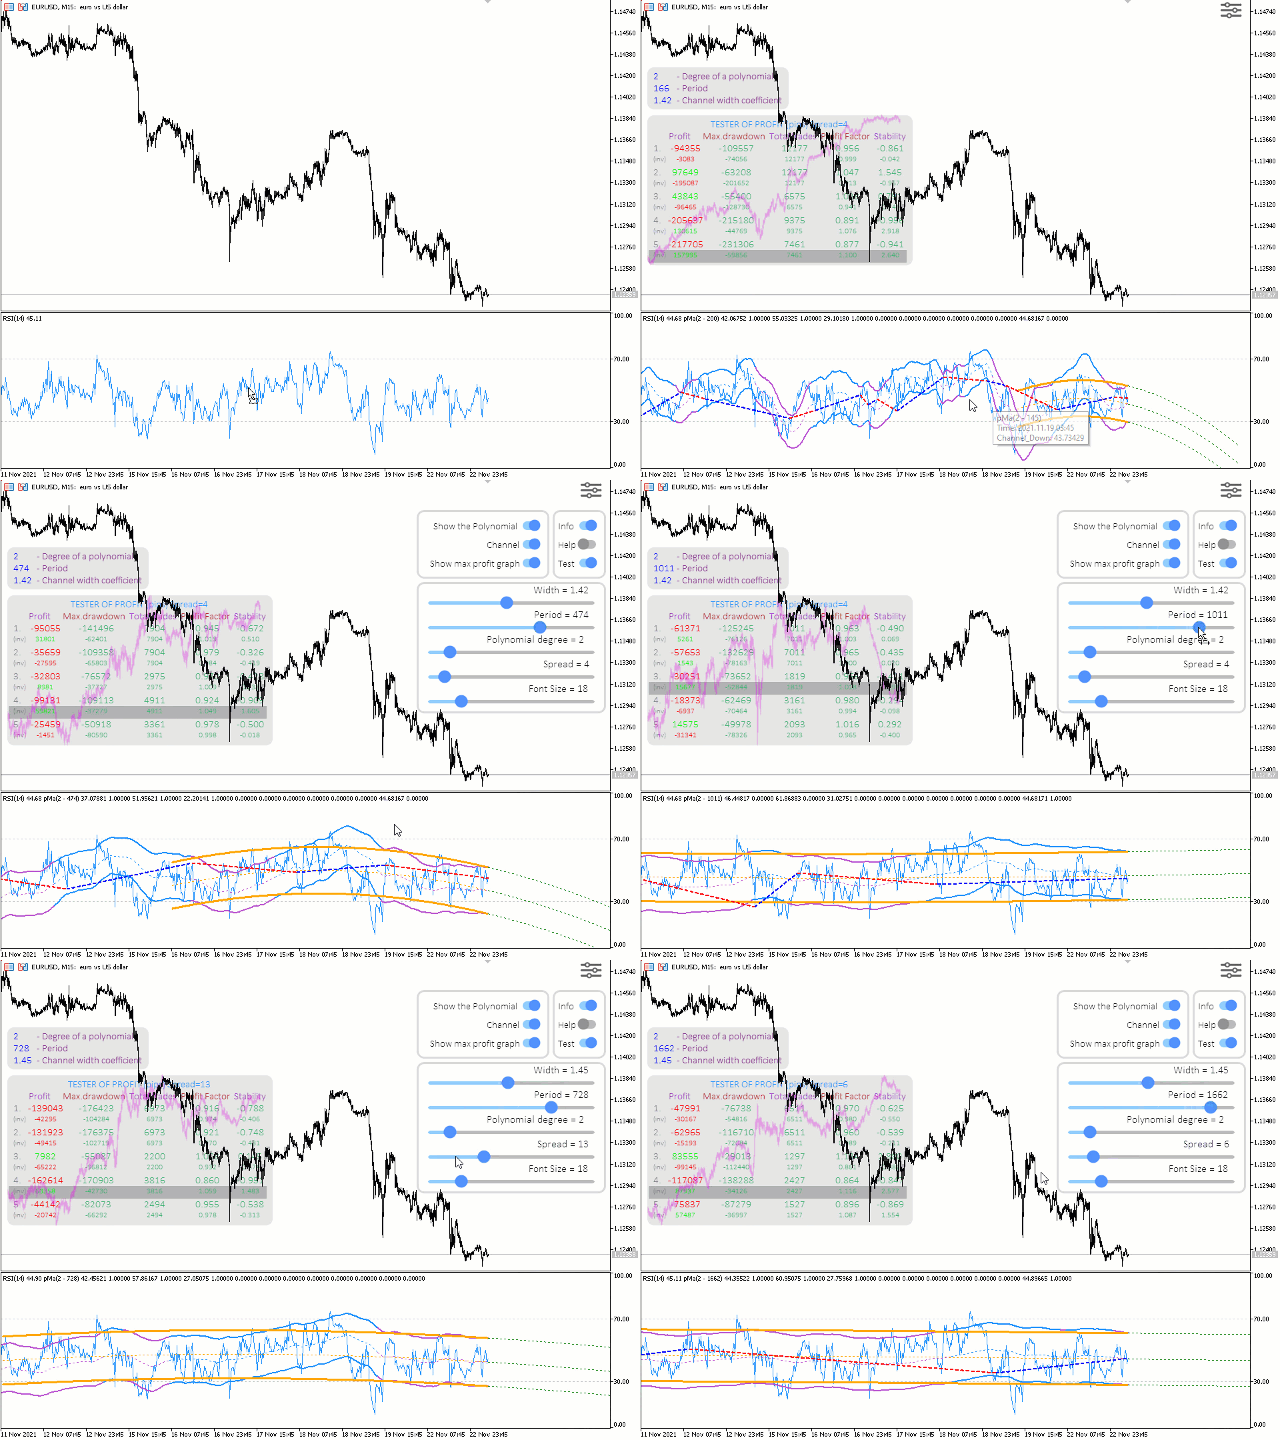
- You can further expand the capabilities of this Tester by applying this indicator to another indicator, for example, RSI.
- It is especially worth noting the possibility of changing the parameters in two ways:
- using the keyboard and mouse (control keys can be viewed by selecting "Help" in the menu)
- using sliders and switches in the control menu
- Language support has been implemented (so far 8 languages). The language is set automatically according to the selected language in the terminal, but you can also change the language with the "L" (Language) key.
- Text fields can be dragged with the mouse.
Indicator lines
- Yellow lines - Polynomial channel is redrawn with each tick. The green dashed lines are the extrapolation of the Polynomial to the future.
- Two-colour lines - non-redrawable channel, which is a trace from the Yellow Polynomial, Blue - when the lines of the Polynomial are directed up, Violet- when down.
- Red line - Sell, Blue line - Buy. Displayed when the Tester is on.
Parameters
- Degree of a polynomial - degree of the polynomial, from 0 to 20
- 0 - regular MA (Bollinger Bands channel)
- 1 - linear regression
- 2 - nonlinear regression without inflection points (parabola)
- 3 - nonlinear regression with one inflection point (wave)
- etcetera
- Number of bars for the calculation (period) - number of bars for calculation (period).
- Width of the channel, 0-no channel, 1-width = standard deviation - Channel width:
- 0 - do not draw the channel
- 1 - the width is equal to the standard deviation of the polynomial
- Bars to extrapolate in the future - how many bars to extrapolate into the future
- Show Polynom? - if true, then show the Polynomial line (yellow line)
- Spread for Tester - the size of the spread for the Tester
- Notify channel trend change - enable notifications (push notifications to the phone and a pop-up window) in case of a change in the trend of the Polynomial channel (orange color). This is equivalent to changing the color of a two-color line.
- Allow all notifications for tester mode - Enable/disable permission to use all downstream notifications
- Send Alert Notification - Enable text notification of a buy and sell signal according to the selected strategy from the strategy tester
- Send Sound Notification - Enable Sound notification of a new buy and sell signal according to the selected strategy from the strategy tester
- Send Push-Notification to Mobile - Send PUSH notifications to your phone (requires setting in your terminal Tools -> Options-> Notifications -> MetaQuotes ID) about buy and sell signals according to the selected strategy from the strategy tester
Notifications
You can configure notifications to be sent: text notification in a separate window, sound notification and push notifications to the phone.
These notifications are sent in case of a new buy or sell signal in accordance with the selected strategy in the tester. If the tester is disabled, then notifications will not be generated.
Signals are sent when the red and blue dotted lines change color.
Recommendations
The degree of the Polynomial is limited to 20. But this is very redundant.
In my opinion, it is quite enough to use this indicator with a Polynomial degree less than 10.
My recommendation for trading is to use the 2nd degree of the polynomial (parabolic channel), but for cryptocurrencies, the 3rd degree of the polynomial, in my opinion, is better due to the strong volatility.









Один из лучших индикаторов для скальпинга на БО!!!