Piranha version 2
- Indicateurs
- Maria Strudov
- Version: 2.1
- Mise à jour: 11 avril 2024
- Activations: 5
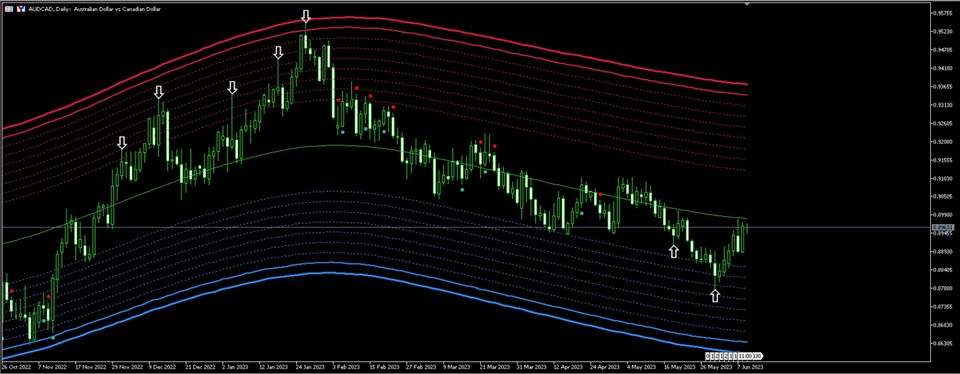
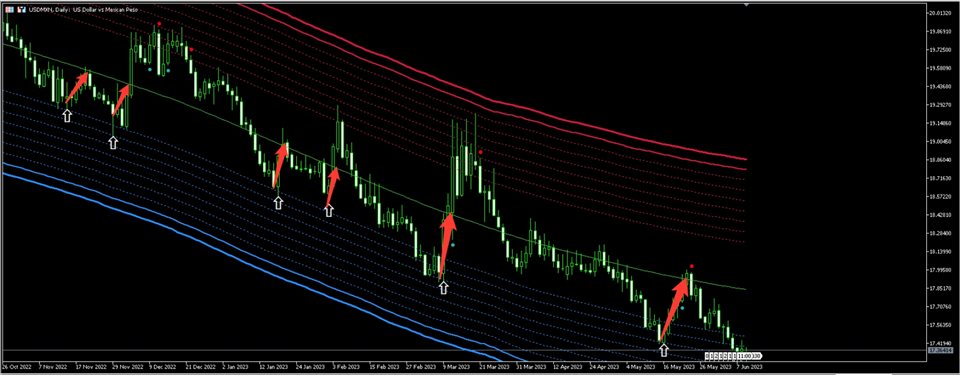
✅ "Piranha" - an autonomous trading system that determines overbought and oversold levels on the chart.
- Red and blue zones represent overbought and oversold levels respectively.
- Entry points are marked with arrows: a downward arrow in the red zone for "sell" and an upward arrow in the blue zone for "buy".
- The Take profit level is indicated by the green moving average.
Key features:
- Adjusting the Take profit level as the green moving average changes position.
- Averaging ability when a new market entry point appears.
- Strategy recommendations for the stock market in only BUY mode.
- Timeframe selection based on trading time allotment.
- The need for account load control: Piranha is a trading system, not a robot.


Цікава торгова система.