Regardez les tutoriels vidéo de Market sur YouTube
Comment acheter un robot de trading ou un indicateur
Exécutez votre EA sur
hébergement virtuel
hébergement virtuel
Test un indicateur/robot de trading avant d'acheter
Vous voulez gagner de l'argent sur Market ?
Comment présenter un produit pour qu'il se vende bien
Utilitaires de trading pour MetaTrader 5 - 20
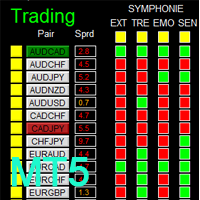
There is Demo version of this panel Dashboard Symphonie Trader System MT5 Demo in my product list, please try it out to get familiar with all functionalities for free. Free version: LINK MT4 version: LINK This system basically utilizes Symphonie Indicator Set (Extreme, Emotion, Trend, and Sentiment) as the core indicators to generate trading signal mainly on time-frame M15. The signal will be further filtered and trimmed by 1) M5 and M15 Stochastic; 2) EMA5 and PA To facilitate you to understan
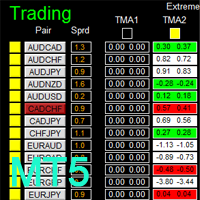
There is Demo version of this panel Dashboard Extreme TMA System MT5 Demo in my product list, please try it out to get familiar with all functionalities for free. Free version: LINK MT4 version: LINK This system basically utilizes 4 TMA (Triangular Moving Average) slope indicators on 4 time-frame and TMA Band as the core indicators to generate trading signal mainly on time-frame M15. The signal will be further filtered and trimmed by M15 Stochastic To facilitate you to understand and trade this
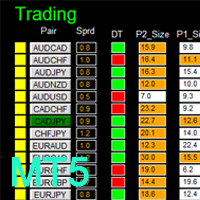
MT4 version: LINK DIBS = Daily Inside Bar Setup This system basically utilizes the popular candle pattern Inside Bar to generate trading signal mainly on time-frame H1. To facilitate you to understand and trade this system quickly and effectively, the collection of PDF manuals and tips are provided in my first comment of this product. For who cannot access Google Drive, please find these resources in the thread or PM me. Dashboard The DIBS Method MT5 is an intuitive and handy graphic tool to hel
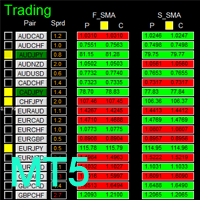
MT4 version: LINK This system basically utilizes two simple moving averages (10 SMA and 197 SMA) over 2 hours before Tokyo Open to generate trading signal mainly on timeframe H1. The signal will be further filtered by 1) M15 and M5 Fractals; 2) Stochastic To facilitate you to understand and trade this system quickly and effectively, the collection of PDF manuals and tips are provided in my first comment of this product. For who cannot access Google Drive, please find these resources in the threa
The new version of MirrorSoftware 2021 has been completely rewriten and optimized.
This version requires to be loaded only on a single chart because it can detect all actions on every symbol and not only the actions of symbol where it is loaded.
Even the graphics and the configuration mode have been completely redesigned. The MirrorSoftware is composed of two components (all components are required to work): MirrorController (free indicator): This component must be loaded into the MASTER

"Just copier" is designed to copy trading without any complicated settings. The copy can be done in one PC. One EA can be set as master (provider) or slave (receiver). The receiver lot can be set to multiple providers lots. Please also check this product at fxina.hostingerapp.com. Any type of copy is available. MT4 -> MT5 MT4 -> MT4 MT5 -> MT5 MT5 -> MT4 If you want to copy MT4 -> MT5 or MT5 -> MT4, please purchase "Just copier" for MT4 and "Just copier" for MT5 separately. Just Copier can copy
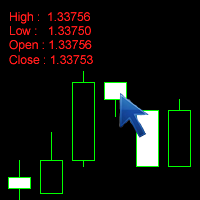
The Click Info is a simple utility for the MetaTrader 5 terminal that allows the trader to quickly receive information about the High, Low, Open, Close, Time values of the current chart. In order to receive information about a bar, it is necessary to left-click the selected candle. Depending on the settings, either a pop-up Alert or a Comment with the information appears. Information on the bar values (High, Low, Open, Close, Time) can be extremely useful in practice of trading using graphical a
Introduction to Order Risk Panel Pro EA Order Risk Panel Pro EA is the professional version of the simple Order Risk Management EA. Order Risk Panel Pro EA incorporate three powerful features in one. The three powerful features include the visual trading & Risk Management, the Harmonic Volatility Line indicator and Trade Statistics Panel. For all these three features, you get the price of one. Firstly, Order Risk Panel Pro provides the highly efficient visual trading feature. You do not have to
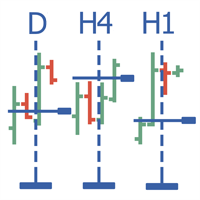
Multitimeframe navigation and research tool (XY expert advisor) is a convenient tool that allows analyzing the trading instruments on different time frames and fast switching between them. Easy to use. It has no adjustable parameters. Charts with an XY Expert Advisor can be either the same symbol (instrument) or different (from version 2.0). When a symbol is changed on one of the charts with the XY expert advisor , cascade change of symbols occurs on other charts with the XY attached. The X

The EA performs trade operations of closing position groups. Positions are grouped by type. It is possible to select orders by the profit (loss) value. It is possible to form the closure groups manually. You can set a value for automatic closure of a positions group after reaching a certain profit/loss level or price level. The additional functions of the EA are called using the hot keys: SHIFT+A - show/hide Auto exit options. SHIFT+S - show/hide Settings panel. SHIFT+V - sound ON/OFF. SHIFT+I -

The utility allows you to build different types of graphs: Seconds chart from 1 second to 86400 seconds Tick chart from 1 tick and above The volume chart Delta chart Renko chart Range chart Demo version of the utility https://www.mql5.com/ru/channels/clustersecond Built-in indicators for volumetric analysis: daily market profile and market profile of the selected timeframe, Cluster Search Imbalance VWAP Dynamic POC, VAH, VAL the profile depth of the market vertical volume with various display op

You can change all assets to your Market or Forex. Just replace the assets in the groups above! No asset limits! TradeLeader B3/Bovespa Scanner is an indicator that allows you to observe the entire market heat map in a single chart. More images in high definition in https://www.mql5.com/pt/users/ougaske/blog Track all the assets of the stock market separated by liquidity groups. Customize the alert level for opportunities. Display in real time the Ibovespa, minicontracts of Index and Dollar or
Object Synchronizer MT5 : Better focus/analysis of the price chart in many timeframes. Are you bored to save and load template many times for the same symbol for many chart timeframes? Here is the alternative. With this indicator, you enjoy creating objects across many charts, you can modify the same object in any chart, you can delete the same object in any chart. All objects you created/modified are always synchronized across all chart windows (with the same symbol). Save your time, you can fo
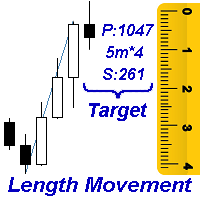
Measures the length of the selected movement in points, shows the duration of the movement, as well as the speed of movement. Outputs the average value of each dimension.
It is designed to calculate the expected target based on typical market movements.
The intended goal will provide information about the ratio of the stop size to the possible profit and will allow you not to open positions with a small expected profit.
It will also help you determine the point at which it is more logical to c

The VR Alert indicator utility is designed to monitor the price or other indicators and to inform the trader when the price or indicator reaches the given level. The signal levels can be set not only horizontally but also inclined. Thus, the trader gets the opportunity to receive notifications from the inclined trend levels. Thanks to the VR Alert utility, you will no longer need to sit near the monitor for a long time. You can calmly do about your household chores, perform your work duties and
The indicator allows you to quickly switch from one instrument to another, from one time period to another using the keyboard or buttons on the monitor. Each command can be assigned a hot key from 0-9, a-Z (case-insensitive) and VK_OEM_COMMA ("<" on the keyboard) and VK_OEM_PERIOD (">" on the keyboard). This can help you to operate the maximum number of instruments that are available at your broker, analyze more instruments/periods in less time. This product cannot be tested in the tester , beca
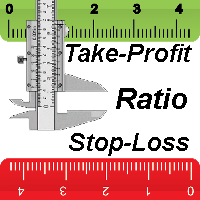
This indicator allows you to measure the profitability of each specific transaction (the ratio of Stop and Profit). The indicator allows you to adjust the ratio by step size and number of steps. You can build an unlimited number of ratios to compare the risks from different movements.
Note: the MT5 tester is not designed for full-fledged work with graphic objects, so drawing in the tester is slower than in the real situation. The ratio selection is performed with 1 mouse click.
Building a line

The script displays info about the share's corporate reports and dividends. The data is downloaded from investing.com : Report date Profit per share (EPS) Revenue Market capitalization Amount of dividends Date of payment of dividends Dividend income The product cannot be tested in the tester (since it is not possible to receive data from the Internet).
Before launching: Add 2 URL https://ru.investing.com/earnings-calendar/Service/getCalendarFilteredData and https://ru.investing.com/di
Advantage The analyzer provides an opportunity to examine correlation in history, for example, for the previous month excluding the current one, thus allowing you to evaluate symbol movement in history. It can be conveniently used in conjunction with the LineSyncMirrorCharts analyzer. Charts are synchronized by a market type: Forex, CFD, Futures, and Indices. The analyzer calculates the distance covered by the price on a specified period in points. The tool fits pairs and portfolio traders.
Des

Automatic calculation of lot size based on the StopLoss level: it calculates the lot with consideration of the risk percentage. Enter the deposit percentage and set the line to the planned StopLoss level. The lot size for the entry will be output as a result. The TakeProfit will also be calculated with taking into account the profit/loss ratio, and their profit/loss in the deposit currency. Thus, the end result of the trade can be seen immediately, which is an integral part of successful trading

Telegram Publisher Agent est un module complémentaire qui permet aux commerçants d'envoyer des signaux à leurs canaux et groupes Telegram en temps réel. Avec des messages personnalisables, des captures d'écran de graphiques et d'autres fonctionnalités, l'outil aide les traders à partager leurs idées et stratégies de trading avec leurs abonnés. L'outil présente également un beau design avec un commutateur de thème clair et sombre, offrant aux utilisateurs une expérience de trading esthétique et
Remarque : Cette EA ne fonctionne que sur les comptes sans risque. Version Métatrader 4 panneau rapide Ce panel est un groupe de six conseillers experts qui constituent un panel de négociation.
caractéristiques La plupart des tâches de trading peuvent être effectuées rapidement en cliquant sur les boutons de ces panneaux. Basculer entre les panneaux est aussi simple que de cliquer sur le bouton vert. EA peut être exécuté sur les graphiques visuels de Strategy Tester et fournit un moyen s
DYJ Follow Me is an EA that follows the virtual transaction record of any dyj indicator to actually open and close positions.
It can display the name and status of the indicator of the single signal source; At present, it is only the DYJ SignalSourceOfWPR MT5 indicator, and more indicators will be expanded in the future.
It can receive real-time trend direction of indicator.
It can receive the latest admission time of the indicator.
It can receive the latest admission price of the ind

Cryptocurrency analysis has never been easier with Crypto Charts for MetaTrader 5. Unlock the power of cryptocurrency trading with Crypto Charts for MetaTrader 5. Analyze data from Bitcoin to altcoins effortlessly, leveraging thousands of MQL5 indicators and Expert Advisors. Key Features: Real-Time Data : WebSocket support for Binance Spot and Futures for high-frequency trading Comprehensive Data : Access OHLC, Ticks, and Depth of Market. Seamless Integration : Operates as a background service,

This tool adds alerts to your Fibo Retracement and Fibo Expansion objects on the chart. It also features a handy menu to change Fibo settings easily and quickly! Please note the product is not working as a demo. Please watch the video.
Features Alert for Fibo Retracement and Fibo Expansion levels. Sound, Mobile and Email alert. Up to 15 Fibo Levels. Continuous sound alert every few seconds till a user clicks on the chart to turn it OFF. Single sound alert with pop-up window. Keeping all user se
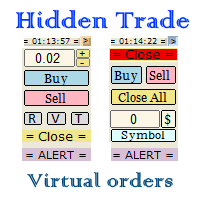
Small trading panel for managing orders and positions in 1 click for MetaTrader 5 The version for MetaTrader 4 is here , you can check it in the tester without restrictions Set hidden TakeProfit, StopLoss and pending orders at lines placed on the chart. Virtual breakeven. Virtual trailing stop. Close all positions. Close only Buy positions. Close only Sell positions. Work in the back testing mode (working in the tester is limited). Place up to 20 virtual orders. News trading and operation by tim

A ticker that shows the average bitcoin price of the selected currency and keeps updating it at regular intervals. PRO version updates more often and displays details about the price change! Make sure you have added the API address http://metakod.com/mk/api in the list of allowed URLs on tab Tools → Options → Expert Advisors. All of the supported currencies and the API address are listed in the screenshots below.
Inputs Logging level - Controls the amount of details written to the log (default:

What does it do? It assists you in your trading and has some important jobs to perform: It sets virtual pending orders, stop loss and take profit. It can set real stop loss and take profit if desired. It makes trading independent of bid-ask line concept, thus useful for very short term traders and price action traders. Orders can be opened, managed and closed with 1 click providing fastest management. It can automatically set your position sizing based on your risk inputs. Graphical panel enable

This indicator sends a message (notification), an email, and plays a custom sound when a Limit (Buy/Sell) or Limit Stop (Buy/Sell) or Take Profit, Stop Loss, Stop Out is executed. A user can change the sound file name, and select if they receive notifications/emails. It runs as an indicator, and only one indicator is locked (used) by a user account/login.
Parameters soundFile - sound file
Save your file at the terminal folder, for example: " C:\Program Files\MetaTrader 5\Sounds\Order Executed.

The indicator displays useful trading information on the chart for futures contracts such as: Average daily volatility with adjustable period of time. Optimal volume to trade depending on percentage of account balance you use. The percentage can be adjusted. Optimal stop loss depending on your maximum risk per trade considering percentage of account balance you use. Initial margin for the contract. Tick value for the contract. The indicator has an ability to display dynamic daily volatility leve

This script will show you information about the execution speed of market orders. Instruction 1. Press " File/Open Data Folder " 2. Open the " Logs " folder. 3. Copy the log-files to " MQL5\Files " 4. Run the CheckExec script on EURUSD chart, for example 5. Select parameters: AllOrders - check execution time of all market orders for EURUSD, OpenOrders - check execution time of market orders which where used to open positions on EURUSD, CloseOrders - check execution time of market orders which wh

This utility calculates and draws lines over the chart. There are two types of channels: Channel A: the mainline is drawn using local lows for uptrends and local highs for downtrends Channel B: the mainline is drawn using local highs for uptrends and local lows for downtrends The parallel lines of both types are built using the max. fractal between the base points of the mainline. There are a few conditions, which have to be fullfilled and can be changed by the parameters (see also picture 3):
t

Plot History Mt5, un script indispensable pour le trader qui analyse l'historique de trading de votre terminal de trading et de votre compte effectué par des conseillers experts. La méthode d'analyse est basée sur le diagramme de symboles sur lequel le script est exécuté ainsi que sur le nombre magique, une analyse spécifique ou complète de toutes les magies utilisées par un ou plusieurs experts. Le script analyse les données commerciales et peut les tracer sur le graphique, imprimer des inform

Fibonacci decorator is a unique product that decorates Fibonacci objects. This indicator can change the specific level line of a Fibonacci object. This tool caters to both beginners and advanced traders using Fibonacci objects.
Advantages Supports three Fibonacci objects: Fibonacci Retracement Fibonacci expansion Fibonacci time zones Just add the mark of your choice to the description of a Fibonacci object's level Easy setting This indicator does not work well with Strategy Tester. Please downl
Strategy Builder offers an incredible amount of functionality. It combines a trade panel with configurable automation (covert indicators into an EA), real-time statistics (profit & draw down) plus automatic optimization of SL, TP/exit, trading hours, indicator inputs. Multiple indicators can be combined into an single alert/trade signal and can include custom indicators, even if just have ex4 file or purchased from Market. The system is easily configured via a CONFIG button and associated pop-u

This tool allows you to better analyze your chart. With "Crosshair Percent", you can calculate distances in the chart in a percentage way (in a very simple way, when the pointer is attached in the form of a crosshair: CRTL + F). The utility allows to measure and/or calculate the movements of the price NOT only in points, use a measure in professional terms as it is the percentage. The result is shown in two parts of the screen, one of them, next to the position of the pointer and the other in a

This indicator draws strong price levels (price consolidation levels). The levels are plotted using 2 MA indicators and 1 MACD using a complex algorithm. The algorithm used in the EA is also in personal use.
These levels have 4 variants (colors of the variants can be customized): strong up, weak up, strong down, weak down. In turn, a weak level usually appears and then it can become strong. A strong level can also become weak. Version MT4: https://www.mql5.com/en/market/product/27997/ Version

The script creates a brief daily summary report of the weekly trade in a separate window.
Input parameters of the script number of weeks - set the time interval (the number of weeks) for the report. switch for symbols selection - three modes for selecting the instruments to generate the report: All_Symbols - report is generated for deals of all instruments. Current_Symbols_Only - report is generated only for deals of the instrument in the current window. Without_Current_Symbols - report is gene
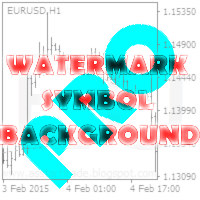
This utility displays the name of the current symbol and the current period in the chart background in a large font. It is very convenient, e.g. when you use multiple charts with different symbols, period or when saving a chart screenshot. The information is displayed in two lines. In the first line, the chart symbol and current timeframe are shown in a larger font (e.g. AUDUSD,h1 ). In the second line, the full name of the current symbol is displayed in a smaller font (e.g. for GPBJPY it shows
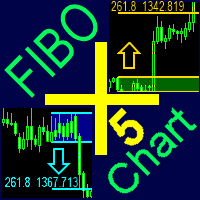
A ready-made trading system based on automatic plotting and tracking of Fibonacci levels for buying and selling any symbol on any timeframe.
Advantages Determines the trend direction (14 indicators) Displays the trend strength and the values of indicators comprising the trend direction Plotting horizontal levels, support and resistance lines, channels Selection of the Fibonacci levels calculation type (6 different methods) Alert system On-screen Email Push notifications
Buttons Changing the co
This expert advisor can enter and exit trades at specific times and on specific weekdays, expressed in GMT Time. It offers weekday selection, trade management settings, a martingale function and money management features. [ Installation Guide | Update Guide | Troubleshooting | FAQ | All Products ] Easy to use and supervise Fully configurable entry and exit times (up to 5 trades)
Enable or disable trading weekdays in inputs
Customizable break-even, stop-loss, take-profit and trailing-stop setting

MetaTrader 4 version is available here: MT4 Drawer . This tool allows you to draw on the chart using keyboard shortcuts. It also provides some custom drawing tools for your convenience. You can configure 3 variants for each tool (6 for advanced patterns), which you will be able to choose from dashboard. There is also, a possibility to define up to 30 quick access keys that skips the dashboard step and goes straight to drawing. Here are the list of supported tools: Advanced Pattern - draws two t

Copyist MS — это простой и удобный в использовании торговый копир. Работает как однофайловый советник с переключаемыми режимами работы Master и Slave. Ордера можно копировать из МТ5 в МТ5, из МТ5 в МТ4, из МТ4 в МТ5. Для копирования ордеров в MetaTrader 4 требуется версия советника для MetaTrader 4. Текущая версия советника работает только на ХЕДЖИНГОВЫХ счетах. Параметры Тип работы - выбор режима работы: Master или Slave; Копировать по магическому номеру - копирование торговых ордеров по магич

This tool will allow you to export the Historical data (Open, High, Low, Close, Volume) for any financial instrument present in your MetaTrader 5. You can download multiple Symbols and TimeFrames in the same csv file. Also, you can schedule the frequency of download (every 5 minutes, 60 minutes, etc.). No need to open a lot of charts in order to get the last data, the tool will download the data directly. The CSV File will be stored in the folder: \MQL5\Files .
How it works Select the Symbols t
Would you like to have statistics about your trades displayed while you operate? Have you a solid understanding of the symbol you are trading? Do you really know everything you need to about your trading account? Do you need to keep an eye on the local times around the world? Advanced Info Displayer answers to all that. It helps you to know many hidden or hard to find data. Also, it is very convenient if you value statistics and maths. Just to exemplify, in more than 80 lines of information you

This is a utility designed to automatically set the stop loss levels of orders according to the specified condition. Two price levels serve as the condition for setting stop loss: Trigger level - when this level is reached, an order is placed. The stop loss value of an order. It is possible to enable or disable traling stop loss.
Input parameters Order type for execution - type of orders to be processed by the expert. It can either be BUY, SELL or auto-select. Trigger Level Points - level to pl

Risk Manager Pro is a simple utility that calculates the necessary lots with the risk percentage and the pips of stop loss, before opening positions. The web calculators can be useful in some cases but they are not efficient to open operations in real time. In the trading days, there are few opportunities to open positions and when the opportunity arises, the seconds make the difference. This is not possible with conventional web calculators, since to calculate the size of an operation regarding

As the name suggests, the utility collects ticks and uploads them to a file. Each symbol receives its own folder. A directory in the symbol folder is created for each date so that you can find ticks of a necessary symbol and date quickly and easily. The collector is made as fast as possible within MQL. One collector is sufficient for each symbol. Timeframe does not matter. The utility features the function for displaying ticks collected in a file on a chart. You can also navigate ticks using a k

Multi Chart Refresh Mt5, est un script rapide et indispensable qui permet de rafraîchir plusieurs graphiques simultanément à partir d'un seul et même. Le multitâche rend cela possible car vous pouvez choisir à l'avance les symboles que vous souhaitez actualiser. Comment ça marche?
Ouvrez n'importe quel graphique, faites glisser le script depuis le navigateur et déposez-le sur le graphique. Définissez les symboles souhaités et cliquez sur OK, c'est fait ! Notez qu'il s'agit d'un script et non d

The Universal Signal Dashboard (USD) is a signal dashboard or indicator matrix. It can generate a matrix of signals from values, chart and candle prices, and from the buffer output of almost any technical indicator. However, unlike most dashboards of the same category, USD is configurable based on the inputs provided by the user within the app interface. The tabs (Display, Data, and Signals tabs) starts empty and the Display tab will show more display entries as the user adds more signal entries

Spread Costs refers to the amount of the loss caused by the spread, and Swap Benefits refers to the amount of the income gained by overnight positions. Spread Costs is an important indicator for short-term traders, especially for scalping traders, and Swap Benefits is an important indicator for long-term traders. Since the spreads and swaps on the MetaTrader 5 platform are all expressed in points, we need to convert it into the amount expressed in the account currency. This tool can display the
The " Delta Volume histogram " Expert Advisor plots histograms of "Delta volume", "Real volume", "Buy volume", "Sell volume", "Tick volume".
EA version: Has a built-in «Pending orders indicator". The indicator is designed for analysis of pending orders in the market, available in "MarketBook". Displays the Volume profile levels (VAH VAL from 60% to 85%). Built-in side histogram. This is a powerful tool for analyzing trade volumes. The chart is plotted based on tick data.
Depending on the broker,

The Quick trade report separately by symbols script will be useful for simultaneous trading on multiple instruments. It provides the ability to assess the effectiveness of trading on each symbol separately. It is possible to set a time period for making the reports. The report visualizes the changes in the balance for deals on each symbol. Also, the following key trading parameters are calculated for each instrument: Total net profit - the financial result of all trades. This parameter represent

Super ATR is a powerful tool for analyzing the ATR (Average True Range) levels. The intuitive interface allows you to easily monitor all the main ranges of volatility.
Key Features Plots the daily АТR areas on the chart. Plots the weekly АТR areas on the chart. Plots the monthly АТR areas on the chart. Displays a panel with the current values of the main volatility ranges (M5,H1,D1,W1,MN) on the chart. The areas and values in the table change their color when the ATR level is reached. Draws the
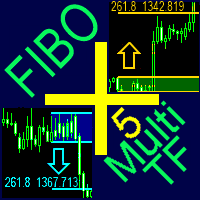
A ready-made multitimeframe trading system based on automatic plotting and tracking of Fibonacci levels for buying and selling any symbol.
Advantages Determines the trend direction based on a complex of 14 indicators ( Cx ), extremums of ZigZag ( Z ), RSI ( R ), Impulse ( I ) Displaying the values of 14 indicators comprising the trend direction ( Cx ) Plotting horizontal levels, support and resistance lines, channels View the plotting option of Fibonacci levels on any timeframe, with the abilit

This utility changes the behavior of auto-scroll. It removes the need to manually disable and re-enable the auto-scroll function.
Main features Disables auto-scroll - when the screen is scrolled backwards to look at the price history. Enables auto-scroll - when moved back to current history.
Inputs None.
Note I recommend testing when markets are open, since auto-scroll works when there are incoming ticks.

TCP - Trader Control Panel is an extension to build into MetaTrader 5 manual methods to control open positions. It adds opening and closing position feature as well as user-friendly monitoring dashboard, money and risk management when opening. Opening and closing positions are done by mouse by interactively placing stop loss line on appropriate level or by pressing predefined keys on keyboard. Before opening a new position, the EA calculates such lot size, which will guarantee you no more losses

This is a series of gauges that can be loaded on any Chart time frame. You can use this gauge indicators to decide when to enter and exit market with high degree of confident. Gauge No 1: Ichimoku Kinko Hyo Tenken Sen Crosses Kijun Sen. This will tell Bull and Bear and the timing to enter market. When the value move from above 0 towards below 0, the Tenken Sen line is moving to cross the Kijun Sen line and appears value is the Delta for the difference. Same goes to the opposite. The positive val
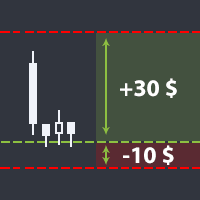
The utility helps open a deal with a stop loss that does not exceed the specified amount, or to refrain from it altogether. That is, it determines the number of lots to open the deal so that the stop loss is as close as possible to the specified amount in USD without exceeding it. For example, it will be indispensable when trading according to the Gerchik strategy. That is, when trading based on risks, with a fixed risk and a fixed take profit relative to stop loss. For example, if you always op

Pointer synchronization MT5 is an indicator with which the pointer can be synchronized in all the visible graphics of the terminal. It shows a cross cursor on all the visible graphics of the terminal, in position relative to the cursor of the active graph. To activate the indicator, simply press the button that appears in one of the corners of the chart once the indicator is added to the chart. To deactivate the indicator, simply press the button again. Once the indicator has been deactivated,
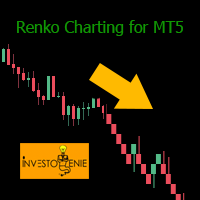
Renko indicator helps develop Renko charts on different symbols.
Advantages Drag and drop the indicator on M1 timeframe of the symbol chart Realtime updates Indicator can be used for Expert Advisors and technical analysis Backtest your strategy using Renko indicator
Parameters BOX SIZE: Input the number of box size. The box size reflects the difference of the symbol price. So, a 50 box size would reflect a 5 pip value difference in a currency pair symbol Show Wicks: If true , high or low of th
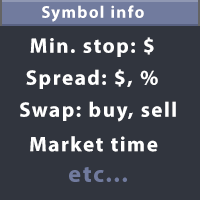
This utility displays the information required for making trades on each opened chart. For example: spread value, swap value; triple swap day; session closing time; ATR of the symbol by Gerchik; total profit/loss for the current symbol; the number of trades made earlier; the percentage change in the quotes of 6 selected instruments; and much more. The spread value is always shown. The rest of the information is displayed depending on the settings: Show total orders at the moment (long, short) .

Copier of deals from MetaTrader 5 to MetaTrader 5 ( MetaTrader 4<->MetaTrader 4 version is available ; with both versions, you can copy MetaTrader 5<->MetaTrader 4, MetaTrader 4<->MetaTrader 5, MetaTrader 5<->MetaTrader 5, MetaTrader 4<->MetaTrader 4). There is a demo version (restricting by grades and by lots) Works only in the mode of hedging Spread filter. Select the best price (start copying positions with a profit or loss). Configure the lot size, fixed or ratio-based (provider signals can
Check Online-Status monitors your terminal. If its connection to the server is interrupted for longer time, you will receive an email and/or a push notification, depending on what your settings. You can find out how long the terminal has been offline and can judge the quality of your brokers and/or the provider of your VPS after some time. Remember, the terminal manages and controls your money. Everything hangs in the air if it has no connection to the server! Check Online-Status displays the th
The utility is designed to display on the chart the margin zones built on the basis of margin requirements for futures of the Chicago Mercantile exchange (CME). These margin zones are good levels of resistance and support, as seen in the screenshots.
How to use To trade on margin zones, use the following rules: buy after the day has closed above one of the zones to the next zone; sell after the day has closed below one of the zones to the next zone; after opening a sell trade, place limit sell

This DYJ OonClickClose help you to close all orders having profit immediately with only ONE CLICK, its work is very fast. You can choose which symbol you want or close all symbols so it will helpful for you in your trading to manage trading faster. This EA can quick close all Buy and Sell Orders by a selected symbol or total, And delete all pending orders. It includes dynamic target profit tracking function. The software has manual transaction buttons buy and sell. It is a management softw
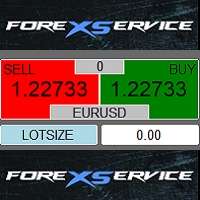
One Click Trader is a tool designed for MetaTrader 4 platform, which enables you to take your trading to the next level. It enables you to open, manage and close your trades in simple an efficient way by just one click of your mouse button. "-" , "+" change OCT window size Up arrow minimizes the OCT panel Down arrow maximizes the OCT panel Right arrow displays the next panel with additional features Left arrow hides the panel with additional features Red SELL button enables you to open s

This QuickClose help you to close all orders having profit immediately with only ONE CLICK, its work is very fast. You can choose which symbol you want or close all symbols so it will helpful for you in your trading to manage trading faster. This EA can quick close all Buy and Sell Orders by a selected symbol or total, And delete all pending orders. This SymbolButton is designed for closing orders. There is available Manual and Automatic closing functions. Automatic closing function will close t

Telegram Notify MT5
Telegram Notify MT5 is an utility tool to bridge your MetaTrader 5 activities to your Telegram chat/channel. It is useful for monitoring your MetaTrader 5 account by sending a notification to your particular Telegram chat/channel when someone/EA is placing trades, modifying order's TP/SL, closing trades and etc. This EA does not place any trade for your account. This EA also could be a convenient tool for monitoring other's EA trading activities or a tool for publishing your

Exit based Indicator - What is it? Exit your open positions based on up to 10 indicators. Even those you buy in Market !!! Use any indicator that provides buffer values (most of them output buffers). You can use any available buffers and even compare various indicator values. Selectors for exiting Buy Positions and Sell Positions are separate. The EA works in AND or OR mode. You can combine multiple instances to create elaborate rules. NO BROKER SIDE STOP LOSS IS USED.
Usage Ideas / Examples -
MetaTrader Market - les robots de trading et les indicateurs techniques pour les traders sont disponibles directement dans votre terminal de trading.
Le système de paiement MQL5.community est disponible pour tous les utilisateurs enregistrés du site MQL5.com pour les transactions sur les Services MetaTrader. Vous pouvez déposer et retirer de l'argent en utilisant WebMoney, PayPal ou une carte bancaire.
Vous manquez des opportunités de trading :
- Applications de trading gratuites
- Plus de 8 000 signaux à copier
- Actualités économiques pour explorer les marchés financiers
Inscription
Se connecter
Si vous n'avez pas de compte, veuillez vous inscrire
Autorisez l'utilisation de cookies pour vous connecter au site Web MQL5.com.
Veuillez activer les paramètres nécessaires dans votre navigateur, sinon vous ne pourrez pas vous connecter.