Regardez les tutoriels vidéo de Market sur YouTube
Comment acheter un robot de trading ou un indicateur
Exécutez votre EA sur
hébergement virtuel
hébergement virtuel
Test un indicateur/robot de trading avant d'acheter
Vous voulez gagner de l'argent sur Market ?
Comment présenter un produit pour qu'il se vende bien
Expert Advisors et indicateurs payants pour MetaTrader 5 - 63

Alpha BOT is a professional automatic trading system designed and optimized for the MT5 platform and multi currency pair. The principle of operation is based on support and resistance, uses pullback of currency pairs and deep machine learning, the EA independently adjusts to market volatility. Tested in sample and in out of sample with positive results since 2010y.
Currency pair: AUDCAD,NZDCAD,AUDNZD.
Requirements: Leverage 1:30 or higher
Minimum deposit 500 USD, recomended 1000 USD (

The robot operates within pre-configured channels at the beginning of the operation.
Use a Demo account or the Strategy Tester to find the best setup for the asset you want to trade.
If you have any doubts about handling the robot, send a comment in the "Comments" tab and we will respond and insert you in our private group.
Follow the steps below to configure it.
After dragging the robot onto the chart, go to "input parameters and configure the following data:
Enter th
Risk Controller Expert Advisor, un programme qui vous permet de contrôler le risque total de vos conseillers en trading sur votre compte. Avec ce programme, vous pouvez contrôler le risque maximum qui sera autorisé sur le compte pour tous les conseillers. Par exemple, vous définissez le risque de 30% du drawdown maximum, ce qui signifie que si vos robots de trading actions dépassent le risque de 30%, le Risk Controller fermera toutes les positions des conseillers, et pourra également fermer tou

HEIKEN PLUS is the only indicator you really need to be a successful trader , without in depth knowledge of the forex trading or any tools.
Also there is automatically trading EA available now: https://www.mql5.com/en/market/product/89517? with superb SL/TP management! and sky high profit targets !!!
Very suitable tool for new traders or advanced traders too. This is MT5 version. For MT4 version visit : https://www.mql5.com/en/market/product/85235?source=Site
HEIKEN+ is a combination o

Panneau de mise à jour de l'historique des contrats à terme de Kraken Crypto Exchange
Traits :
1. Il créera un symbole basé sur la configuration et mettra entièrement à jour l'historique qui est disponible à partir de l'API Kraken pour le symbole. Ce panneau met à jour l'historique des symboles Kraken Futures avec les données Open High Low Close. Il imprime également un message lorsque la mise à jour de l'historique est terminée. Veuillez noter qu'il ne s'agit pas de données en direct.

Indicator developed by the Brazilian and analyst Odir Aguiar (Didi), consists of "Moving Averages", famously known as "Didi needles", where it allows the viewing of reversal points.
The concept is very simple, when you enter 3 Moving Averages on display, a period equal to 3, one equal to 8 and the other equal to 20, then the formation of the indicator that works in axis or line center equal to 0 (zero) appears. ). Moving averages must intersect when approaching line 0.
The scanner monitor
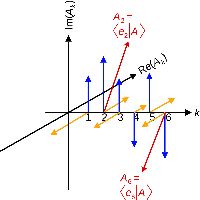
ComplexVectorHL is an indicator that characterizes the change in short-term market trends. The indicator is based on market analysis using the mathematical apparatus of complex numbers. The essence of the indicator is that it, with clear impulses, indicates the points in time when it is necessary to make decisions. The impulses are like a cardiogram showing the heartbeat of the market. The indicator has pulses only in one direction (unlike the previous development of ComplexVector), the pulses
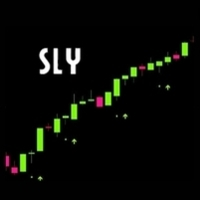
indicador para opciones binarias que siempre funciona en favor de la tendencia principal , por favor identifiquela en temporalidades altas para poder tomar operaciones en las temporalidades bajas , puede usar una media movil de cualquier periodo para identificarla , recomendada la de 50 periodos exponencial ideal para operar el mercado de indices sinteticos del broker deriv y/o divisas, se puede acompañar de cualquier oscilador usando unicamente el nivel 50 para validar tendencia alcista o baji
This is a break even/break even plus EA. It moves your stop loss to break even(BE) or BE+ based on pre-set number of pips in profit. You can edit this in the input section. This EA sets breakeven for both manually and auto-opened trades. Moving stop-loss to a breakeven is popular among traders who wish to safeguard their trades and to let the trades run without incurring a risk of loss. With this EA , you can have your stop-loss orders moved to a breakeven point automatically when a po

Do you like to trade on EURUSD and GBPUSD? This expert may be for you. Trading starts with pending orders: buylimit and selllimit. The second order is at the market price - the so-called probing order (reduces risk). Then the EA adjusts subsequent orders according to the market situation. Both the first and subsequent orders are closed based on a trailing stop. The expert selects the volume himself, as well as how many positions will be closed. input start_enum inp_start= 2 ; //S
Cet indicateur est basé sur des formes en ogive. De telles formes sont utilisées dans l'aérodynamique et la technologie spatiale. Même les balles ont une sorte de forme ogivale. L'utilisation de telles formes dans un indicateur technique permet d'atteindre un compromis entre la sensibilité de l'indicateur et sa stabilité. Cela donne des possibilités supplémentaires lors de son application. Paramètres de l'indicateur : iType - le type de la forme ogive. iPeriod - période de l'indicateur. iFa

Back to the Future это индикатор который определяет направление тренда. Определяет четыре уровня для роста и падения 1-й уровень флета 2 -й уровень коррекции 3-й уровень продолжения тренда и 4-й уровень возможного разворота. Индикатор рисует трендовые линии краткострочного и долгострочного тренда. Так же индикатор определяет динамические сел и бай зоны в виде прямоугольников. От ближайшего максимума или минимума рисует фибо уровни для определения целей движения. В меню индикатора отключа

It's a modified, and improved version of the classic HMA developed initially by Alan Hull in 2005. It uses a combination of three weighted moving averages to reduce the lag. Long Entry: When HMA turns blue from red with an upward slope. Short Entry: When HMA turns red from blue with a downward slope.
Features It comes with a multi-timeframe scanner which scans for the new signals across all the timeframes. HMA reduces lags which usually come with the traditional moving averages. Effectively
SSL stands for Semaphore Signal Level channel. It consists of two moving averages applied to high and low, respectively, to form a price following envelope. Buy Signal: When the price closes above the higher moving average. Sell Signal: When the price closes below the lower moving average.
Features It comes with a multi-timeframe scanner that scans for the new signals across all the timeframes. A straightforward personal implementation of the classic SSL effortlessly finds the trend directio

MT4 : https://www.mql5.com/en/market/product/83443 Plage de temps: M1 Paires de devises : EURUSD, GBPUSD, USDCHF, EURGBP, USDCAD, AUDCAD. Paires de devises à haut risque : CHFJPY, EURCHF, USDJPY, AUDCHF. Recommandations : Avant d'utiliser l'Expert, assurez-vous de contacter l'auteur pour obtenir de l'aide sur l'installation et les recommandations du courtier. Assurez-vous d'utiliser un VPS ou un serveur avec une latence réseau minimale pour le serveur du courtier. Utilisez un co
The indicator measures the buying and selling force between the buyers and sellers in the form of a histogram/oscillator by using a BOP equation:
BOP = Moving Average of [close – open)/(high – low)]
Igor Levshin first introduced the Balance of power in the August 2001 issue of Technical Analysis of Stocks & Commodities magazine.
Features
Quickly find the buying and selling pressure among the traders. It comes with simple inputs and an interface. All Metatrader alerts included.
Appli

This indicator shows the bullish/bearish market regime using the no. of bars moved above and below the overbought/oversold region of RSI. The green histogram depicts the Bull power, while the red depicts the Bear power.
Features
It can be used to enter new trades or validates trades from other strategies or indicators. It comes with a multi-timeframe scanner that scans the bulls/bears power across all the time frames. It's a perfect choice to boost the confidence of new traders via validatin
It is a script that allows you to open all market watch symbols at one go having the current time frame of the opened chart. I have been looking for a script like this for a very long time when I first started trading. Finally figured out how to do it, so no more problem for those who are suffering like me. This is a blessing for me now hopefully for you too. Buy the script, if it does not work as shown full refund. DM me for any problems, this script is only for MT5 . instruction Are : 1 - Keep
The indicator plots the Up and Down arrows on every price swing made by the classic Zigzag indicator. When Zigzag makes a new swing low, a green arrow is plotted. Likewise, a red arrow is plotted when Zigzag makes a new swing high.
Features
Compared to the classic ZigZag, it marks the swing points more effectively. It helps to identify the forming chart patterns in advance. It comes with a Multi-Timeframe scanner which shows the Zigzag direction on each timeframe. All Metatrader alerts includ

Nous sommes heureux de vous présenter l'indicateur d'information "Info Trader".
Comme nous sommes nous-mêmes des commerçants, nous créons des logiciels que nous utilisons principalement dans nos propres pratiques commerciales. Pendant le trading multidevises intrajournalier, nous avions constamment besoin d'un panneau d'information "prêt à l'emploi".
Vous avez probablement remarqué qu'il est nécessaire de prendre une décision sur la prise de bénéfices sur le compte en tenant compte des béné

Volality 75 Fractal Scalper Non-repaint The arrows appear on the current candle. momentum and trend based strategy Works on all timeframes from the 1 Minute to the Monthly timeframe Bollinger bands have been added to show the trend direction whether its bullish or bearish Blue fractal arrow is your buy entry Orange fractal arrow is your sell entry you can use the Vix 75 fractal scalper in combination with other indicators.

Plage de temps: M1 Paires de devises : XAU/USD Gold Booster MT5 est un développement innovant du trading de l'or contre le dollar. La stratégie utilise des niveaux de support/résistance. Chaque transaction est protégée par un stop loss et dispose d'un algorithme de suivi adaptatif. Cet Expert Advisor est basé sur la percée des niveaux de support et de résistance les plus importants, qu'il détermine, après avoir placé les commandes en attente derrière eux, à l'aide d'un algorithme ad

*OPTIMIZE BEFORE TEST AND USE* Sentient is the next evolution of of scalping and has all the angles covered. I tested it on XAU/USD. Optimize on the time frame assets you choose. I like XAU/USD.
Sentient has more points and indicators to it to create a cluster signal and there are many inputs to optimize. You can use the basic ones for the threshold or all of them.
Note: There are many steps and points. Optimizing longer than 1 month, would require much time and power. Forward opti
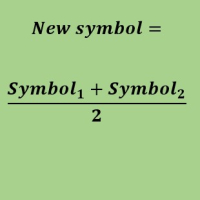
Create a new custom symbol based on average of Multiple arbitrary symbols (for MT5)
An Expert Advisor (EA) used to create custom symbol by averaging multiple input symbols (e.g. EURUSD and GBPUSD) and provide real-time updates. This is an MT4 "offline" chart equivalent which is very simple to use.
You can attach any MT5 compatible indicator or template to this new symbol and perform your technical analysis. You can back-test any EA on this new custom symbol in strategy tester. for example

Supported currency pairs: EURUSD,USDCAD, GBPUSD, EURGBP
Setting Lot -frist trading lot TakeProfit, in pips - t ake profit value Step between positions: Step between positions(Distance) Volume increase factor Max lot Author
I have an experience of more than 8 years in forex and gold trading, I started my career as a trader and now developing Expert Advisors to make trading process and trading fully automated I believe "if you can't make money while you sleep, you have to work fo

you don't have to monitor your trades all the time. save yourself screen time and leave management of your trades to Dynamic Trades Manager. Dynamic Trades Manager is a trading assistant tool. it has automated capabilities to break even, take partial profits, trails stops and to set your risk to reward ratio . it does not take trades on its own but only performs the aforementioned functions when the user has already conducted their analysis and opened a trade. this would save you the time of ha
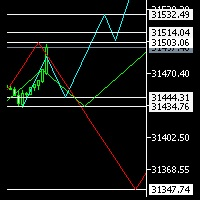
Hello Everyone ,
I am not an Elliot pro , but I promise to let you see it in a different way , have you ever considered to see 3 probabilities of different time frames on same chart ? this will not only enhance your trades entry , but will give you confidence and certainty when everything is not clear.
in my indicator you will be able to select 3 time frames of your choice , define number of candles per each time frame , give the color per each trend (Bearish or Bullish), not only that , yo

The Outside The Box (OTB) is a complete trading system that provides the user with immense trading ability by highlighting on the chart areas where the trader should prepare to Re-enter the trend after pullbacks (Pullback trading strategy) Take partial/complete profit(Profit taking strategy), and Trade breakouts (Stock breakout strategy) - We have updated the indicator to show/hide Micro breakout areas around the major breakouts (Micro Breakouts). The above is supported by an alert system to no
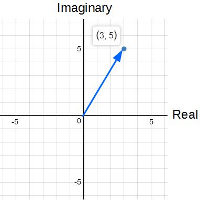
ComplexVector is an indicator based on market analysis using the mathematical apparatus of complex numbers. The essence of the indicator is that it, with clear impulses, indicates the points in time when it is necessary to make decisions. The impulses are like a cardiogram showing the heartbeat of the market.
For example: it may be the moment of planning a new entry. this may be the moment to exit the position. if you work with a series that is in a drawdown, you are recommended to close it i

Golden God utilise l'apprentissage automatique. Négociez sur la période XAUUSD 1 HR ou sur d'autres périodes de temps en négociant l'OHLC comme logique. Définissez le risque d'équilibre dans les entrées, 5 % par défaut. Contrôlez les lots maximum à prendre. Toutes les transactions ont des arrêts et prennent des bénéfices. Cet EA négocie activement. Négociez sur une démo et en direct car cela n'est pas basé sur des indicateurs. Essayez-le en temps réel, ce n'est pas comme beaucoup d'EA qui utilis

The ADX indicator (average directional index) is a technical tool designed to measure the strength of a market trend. The ADX indicator is used for various purposes such as measuring the strength of a trend, finding a trend and a trading range, and as a filter for various Forex trading strategies.
Some of the best trading strategies are based on following the market trend. There are also strategies through which traders make profit by trading against the trend. In any case, if you can identif

The purpose of the inidcator is to identify the reversal point.
The blue arrow is buy signal and the yellow star is its stop loss. The red arrow is sell signal and the yellow star is its stop loss. Please note that the singal is against trend,it could be continual fail. Alert feature: if there is a signal, the indicator will send alerts of popup window,email or mobile push. Inputs: Popup Window Alert: it is false in default Email Alert : it is false in default Mobile Push Alert: it is false in

What is this indicator? This indicator plots a customized text object as a note at any point on the chart. To plot the text object, press the hotkey and then click at any point on the chart. You can also add your favorite words and sentences to the template and plot them.
How to stick a note 1. Press the hotkey to enter sticky mode. 2. Click any point to stick. 3. Edit the text of the text object plotted as a note.
About sticky mode
This mode is for plotting a text object as a note. If

What is this indicator? This indicator stamps any customized number at any point on the chart. To stamp any number, press the hotkey (0–9) and then click at any point on the chart. You can also stamp a series of numbers to indicate a chart pattern. (Each number synchronizes modification)
How to stamp any number
1. Press the hotkey (0–9) to enter stamping mode. 2. Click any point to stamp.
How to stamp a double top/bottom pattern 1. Press the hotkey to enter stamping mode. 2. Click any p

What is this indicator? This indicator draws a customized Fibonacci retracement or expansion at any position on the chart. To draw the object, press the hotkey and then click at any point on the chart. Each anchor point magnets to the high or low price of the nearest bar on the chart.
How to draw
1. Press the hotkey to enter drawing mode. 2. Click any point to draw. 3. Drag and drop each anchor point to adjust if needed.
About drawing mode
This mode is for drawing a Fibonacci retracem

What is this indicator? This indicator draws a customized vertical, horizontal, or trend line at any position on the chart. To draw each line, press the hotkey and then click at any point on the chart. Each drawn line is synchronized with other charts by timeframe. (Each chart requires this indicator to be installed)
How to draw a vertical or horizontal line 1. Press the hotkey to enter drawing mode. 2. Move the mouse to any point. 3. Click to draw the line.
How to draw a trendline 1. Pr
What is this indicator?
This indicator controls the visibility of graphic objects on the chart when the hotkey is pressed. If you switch on, the graphic objects will be hidden. If you switch off, the graphic objects will be shown. You can specify the object to control with object type.
List of supported object types - Vertical Line - Horizontal Line - Trendline - Trendl By Angle - Cycle Lines - Arrowed Line - Equidistant Channel - Standard Deviation Channel - Linear Regression Channel - An
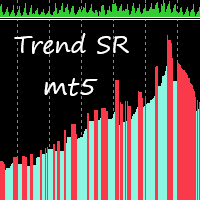
This indicator takes input from Support and Resistance levels, combined with a special trend filter. Easily spot tops and bottoms, and trade with more confidence. Great for scalping. This indicator can be used on all time frames and pairs. Features alert function.
No need to set up the indicator.
How to use: Simply attach to any chart. Zoom chart out completely. Red histogram line color = Selling opportunities. Blue histogram line color = Buying opportunities. See pictures below. To spot high

This Expert trades macd crosses , using ADX and AC. Designed for 4hr EURUSD trading but able to trade major pairs. Code is designed for speedy metatrader optimisation using open price testing as ea uses open prices on indicators used. EA identifies trends with specific momentum and exits using the ADX or stop loss. Please optimise using out of sample data. preset at 0.1 lots best to start with 0.01 lots.
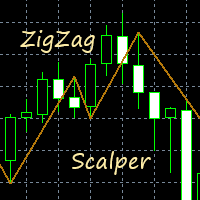
This indicator gives you a modified ZigZag, combined with a trend filter. Great for scalping. Perfect for channel trading. Features alert functions. No need to set up the indicator. How to use: Simply attach to any chart. Buy when the golden line stops below the price. Sell when the golden line stops above the price. It also helps to keep the audible alert set to true. Best results when checking two or more timeframes before entering trades on the lower time frames. Use as you see fit for your

Cet indicateur utilise les nombres dits "mauvais" comme coefficients de pondération. Leur contraire est les nombres "odieux", qui sont également présentés dans cet indicateur. La division des nombres en ces deux classes est associée au poids de Hamming, qui est déterminé par le nombre d'unités dans la notation binaire d'un nombre particulier. L'utilisation de ces chiffres comme facteurs de pondération donne un indicateur de suivi de tendance. De plus, les nombres odieux donnent un indicateur pl

EA Goldlytic use a trend built-in indicator. It's specifically designed for trading the XAUUSD (GOLD) but can be used with other assets (forex, crypto...).
The Expert Advisor opens an order based on a signal from the indicators and fixes the profit at a certain level with the ability to open order basket For best results, it is recommended to cancel the direction of trade on the EA panel on the chart Since this is a trend-following Expert Advisor, we recommend disabling the Expert Advisor in

Optimize before back test or use.
New Wave trades trends. 3 moving averages and trends up and trends down, buying and selling. Finding the optimal parameters for yourself, you will need to optimize in the platform. A set file is in the comments to use in the test to show the Expert. Optimize inputs according to your asset and risk. I optimized this with EURUSD on a 1 hour time frame. Percentage of balance is used to trade by.

Supported currency pairs: EURUSD,USDCAD, GBPUSD, EURGBP Recommended timeframe: M15
The EA should run on a VPS continuously Setting Fixed Lot - fixed frist trading lot StopLoss, in pips - stop loss value TakeProfit, in pips - t ake profit value RSI : averaging period, Averaging period for calculation
RSI : type of price RSI :RSI value calculation
Use martingale, martingale Mode Martingale coefficient, martingale multiplier Order Maximum number of multiplications
Este EA foi desenvolvido para o mercado financeiro Brasileiro, porem, com os Parâmetros corretos pode ser aplicado a todos ativos disponíveis na metatrader inclusive forex e metais. Não julgue o resultado com os parâmetros padrão, entenda que os parametros são para validação de diversos ativos, por isso cada ativo tem um valor que se enquadra na realidade do contexto do mercado. Qualquer duvida, pode me chamar no Telegram @andrefonsecaloureiro ou no email vendas.mercadocapital@gmail.com

L'indicateur de force et de faiblesse pour le volume réel MT5 fait partie de l'ensemble d'outils (Wyckoff Academy Price and Volume) L'indicateur de force et de faiblesse pour le volume réel MT5 a été développé pour identifier la force et la faiblesse du volume de manière cumulée. Permettre la vision d'un panorama entre prix et volume. L'indicateur peut être utilisé comme oscillateur et comme histogramme. En tant que fantasme, il a toutes les prémisses des trois lois de R. Wyckoff lorsqu'elles so

L'indicateur de force et de faiblesse pour MT5 Forex fait partie de la boîte à outils (Wyckoff Academy Price and Volume) L'indicateur de force et de faiblesse pour MT5 Forex a été développé pour identifier la force et la faiblesse du volume de manière cumulée. Permettre la vision d'un panorama entre prix et volume. L'indicateur peut être utilisé comme oscillateur et comme histogramme. Comme d'habitude, il contient toutes les prémisses des trois lois de R. Wyckoff lorsqu'elles sont associées au p

VSA Candle Signal pour MT5 fait partie de l'ensemble d'outils (Wyckoff Academy Price and Volume). Sa fonction est d'identifier la corrélation du prix et du volume dans la formation de la bougie. Sa création s'appuie sur les prémisses de R.Wyckoff , précurseur dans l'analyse des Prix et des Volumes. VSA Candle Signal pour MT5 aide à la prise de décision, laissant votre lecture plus claire et plus fluide. Voir les images ci-dessous.

L'indicateur latéral Weis Wave Bouble pour MT5 fait partie de la boîte à outils (Wyckoff Academy Wave Market) L'indicateur latéral Weis Wave Bouble pour MT5 a été créé sur la base de la Weis Wave déjà établie créée par David Weis. L'indicateur Weis Wave Double Side lit le marché par vagues comme R. Wyckoff l'a fait en 1900. Il aide à identifier l'effort x le résultat, la cause et l'effet, et l'offre et la demande Son différentiel est qu'il peut être utilisé en dessous de l'axe zéro et dispose d'

L'indicateur latéral Weis Wave Bouble pour MT5 fait partie de la boîte à outils (Wyckoff Academy Wave Market) L'indicateur latéral Weis Wave Bouble pour MT5 a été créé sur la base de la Weis Wave déjà établie créée par David Weis. L'indicateur Weis Wave Double Side lit le marché par vagues comme cela a été fait par R. Wyckoff en 1900. Il aide à identifier l'effort x le résultat, la cause et l'effet, et l'offre et la demande Son différentiel est qu'il peut être utilisé en dessous de l'axe zéro, a
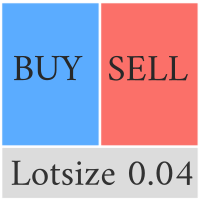
This Pro version of the LotSizePanel let's you set the stoploss with a line. Instantly the ea will calculate the lotsize based on where you drag the line on the chart. Press the "Show Line" button again, and the line dissappears and the ea reverts back to calculating the lot size from an ATR based stoploss again.
I can't see how I would ever trade manually without this panel again.
Remember that autotrading needs to be turned on to place orders with the buttons.

L'indicateur de prix et de volume WAPV pour MT5 fait partie de l'ensemble d'outils (Wyckoff Academy Wave Market) et (Wyckoff Academy Price and Volume). L'indicateur de prix et de volume WAPV pour MT5 a été créé pour faciliter la visualisation intuitive du mouvement du volume sur le graphique. Avec lui, vous pouvez observer les moments de pic de volume et les moments où le marché n'a aucun intérêt professionnel Identifiez les moments où le marché évolue par inertie et non par mouvement de "smart

User Grid MT5 is a multifunctional grid Expert Advisor designed to fully or partially automate various ideas related to grid trading (on a hedging account) . The Expert Advisor can trade on any timeframe, on any currency pair, on several currency pairs, on any number of signs. It does not interfere with manual trading, trading of other Expert Advisors, or the operation of any indicators. It allows you to adjust your settings on the fly, works only with your own positions and orders. It has a

WA_PV_BOX_EFFORT X RÉSULTAT pour MT5 L'indicateur WAPV Box Effort x Result fait partie du groupe Package Indicators (Wyckoff Academy Wave Market). L'indicateur WAPV Box Effort x Result pour MT5 vous aide à lire le prix et le volume. Sa lecture consiste à aider à l'identification effort x résultat dans les vagues créées par le graphique. L'indicateur WAPV Box Effort x Result pour MT5 lorsque la case est verte signifie que le volume est en faveur de la demande et lorsque la case est rouge le volum

L'indicateur WAPV ADH Supply and Demand Forex fait partie d'un ensemble d'indicateurs appelé (Wyckoff Academy Wave Market) L'indicateur d'offre et de demande Forex WAPV ADH pour MT5 est destiné à identifier le côté gagnant entre les acheteurs et les vendeurs. Sa lecture est très simple, lorsque la ligne verte est au-dessus de la ligne rouge la demande est commandée, lorsque la ligne rouge est au-dessus la ligne verte l'alimentation est commandée. Plus les lignes vertes et rouges sont positives,

Supported currency pairs: EURUSD,USDCAD, GBPUSD, EURGBP Recommended timeframe: M15
The EA should run on a VPS continuously Setting Fixed Lot - fixed frist trading lot StopLoss, in pips - stop loss value TakeProfit, in pips - t ake profit value CCI: averaging period, Averaging period for calculation
CCI: type of price, Use martingale, martingale Mode Martingale coefficient, martingale multiplier Order Maximum number of multiplications

L'indicateur WAPV ADH Supply and Demand fait partie d'un ensemble d'indicateurs appelé (Wyckoff Academy Wave Market) L' indicateur d'offre et de demande WAPV ADH pour MT5 est destiné à identifier le côté gagnant entre les acheteurs et les vendeurs. Sa lecture est très simple, lorsque la ligne verte est au-dessus de la ligne rouge la demande est commandée, lorsque la ligne rouge est au-dessus la ligne verte l'alimentation est commandée. Plus les lignes vertes et rouges sont positives, plus le vol

The Price Elevator indicator is developed to help you figure out the general long-term trend of the market. If the price is above the Green separator line, this is a clear indication the bulls are in control. Similarly, the bears are in control if the price continues to trend below the red separator line. Download Price Elevator MT4
Trend Re-entry In this case you would plan your buy entries above the green dotted box (make sure to set the Buy / Sell Retracement Floor=30). The SL should be

OBTENEZ D'AUTRES EA GRATUITEMENT !!! OBTENEZ D'AUTRES EA GRATUITEMENT !!! OBTENEZ D'AUTRES EA GRATUITEMENT !!! OBTENEZ D'AUTRES EA GRATUITEMENT !!! OBTENEZ D'AUTRES EA GRATUITEMENT !!!
USD Scalper MT5 est un Neural EA pour les paires USD. Ce produit est fait pour GBPUSD, EURUSD, AUDUSD, NZDUSD. De nouvelles paires pourraient être ajoutées à l'avenir.
PAIRES ACTUELLES :
GBPUSD
EURUSD
AUDUSD
NZDUSD - SERA AJOUTÉ DANS LA PROCHAINE VERSION
CONTRIBUTIONS:
RISQUE POURCENTAGE D

This indicator gives you arrows, two SR lines and a golden trend line. Uses a special trend algorithm to plot the arrows, combined with support and resistance inputs. Perfect for channel trading. Features alert functions.
Parameter TrendArrowPeriod. Parameter TrendLinePeriod. (Change to your preference) How to use: Simply attach to any chart with default settings. Zoom in the chart, to see the two blue SR lines and arrows more clearly. When the blue SR line is below the price, golden trend line
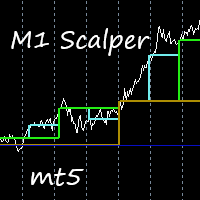
This indicator is excellent for scalping on the M1 or M5 chart. Uses a special algorithm for the lines. No need to set up the indicator. Does not feature any alerts and is best used manually after visually confirming the line displays. NB: Make sure to download M1 history before testing and use.
How to use: Simply attach to M1 or M5 chart. Zoom chart out completely. Sell when all lines above the white line (PriceLine). Sniper line crosses above white line. Buy when all lines below the white li

40% off. Original price: $50
Ichimoku Trend Finder is a multi symbol multi timeframe trend dashboard that helps traders to monitor and identify potential market trends from one chart. This panel scans the Ichimoku Kinko Hyo indicator in 28 configurable instruments and 9 timeframes for classic Ichimoku trend signals with a deep scan feature to scan all market watch symbols (up to 1000 instruments!).
Download Demo here (Scans only M1 and M6) Settings description here MT4 version here
L'objectif principal de cet expert en trading est de remplir les fonctions d'un stop suiveur. Il n'ouvre ni ne ferme les positions, mais définit et déplace uniquement les niveaux de prise de profit et de stop loss. Pour calculer le take profit et le stop loss, les statistiques de mouvement des prix et l'espérance morale de D. Bernoulli sont utilisées. Pour cette raison, les nouveaux niveaux fixés par l'expert offrent la meilleure option (du possible) en termes de rapport risque/récompense. Rega

The idea behind this indicator is very simple , First it contains 2 mechanisms to place your trades:
1- Enter the Pips you want to duplicate to price levels. 2- Automatically let the indicator specify the largest Buy / Sell Volume Candle and place duplicated levels based on the candle itself.
How it works: 1- Enter the Pips you want to duplicate to price levels: 1- once the indicator is loaded you will need first to Specify the number of pips in the indicator Configuration window ,you can

« Pratiquement tout le monde peut nous pardonner l'honnêteté : et, disons, un jeu insuffisamment professionnel, et même une poésie insuffisamment professionnelle. Il existe de nombreux exemples de cela. Mais quand l'honnêteté disparaît, rien n'est pardonné.
Golden Rings - Le robot financier Forex offre des options pour trouver des transactions rentables même sur des marchés instables lorsque la direction actuelle de la tendance n'est pas claire. Il suivra la meilleure tendance pour maximiser
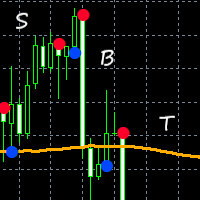
This indicator combines input from two trend filters and the ADX. You can change the trend line on chart to your preference. Great for scalping and channels. Features alert function and parameter TrendLinePeriod.
How to use: Simply attach to any chart. Sell on red bullets, with trend line above price. Enter on bullets closest to this line. Buy on blue bullets, with trend line below price. Enter on bullets closest to this line. Best results when checking the higher time frames before entering t
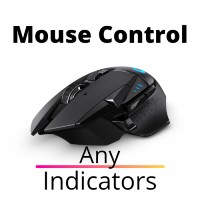
L'utilitaire contrôle n'importe quel paramètre de n'importe quel indicateur, en utilisant la molette de défilement de la souris. Si vous avez acheté ou loué un indicateur, vous pouvez modifier son interface à l'aide de cet utilitaire. Tout indicateur qui a au moins un paramètre entier est approprié pour cela.
Si vous voulez d'abord essayer comment cela fonctionne, téléchargez gratuitement l'indicateur Standart Scroller pour contrôler les indicateurs à partir de la Livraison standard du termi

This EA combines signals from Keltner's channels and other indicators, executes buy and sell against the trend of the selected time frame, great assertiveness with selection of specific parameters for each asset. Ideally, you should test the parameters in the backtest to validate the strategy. Enjoy the best that technology has to offer you. If you are interested in my individual presets please contact us here in the chat or send an email, vendas.mercadocapital@gmail.com.

Hello traders. The Ultimate Machine is a versatile robot, primarily designed to trade the XAUUSD symbol on the H1 time frame using default settings. However, if you wish to trade on a different currency pair, such as EURUSD, you'll need to undergo the optimization and testing process. Therefore, I recommend testing the robot extensively on a DEMO account before proceeding further. If you're exclusively using this robot, there's no need for additional adjustments. However, if you're simultaneousl

L'indicateur TickCounter compte les ticks de haut en bas sur chaque nouvelle barre.
Le calcul commence à partir du moment où l'indicateur est placé sur le graphique.
Les barres d'histogramme représentent : Barres jaunes - nombre total de ticks ; Barres bleues - ticks UP ; Barres rouges - coches vers le BAS. Si la barre bleue n'est pas visible, il y a plus de graduations vers le bas et la barre rouge s'affiche au-dessus de la bleue (la couche rouge est au-dessus de la bleue). MT4 version: h
Le MetaTrader Market offre un lieu pratique et sécurisé pour acheter des applications pour la plateforme MetaTrader. Téléchargez des versions démo gratuites de Expert Advisors et des indicateurs directement depuis votre terminal pour les tester dans le testeur de stratégie.
Testez les applications dans différents modes pour surveiller les performances et effectuez un paiement pour le produit que vous souhaitez en utilisant le système de paiement MQL5.community.
Vous manquez des opportunités de trading :
- Applications de trading gratuites
- Plus de 8 000 signaux à copier
- Actualités économiques pour explorer les marchés financiers
Inscription
Se connecter
Si vous n'avez pas de compte, veuillez vous inscrire
Autorisez l'utilisation de cookies pour vous connecter au site Web MQL5.com.
Veuillez activer les paramètres nécessaires dans votre navigateur, sinon vous ne pourrez pas vous connecter.