Regardez les tutoriels vidéo de Market sur YouTube
Comment acheter un robot de trading ou un indicateur
Exécutez votre EA sur
hébergement virtuel
hébergement virtuel
Test un indicateur/robot de trading avant d'acheter
Vous voulez gagner de l'argent sur Market ?
Comment présenter un produit pour qu'il se vende bien
Expert Advisors et indicateurs pour MetaTrader 5 - 73

Global Intel Invest Gold Scalping EA work with gold scalping to give you best results.
Timeframe: Works with current timeframe you have set (BEST WITH M5) You can backtest as per your need
It will buy 0.01 lot per $1000 and it will increase gradually as per the balance. ( If you have $10000 balance in your account it will trade with 0.1 lots)
If you have any questions or query reach us via skype: globaladsmedia / whatsapp: https://chat.whatsapp.com/Jn0ut8ywKLc3ES9TvC9wUJ  ; / emai

Our EA works on RSI and gives you good results on below listed curreny pairs:
USDJPY USDCHF GBPUSD AUDUSD EURUSD NZDUSD EURCHF USDCAD ( These are the best pairs so far rest you can try and test )
Attach our EA on each pair manually.
Timeframe: Works with current timeframe you have set (BEST WITH M1 and M5) You can backtest as per your need.
It will buy 0.01 lot per $100 and it will increase gradually as per the balance. ( If you have $1000 balance in your account it will trade with 0.1 lo

Session Break FVG EA is an Expert Advisor for trading any pairs on any timeframe, with an accuracy and performances never seen before. All trades are protected by a Stop Loss and use a Take profit or trilling stop to exit profitable trades. It operates during the Aisa, London, and New York markets times. It's smilier to ICT strategy. EA first wait for session to break then it looks for FVG (Fair Value Gap) to form. Every trade has stop loss and take profit. Not using any danger strategy like mar
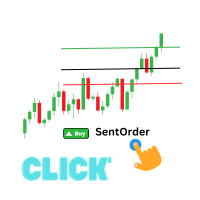
This program is a GUI for issuing orders that can be done more quickly. Faster TP SL setting This program is not an automated trading platform. Trading is risky, please manage your risk. We do not accept any responsibility. It should be tried with Demo before using it with Real. Normally, the setting sets the risk to 1:1 to shift manually or to enter the risk to x:1, where x can be entered and everything can move freely. Thank you to all customers who have purchased our products. We would like t

简介 本产品迈达量化全系列一款集很多功能为一体的交易面板。 支持便捷性交易,风控系统,跟单系统及图形绘制。 它会是你交易路上的得力助手。 功能介绍
第一个标签是常用的交易工具,支持划线下单,鼠标下单等快捷开仓和挂单工具。 第一个标签是关闭仓位和删除挂单功能,支持按比例,魔术编号,产品符号操作。 第三个标签是工具集合栏目,支持各种常用的交易工具。 订单管理,可实现订单批量选择操作,更直观简介。 风控系统,支持净值风控,手数,单数控制,支持手机挂单风控。 键盘交易,可以实现键盘按键成交和关闭仓位,同时可实现组合操作。 图表管理,可绘制交易时段,也可分类删除图表绘制的各种构件,也可绘制交易时段。 信息统计,统计账户信息,产品信息及终端信息。 跟单系统,支持开仓,挂单,删除挂单,部分平仓,可选择定制信号,如魔术编号等。 特色的优点 各种支持交易的工具组合一体,不用来回切换多个软件。 软件设计漂亮美观,高亮显示,运行流畅,模块紧凑,用户体验好。 各种工具互相搭配使用可实现复杂的交易操作。 关于我们 欲了解更多我们产品信息,请[点击这里]( https://www.mql5.com/e
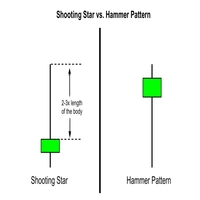
The Candlestick Reversal Alert for MT5 is your ultimate tool for identifying potential trend reversals in the financial markets. This powerful indicator is designed exclusively for MetaTrader 5 (MT5) and is packed with features to help you stay ahead of market movements. Key Features: Customizable Reversal Criteria: Tailor the indicator to your trading style by adjusting parameters such as lower wick size, top wick size, and top wick percentage. Historical Analysis: Specify how many historical c

The SuperTrend indicator is a popular technical analysis tool used by traders and investors to identify trends in the price of a financial instrument, such as a stock, currency pair, or commodity. It is primarily used in chart analysis to help traders make decisions about entering or exiting positions in the market. this version of super trend indicator is exactly converted from trading view to be used in MT5

Je présente notre nouveau robot Sauron MT 5. Il utilise la dernière technologie GPT et l'apprentissage automatique pour améliorer les résultats commerciaux. La stratégie repose sur la conclusion de transactions fréquentes, chacune sécurisée par un stop loss et un take profit. POURQUOI SAURON : - pour un prix bas, vous obtenez un robot professionnel et vous pouvez automatiser votre trading - dès le début, vous disposez des meilleurs paramètres chargés, que nous avons testés depuis longtemps - opé

//--- indicator settings input string Custom_Symbol_SetName = "Nayuta"; Custom_Symbol_SetName Le paramètre servira de nom de variété pour votre graphique personnalisé, le graphique personnalisé sous ce nom enregistrera les changements de valeur nette de votre compte après que vous avez activé le service, vous aidera à analyser vos transactions, les statistiques de changement de position sont déjà ouvertes, affichées sur votre graphique d'ordinateur à la manière d'un graphique à bougies, une

//--- input parameters input ENUM_TIMEFRAMES InpPeriod = PERIOD_D1; // Period input int InpBandsShift = 15; // Shift
Un indicateur qui affiche d'autres courbes de bougie de cycle arbitraire dans l'icône, peut analyser efficacement les mouvements du marché, plus efficace, plus concis et plus intuitif. Merci pour l'achat et l'utilisation, il y a de meilleures suggestions s'il vous plaît laissez un message dans la zone de commentaires, je serai le premier à répondre, ici féli

//--- input parameters input int InpFastEMA = 12; // Fast EMA period input int InpSlowEMA = 26; // Slow EMA period input int InpSignalSMA = 9; // Signal SMA period input ENUM_APPLIED_PRICE InpAppliedPrice = PRICE_CLOSE; // Applied price
Une version combinée de deux indicateurs regroupant les plates - formes macd et mql traditionnelles permet une analyse efficace des mouvements du marché, plus efficace, plus concis
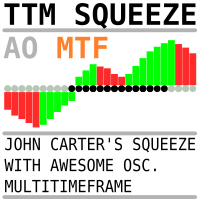
The same indicator as here Скачайте Технический индикатор 'John Carters TTM Squeeze with MACD Multitimeframe' для MetaTrader 5 в магазине MetaTrader Market (mql5.com) , but instead of MACD, Bill Williams' AO (Awesome Oscillator) is used. It goes well with a sleeping Alligator to determine periods of "compression-calm", which may be followed by significant movement.
It is useful to use an indicator from a higher timeframe (coefficient 5 or 6) to determine the possible direction of a breakout.
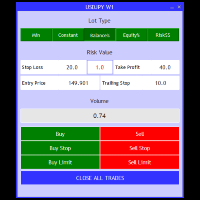
The Trade Manager is a visual trade panel that makes it simple to place and manage trades, preventing human errors and enhancing your trading activity. - Very Easy to use - Trade easily from the chart - Trade with precise risk management - Offers different risk management options to calculate appropriate lot size. - A powerful risk and position management approach

Introducing SMART ROBO 2 - Your Ultimate EUR/USD Trading Partner! Discover the Future of Forex Trading with SMART ROBO Key Features: Tailored for the EUR/USD pair Precision trading using RSI, Moving Averages, and Volume indicators Auto-selection of the optimal Moving Average Period Strategically timed order placements to capitalize on market activity Designed to thrive even with low account balance Intelligent error detection with preventive actions Expertly optimized for current-year trading

Enhance your trading strategy and optimize your market entries with the Power MA Rectifier Indicator, now available for sale on the MetaTrader 5 (MT5) Market platform. This innovative indicator combines the power of Moving Averages (MA) with a rectification algorithm, providing traders with valuable insights to make informed trading decisions. Key Features: Moving Averages Integration : The Power MA Rectifier Indicator leverages Moving Averages to analyze market trends, helping traders identify

The QQE indicator is a momentum-based indicator used to identify trends and sideways. The Qualitative Quantitative Estimate (QQE) indicator works like a smoothed version of the popular Relative Strength Index (RSI) indicator. QQE extends the RSI by adding two volatility-based trailing stops. This indicator is converted Qfrom Trading View QQE MOD by Mihkel00 to be used in MT5 Version.

Support And Resistance indicator that can display round levels and zones . It shows them directly on the chart, providing an easy help when you want to set stop-loss or take-profit level, or when you want to see the next market target. If an asset price is moving down and bounces back up, the level is called support (think: price floor). If an asset price is moving upward and hits a level where it reverses downward, this is called resistance (think: price ceiling).

Best Pivot Point Indicator display pivot points and support and resistance lines for the intraday trading. It calculates them using its own formula based on the previous trading session The indicator can display the following levels in addition to plain pivot points: Previous session's High and Low, today's Open. Sweet spots. Fibonacci levels. Camarilla pivots. Midpoint pivots.

Indicator can be used for dxy correlation trading. it calculates the dollar index (USDX or DXY) using the EUR/USD, USD/JPY, GBP/USD, USD/CAD, USD/CHF and USD/SEK currency pairs. In order to trade them, you need to find a confirmed technical analysis pattern on the DXY chart and look for a correlated currency pair that has the same picture on its price chart.
The formula used for calculation is the following: USDX = 50.14348112 × EURUSD -0.576 × USDJPY 0.136 × GBPUSD -0.119 × USDCAD 0.09

Account Protector Meta Trader 5 This utility prevents risk of ruin per trading cycle. Retail forex trading accounts are designed with stop out levels that make it impossible to quickly restore lost trading capital (to initial levels) in the event of a human or algorithm trader " blowing" an account. This hampers the efforts of a trader who after growing an account investment to a multiple of its initial value, suddenly suffers irreparable loss because of several trade entry mishaps.
This EA has been developed, tested and traded live on USDJPY H1 TF. Everything is ready for immediate use on real account. Very SIMPLE LONG/SHORT STRATEGY with only FEW PARAMETERS. Strategy is based on the breakout of the PIVOTS on the daily chart. It enters if volatility raise after some time of consolidation . It uses STOP pending orders with ATR STOP LOSS. To catch more profits there is a TRAILING PROFIT function in the strategy. EA has been backtested on more than 20-year lon

Welcome to Propsense, the best solution for new and veteran traders with a simple FREE strategy! NEW to MT5! This indicator is a unique and affordable trading tool built on the teachings of a former bank trader. With this tool, you will be able to see inefficient points with ease. Additionally, traders will have a clean Heads Up Display which will show your running and closed P/L in pips AND currency units. As a highly requested option, a candle timer has been added which will allow you to j
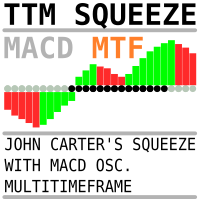
The same indicator as here https://www.mql5.com/ru/market/product/105089?source=Site+Market+My+Products+Page but with timeframe change possibility. It is convinient to see picture from different timeframes in the single chart. When using multiple timeframes, it is recommended (A.Elder "The new trading for a living") to adhere to a coefficient of 5 or 6. That is, the two older timeframes for a 5-minute chart will be 30 minutes and 3 hours.

Maximize Your Trading Potential with TurboRSI Pro Introducing TurboRSI Pro, your ultimate partner for navigating the financial markets. What is TurboRSI? TurboRSI is an expert advisor designed for traders looking for substantial profits. With its robust algorithms and a focus on harnessing the power of the Relative Strength Index (RSI), TurboRSI is your key to dominating the art of trading. How TurboRSI Pro Works Upon attachment to any chart, it usess the RSI indicator to identify optimal entry

In the fast-paced and ever-evolving world of stock trading, having a reliable compass is essential for navigating the complexities of the financial markets. Meet the Stock Trade Navigator, your trusted partner in the quest for investments. Unlock the Power of Data: Our Stock Trade Navigator is not just a tool; it's your data-driven co-pilot. Harnessing cutting-edge algorithms and real-time market data, it empowers you with a comprehensive view of the financial landscape, enabling you to make inf

This utility tool helps us to open trades and set orders very simply by just double-clicking on the chart. The volume of the positions and orders can be a constant lot size or determined based on a risk of equity. Take profit limit of the positions can be determined based on a Risk to Reward Ratio or simply by just a double-click.
For Positions: 1- At first, you need to double-click on the SL price. (For a buy position, you need to click on a price below the live price, and for a sell posit

Emilian: L'Expert Advisor pour MetaTrader 5 Aperçu Rencontrez Emilian, l'Expert Advisor qui utilise des Moyennes Mobiles Exponentielles (MME) et l'Indice de Force Relative (RSI 21) pour ouvrir et fermer des trades.
Offrant des stratégies de gestion des risques personnalisables, Emilian utilise également la True Range Moyenne (ATR 12) ou des valeurs spécifiques en pips pour définir les niveaux de Take Profit et de Stop Loss.
Caractéristiques Clés Stratégie de Croisement de MME: Utilise des M
A formidable ally for historical testing with Fixed Perspective through ZigZag and Dow Theory, while also supporting ReviewCandleChart. A recommended tool for those troubled by 'lost perspectives.
Overview The 'RCCZigZagDow' indicator is a tool that assists in making judgments based on Dow Theory in relation to ZigZag waves. By using ZigZag waves as a basis to derive continuation points according to Dow Theory, it offers the advantage of ensuring that anyone can interpret trends in the same
This is a simple utility which will put automatic Stop Loss and Take Profit on all your open trades based on ATR indicator values. Whenever you open a trade, it will put ATR times Stop Loss and Take Profit automatically. Stop loss and take profit are two important tools used by traders to manage risk and set profit targets in financial markets. The Average True Range (ATR) indicator can be a valuable tool in helping traders determine appropriate levels for these orders. Here's an explanation of

This product is converted form Trading View of Kivanc Ozbilgic to be used on MT5 and below are descriptions of developer on Trading View:
Anıl Özekşi's latest development on his precious OTT - Optimized Trend Tracker:
In this version, there are two lines of OTT which are derived from HIGHEST price values (HOTT) and LOVEST price values (LOTT) which were originally sourced to CLOSE values on default OTT.
Another significant difference is there is no Support Line (Moving Average) in this ver

This EA is a simple automated trading system for the Meta Trader 5 platform. It uses parabolic SAR to automatically adjust lot size based on market trends. By this, the EA does not take a large amount of risk, but instead steadily accumulates profits.
Main Features The EA does not use the martingale method for lot size adjustment. If a position is taken before the forex market closes, the position will be carried over to the weekend. This EA is designed to hold multiple positions at the same

Présentation de l'indicateur Zeus : Votre outil ultime pour percer dans les bénéfices en trading. Cet indicateur simplifie le trading en éliminant la nécessité d'une analyse approfondie avec des stratégies de breakout. Il dessine automatiquement des zones en fonction de vos intervalles de temps prédéfinis, suggère des niveaux de Stop Loss (SL), Take Profit (TP) et Trailing Stop. L'indicateur Zeus vous avertira rapidement et affichera des flèches de signal lorsque le prix atteindra les points d'e

Introducing US30 Innovator , the exceptional MQL5 expert advisor that's transforming the way you trade the legendary US30 pair! Developed by an experienced funded elite trader with development experience of over 10 years. US30 Innovator EA stands out from other expert advisors due to its remarkable approach to handling losing trades. First in first out, so there is no stress over holding many trades at the same period. This unique strategy allows the EA to optimize its risk management, min
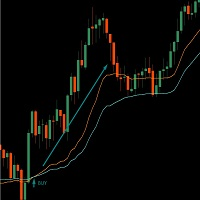
Cet indicateur est construit à l'intersection de deux indicateurs VMA (Variable Moving Average, ou VIDYA ou Variable Index Dynamic Average). Des paramètres flexibles vous permettront de trouver plus précisément le point d'entrée. Le rapide croise le lent et c’est un signal d’achat ou de vente. Fonctionne sur tous les instruments. Brève description de l'indicateur VMA : VMA (Variable Moving Average, également connue sous le nom de VIDYA ou Variable Index Dynamic Average) est une moyenne mobile ex
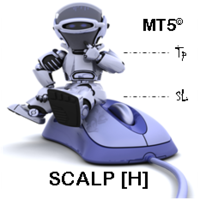
SCALP [H] is a panel-shaped robot designed to help the trader [scalper] trade on the Step Index, Step Index 200, Step Index 500, Multi Step 2 Index and Multi Step 4 Index assets [from Deriv.com broker]. From the dashboard, the trader can open new market orders and lock in the stop loss and take profit instantly. On the panel we have: the buttons to open new market orders; the buttons to select the points previously set in the inputs for stop loss and take profit and finally, the button for close

The Schaff Trend Cycle indicator is the product of combining Slow Stochastics and the moving average convergence/divergence (MACD). The MACD has a reputation as a trend indicator, but it's also notorious for lagging due to its slow responsive signal line. The improved signal line gives the STC its relevance as an early warning sign to detect currency trends. this indicator is converted from Trading View code of STC Indicator - A Better MACD [SHK]

The indicator has three main tools: Magnifier (Zoom chart), Ruler ( Time and Price scales ), and Crosshair. You can move it all around with your mouse and customize different formats for displaying , customize size and color of each element.
The Magnifier (zoom chart) allows you to display candles from any time frame and at different scales. Default hotkeys: 'Q' - higher timeframe, 'A' - lower timeframe, 'W' - decrease candle size, 'S' - increase candle size, 'Z' - show/hide zoom chart.
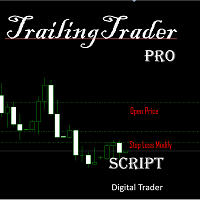
啟用TrailingTrader腳本後 報價視窗的交易品種 將會進行移動止損
設定參數 Symbol 設定需要移動止損的持倉品種 中間需要以","分隔 Magic 輸入需要移動止損的持倉單是別號 不需要識別時輸入-1 Comm 輸入 需要移動止損的持倉單是備註 不需要識別時不做任何輸入 TrailingDistance 啟動移動的點數 TrailingCallBack 移動止損的回調點數
工作原理 持倉單在獲利的條件下 市價超過設定的點數時 腳本自動設定止損線在市價回調的點數位置 當市價繼續往獲利的方向運行時 止損線會持續往運行方向調整 直到市價回調到止損線時獲利平倉 當同一品種持有多張持倉單時 移動止損會分開運行 當盈利超過一定的範圍時 移動止損線會形成同步狀況
特點 當交易員習慣手動開單 又無法長時間盯盤時 可以啟用移動止損 當持倉單一旦觸發工作 就可以確認該單會在獲利的條件下出場 可以跟EA交穿插使用 根據EA設定的Magic或Command做介入式管理
起用條件 需要使用MT5交易的電腦全天候開機運行 可以啟用腳本後 再同步到官方VPS 此時同步的腳本可以全天

Hello community, I present to you the new EA called Crash300 Sniper Boss It is used only in the Crash300 pair From the broker (Deriv) has the strategy, of a stochastic together with 2 emas of 100 and 7 periods It is used in a time frame of 5 Minutes and is used with the lot 0.50 / 1.00 according to the account balance It is recommended to start with a balance of 300 USD The recommended Stop loss and take profit is modified TP 300 SL 30000 The rest is left as it comes, It is used in time from 5 M

Volume Profile is a very useful indicator . it allows you to spot the price levels where important price action took place. It is similar to support and resistance levels but with a different logic. ( Check Out Fixed Range Volume Profile MT5 )
One of the first thing that traders mark up when analyzing a chart is support and resistance. Volume Profile can be used for doing that too.
The indicator scans the defined number of previous bars and calculates the volume of activity at each price

The VIX Fix is a volatility indicator developed by renowned trader Larry Williams. It's designed to measure volatility in assets that don't have options or futures, such as individual stocks and forex markets. Essentially, it acts as a synthetic VIX (Volatility Index) for any asset , providing a gauge of market uncertainty. This modified version of William's indicator helps you to find market bottoms and market tops. It comes with 2 styles: Stochastic and histogram style. Please see screenshots
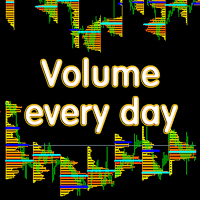
Основные отличия и преимущества индикатора Volume every day от похожего продукта Volume Profile V6 В Volume every day можно параметром Range period задать временной диапазон построения профиля, а параметром Range count задать количество профилей данных диапазонов. Например, на втором скрине Range period=1Day, а Range count=10 - это значит, что профиль будет строиться на периоде один день, десять последних дней. Важно, что переключение тайм фрейма графика не влияет на построение профиля, что т

Important Note: Trend Starter Indicator (TSI) detailed settings manual, trading strategies (coming soon) and setfiles (coming soon) are available in this LINK The Trend Starter Indicator (TSI) provides traders with precise and actionable signals for potential market entry points. By capitalizing on the unique interplay of two internal oscillators combined with astute price action monitoring, TSI optimizes and simplifies the decision-making process in the dynamic world of trading. But that'

This Automatic support/resistance indicator calculates various peaks and troughs of the price action, identifies relevant levels and draws support and resistance automatically. It uses the built-in "ZigZag" indicator in Metatrader as a data source hence, very much accurate indicator. The support and resistance lines are contineusely updated as new levels and formed. The indicator has only 5 parameters to set, and mostly it can be used with the default values: The description of the settings is

Pivot Point Super Trend is another type of famous super trend indicator which is equipped with pivot points in different way. this indicator used to be available in the Trading view and this is converted from there to the MT5 language. MT4 version of the indicator is also available and you can find in my products. there are also buy/sell signals shown on the screen.

ATR Stops is an indicator which shows Dynamic support and resistance lines by considering ATR value and also a multiplier. its highly effective to find out the trend direction and also is useful for using as stop loss levels. it could be used in different ways one usual way is to buy when line becomes green and sell when it becomes red. when its combined with money management rules and risk reward considerations there is good results.
The easy ea builder enables you to build expert advisors/robots without writing a singe line of code. It can be used by anyone. you can combine as many indicators as you want and you can also customize their settings to suit your needs. You can choose to use the robot only for alerts and notifications or for auto-trading .The tutorial video explains every thing in detail. You own all the rights to the robot you create as it comes with its source code separate from the ea builder. All the robots

Unlock the power of precise trend analysis and supercharge your trading strategy with Momentum Trend on MT5! Our cutting-edge trading tool is designed to provide traders with the essential insights and data needed to navigate the dynamic world of financial markets. Key Features: Accurate Trend Analysis : Momentum Trend utilizes advanced algorithms to accurately identify market trends, helping you stay ahead of the curve and make informed trading decisions. Real-Time Data : Stay updated with real
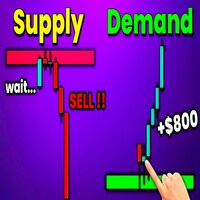
Best Solution for any Newbie or Expert Trader! This indicator is a unique, high quality and affordable trading tool because we have incorporated a number of proprietary features and a new formula. With this update, you will be able to show double timeframe zones. You will not only be able to show a higher TF but to show both, the chart TF, PLUS the higher TF: SHOWING NESTED ZONES. All Supply Demand traders will love it. :)
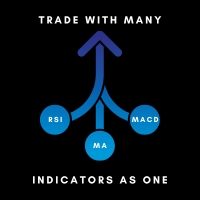
Trade Many Indicators is a tool that enables you combine and use 30 plus indicators at the same time without the confusion or cluttering up your chat . You receive a bullish signal when most of the indicators you turned ON indicate bullish and you receive a bearish signal when most or the indicators you turned ON give a bearish signal. All the indicators are customizable to your own needs.
It also includes a tool to automatically calculate your lot-size and open positions depending on how you p

This is the Full Version, to get the free version please contact me. The free version works on “USDJPY” charts. All symbols and time frames scanner. Contact me after payment to send you the User-Manual PDF File. OVER and UNDER
Over & Under pattern is an advanced price action trading concept in the trading industry. The Over & Under pattern is more than a confluence pattern or entry technique than a trading strategy. It is a reversal pattern that is created after a significant obvious trend. I

Toutes les 10 ventes, le prix augmente de 50 $ et le robot coûtera finalement 1 000 $. Présentation de notre tout nouveau robot construit sur une toute nouvelle stratégie apprise en stratégie de réseau neuronal. En collaboration avec notre équipe de programmeurs, nous avons créé un produit de la plus haute qualité. La stratégie utilisée dans le robot utilise le trailing stop et le SL caché. Le robot vise toujours à clôturer la position avec un profit. Avec notre robot, vous avez la possibilité d

Basic Gold Predictor is a sophisticated Expert Advisor meticulously crafted for traders and investors with a keen interest in the precious metal, gold. This advanced algorithm combines the power of multi-timeframe analysis and fundamental technical analysis to provide accurate and timely predictions for gold price movements.
Key Features: Multi-Timeframe Analysis: Basic Gold Predictor leverages multiple timeframes, from short-term intraday charts to longer-term daily charts. By considering var
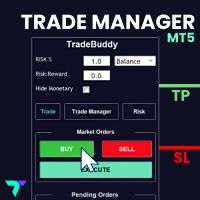
This adds an easy to use trading panel to your MetaTrader5 chart, enabling you to enter the market at lightning speed with your risk automatically calculated. Plus, it will help you automate your trade management with automatic & one click partial profits, stop loss to breakeven and more. Click here for the full Trade Buddy user guide If you want to test Trade Buddy before you purchase, please message us by visiting our profile and we will provide you with a 7 day free trial. Best of all, it’s c
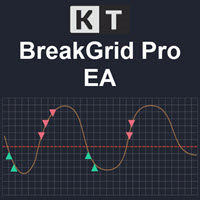
Unleash the power of precision and innovation in your trading with the KT BreakGrid Pro EA. Seamlessly blending the strategic prowess of breakout and grid trading, this expert advisor is your ultimate solution to navigating the complex Forex landscape with unmatched confidence and efficiency.
Recommendations
Symbol: EURUSD TimeFrame: M5 Account Type: Hedge Leverage: 1:500 Set Files: Not required. Default inputs provides best results.
Features Breakout-Infused Grid Strategy: Experience th

Introducing Auto Trendline Pro : Your Ultimate Trading Companion Are you tired of manually drawing trendlines on your forex charts? Do you wish for a tool that can simplify your trading while providing timely alerts? Look no further, because Auto Trendline Pro is here to revolutionize your trading experience. In the fast-paced world of forex trading, staying ahead of the curve is essential. Identifying trends, both upward and downward, can be a game-changer. This is where Auto Trendline Pro ste

The KT Trades Info indicator is useful for traders wishing to stay informed about their trading performance. This indicator provides real-time updates on the profitability of all ongoing and completed trades, enabling traders to make well-informed decisions. By incorporating key financial metrics, it provides a comprehensive picture of a trader's financial status at a glance. This means traders can monitor their performance with increased accuracy and precision, facilitating better risk manageme

- This is the exact conversion from TradingView: "Support/Resistance" By "BarsStallone". - This indicator lets you read the buffers for R/S values. - This is a non-repaint and light processing load indicator. - This is not a multi time frame indicator If you want the multi time frame version you should create a personal order and I deliver two files that you need them both to have the multi time frame indicator running on your system. - The MT4 version of the indicator is not light load from pr

Note: minimum investment 1000 usd or (100 usd is Account Cent (10000 Cent)) Run At 0.01 lot start. Trading with an Expert Advisor (EA) on the M1 timeframe (1-minute chart) can be quite challenging due to the rapid price movements and increased noise in such short timeframes. However, it's not impossible, and some traders do use EAs on the M1 chart for specific strategies. Here are some considerations for trading with an EA on the M1 timeframe: 1. Strategy Selection: Choose a trading strategy
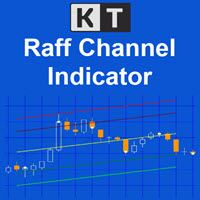
The KT Raff Channel is an enhanced and refined iteration of the original Raff channel concept pioneered by Gilbert Raff in 1996. This indicator builds upon Raff's initial work, incorporating modifications and advancements to provide traders with a more sophisticated and powerful tool. Gilbert Raff, a renowned name in the field of financial market analysis, is the developer of the Raff Regression Channel. This technical tool is designed for discerning and validating possible market price trends.

This is the Full Version, to get the free version please contact me.
The free version works on “AUDNZD” and “XAUUSD” charts.
All symbols and time frames scanner
Head and Shoulder
One of the most popular Price Action patterns is the Head and Shoulders pattern. The pattern has three local tops that resemble the left shoulder, head, and right shoulder. The head and shoulders chart pattern appears in all kinds of markets, including Forex, cryptocurrency, commodities, stocks, and bonds. The

"Triple Performance" Trading Strategy Harness the market's full potential with this dynamic strategy! Key Indicators: MACD (Moving Average Convergence Divergence): Identifies trend reversals. RSI (Relative Strength Index): Signals market conditions. CCI (Commodity Channel Index): Measures market strength. Main Benefits: Maximize profits by utilizing clear signals. Automatic position control with MACD. Easy customization with configurable RSI and CCI levels.
Works perfectly with EUR/

KT Momentum Histogram provides traders with a visualization of the momentum of a particular asset, which helps determine the strength and potential direction of a market trend. The indicator calculates and operates based on momentum in trading.
What Exactly is a Momentum Histogram
Momentum is the rate of acceleration of an asset's price or volume. In other words, it measures the speed at which the price of an asset is moving in a particular direction over a specific period of time. Positive

The indicator determines signals on a system of two components:
- correct fractals. The indicator that comes with MT4 and MT5 is quite crude, since some levels are calculated incorrectly. This indicator shows signals for the breakdown of strong levels. - wave level for fractals. Not to be confused with zigzag.
It is better to use on higher timeframes (M15 and higher), where the indicator perfectly shows entry points and reversal situations.
Of course, you can use standard indicators from

The KT Buy Sell Volume is a powerful tool traders use to gauge the strength and weakness of price movements. In the whirlwind of the Forex market, traders aim to identify and ride the waves of a bullish or bearish trend that exudes strength and potential. However, recognizing these trends necessitates a method, metric, or indicator to quantify their strength. One crucial factor that traders examine for this purpose is volume. Volume refers to the number of shares or contracts traded in a securit

Infinity Indicator MT5 1.0 Panel Asset Rate % EURUSD 96.0% GBPUSD 94.1% AUDCAD 90.5% USDCHF 87.8% BTCUSD 78.4% Panel Win Rate based on CandleMT4 Exit Button Calculates the StdDev standard deviation indicator on the RSI data, stored in the matrix similar to the keltner. input int HourCalculate = 12; RsiLength = 5; RsiPrice = PRICE_CLOSE; HalfLength = 4; DevPeriod = 100; Deviations = 0.9; UseAlert = true; DrawArrows = true; TimerWork=300; LevelUp = 80; LevelDown = 20; MoreS

Hello Traders..
Tried deals without stop-lose? :)
=-=-=-=-=--- Grid EA Robot { Simple Moving Average } crossover 4sma & 11sma Strategy ---=-=-=-=-=
BY below pics you will know what strategy doing by automatic open and close Trades.
[ BUY ]
4.sma crossover 11.sma
https://ibb.co/0XZFBf2
[ SELL ]
11.sma crossunder 4.sma
https://ibb.co/VpqsLmD
[ backtest ] - XAUUSD - settings below. Note: don't change these settings for ( xauusd pair ) -TF 1 hour
https:/

This indicator is used to find support and resistance lines
The support and pressure of different time periods can be found in the same icon cycle, and two time periods are provided here
Parameter Description:
---------------------- Main ---------------------
Timeframe //Used to select the main time period (recommended as the default PERIOD_D1);
Retracement interval //This value is the root number of backtracking k-lines (recommended to be 20 by default);

Présentation de l'Expert Advisor Forex ultime : une bête conçue pour conquérir le trading automatisé en toute simplicité. Ce n'est pas juste un autre Expert Advisor ; c'est une véritable puissance conçue pour révolutionner votre expérience de trading. Après 14 années de tests incessants, d'affinements et d'un dévouement sans faille, je suis fier de vous présenter un Expert Advisor qui a mérité son nom et son prix. Voici pourquoi il se démarque des autres : Flexibilité inégalée :
Cet Expert Adv
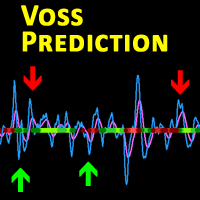
Description This is a modified version of the popular Voss Predictive Filter - A peek into the future by Dr. John Ehlers. It contains 2 lines - V-Line (blue) and F-Line (red), a trend indication and BUY/SELL signals.
Usage Buy Green dots indicate an up trend. Open a BUY position if the V-Line crosses the F-Line from below and an up trend is signaled (green dots) Close BUY position if V-Lines falls beneath F-Line again Sell Red dots indicate a down trend Open a sell position if V-Line falls
Le MetaTrader Market est la seule boutique où vous pouvez télécharger un robot de trading de démonstration gratuit pour le tester et l'optimiser à l'aide de données historiques.
Lisez l’aperçu de l'application et les avis d'autres clients, téléchargez-la directement sur votre terminal et testez un robot de trading avant de l'acheter. Seul MetaTrader Market vous permet de tester gratuitement une application.
Vous manquez des opportunités de trading :
- Applications de trading gratuites
- Plus de 8 000 signaux à copier
- Actualités économiques pour explorer les marchés financiers
Inscription
Se connecter
Si vous n'avez pas de compte, veuillez vous inscrire
Autorisez l'utilisation de cookies pour vous connecter au site Web MQL5.com.
Veuillez activer les paramètres nécessaires dans votre navigateur, sinon vous ne pourrez pas vous connecter.