Regardez les tutoriels vidéo de Market sur YouTube
Comment acheter un robot de trading ou un indicateur
Exécutez votre EA sur
hébergement virtuel
hébergement virtuel
Test un indicateur/robot de trading avant d'acheter
Vous voulez gagner de l'argent sur Market ?
Comment présenter un produit pour qu'il se vende bien
Expert Advisors et indicateurs pour MetaTrader 5 - 206
The Gold Nugget PF is a powerful automated trading solution designed to capitalize on market range movements. Specifically crafted for traders who leverage high-low range strategies, this bot identifies optimal trading opportunities within defined price boundaries and executes precise trades for maximum profitability. Because this strategy is so unique, I only want to sell a limited number of licenses. Therefore, the price will steadily increase to limit sales. Next price is 190 USD. Broker - A

Momentum Explosion Pro is an advanced trading indicator designed to help traders identify and capitalize on powerful market movements. By analyzing momentum and volatility dynamics, this tool provides clear buy and sell signals, empowering traders to make precise and timely decisions. Key Features: Momentum and Explosion Signals: Accurately detects shifts in market momentum and explosive price movements to highlight profitable opportunities. Customizable Alerts: Stay informed with notificati

Swing Trading Expert Advisor - a reliable tool for efficient market trading.
This Expert Advisor is designed to automate swing trading strategies in financial markets. It uses proven indicators such as Moving Average (MA) and Average True Range (ATR) to identify the most suitable entry and exit points. This allows you to follow current market movements and trade in the direction of the trend.
The advisor works with a fixed volume and also has flexible parameter settings for risk management, i

Unlike most EAs on this marketplace, the UJ Drive EA does not promise overnight riches or unrealistic gains. Instead, it is built on a solid foundation of trend-following , a principle that has stood the test of time for over 200 years . At the core of the UJ Drive EA lies a modern adaptation of the legendary Turtle Trading Strategy , one of the most successful trend-following systems in history. By focusing on simplicity and timeless logic, UJ Drive EA identifies and captures trends often slig

Indicateur PS Time and Spread pour MT5
Améliorez votre expérience de trading avec l' indicateur PS Time and Spread , un outil polyvalent conçu pour fournir des informations clés directement sur votre graphique. Fonctionnalités principales Compte à rebours : Affiche un compte à rebours en temps réel pour la bougie actuelle, idéal pour les scalpers et les traders intraday. Affichage du spread : Surveillez le spread en temps réel de l'actif sous-jacent directement sur le graphique. Cette fonction
Une bibliothèque facile à utiliser qui offre aux développeurs un accès simplifié aux statistiques clés du trading pour leurs EAs en MQL5. Méthodes disponibles dans la bibliothèque : Données du compte et bénéfices : GetAccountBalance() : Renvoie le solde actuel du compte. GetProfit() : Renvoie le bénéfice net de toutes les transactions. GetDeposit() : Renvoie le montant total des dépôts. GetWithdrawal() : Renvoie le montant total des retraits. Analyse des transactions : GetProfitTrades() : Renvoi

Hedging Manager Pro for MT5 Take Control of Your Trades – The Ultimate Manual Hedging Solution! Hedging Manager Pro for MT5 is a powerful tool designed to empower traders with precision and speed in critical market situations. Unlike automated EAs, this tool gives you full manual control over your hedging actions, allowing you to safeguard your capital and manage your positions with ease and efficiency. Key Features and Benefits : Manual Hedging at Your Fingertips : Hedge your positions instantl
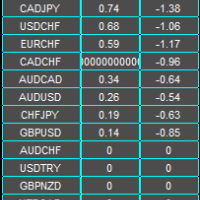
Abbeyfx Swap Dashboard displays your broker swap/interest rate. The implied swap/interest rate differential is for all currency pairs you have in your market watch. Interest rate differential: The key factor traders consider is the difference in interest rates between two currencies involved in a pair, known as the "interest rate differential Impact on currency value: A higher interest rate typically makes a currency more attractive, causing its value to rise relative to other currencies with lo
The Precision Scalping Indicator is a powerful and versatile trading tool designed to enhance your scalping strategies across various financial markets. Whether you trade forex pairs, commodities like Gold (XAU/USD), cryptocurrencies such as Bitcoin (BTC), or synthetic indices from Deriv, this indicator adapts seamlessly to your trading style. Key Features: Non-Repainting Signals : Ensures signal reliability by displaying fixed signals that don't disappear or repaint. Audible Alerts : Real-time

️ EA Close Order Time (Code by ThangTruong)
- Automatically close orders by time (day + hour) - Close orders by currency pair installed EA or all currency pairs - Close all BUY orders by time - Close all SELL orders by time - Close all PROFIT orders by time - Close all LOSS orders by time
Details at: https://discord.gg/J87vyRUJCj
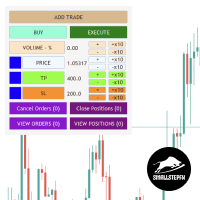
The SSFx Manual Backtester EA revolutionizes manual strategy testing in MQL5's strategy tester by offering an intuitive, feature-rich interface for managing trades with ease. Testing manual strategies has traditionally been cumbersome, but this tool simplifies the process, allowing traders to simulate forward testing using historical data as though trading in real-time. Key Features: Add Trades Seamlessly: Click the "Add Trade" button to temporarily pause the strategy tester, giving you time to

This tool is designed to visualize the position and trades history and its information, such as the entry and exit points, sizes of the trades, Reward to risk ratio, Risk percent, Profit, Target and stop-loss on the chart. it makes showing trades on the chart more informative and easier to use. it's a strategic tool that enhances your trading experience on MT5 platforms. By providing a clear visual representation of your trades and customizable settings, it empowers traders to make informed deci

Ce coefficient s'échange sur la trame 5 minutes 5M Veuillez voir les explications dans les images ci-jointes
Le trading se fait selon la tendance. Si la tendance est à la hausse, on achète uniquement lorsqu'elle touche la ligne rouge. Si la tendance est à la baisse, nous vendons uniquement lorsqu'elle touche la ligne bleue Dans le cas d'une tendance latérale, on peut vendre lorsqu'elle touche la ligne bleue et acheter lorsqu'elle touche la ligne rouge.
Lorsque le prix atteint la ligne d'acha

Price Position Indicator....
This indicator tells you exactly when to buy or sell in the market with alerts, it works on any time frame and with any market of your choice, it is highly accurate and is definitely worth the investment, this indicator performs well with the moving average indicator i also have for sale, be sure to check out my profile to see my products.
it gives out buy and sell signals based on where the current price is, it follows the trend as well.

Gold SWmax EA - est l'un des meilleurs Expert Advisor pour Meta Trader 5. L'algorithme unique du conseiller analyse le mouvement du prix de l'actif, en tenant compte des facteurs d'analyse technique et mathématique, détermine les points d'entrée et de sortie rentables et utilise une gestion avancée de l'argent et un multiplicateur de lot. L'Expert Advisor négocie selon un algorithme unique, en utilisant des analyses mathématiques et logarithmiques du prix du symbole. EA price will go up, now 69

The Golden Samurai uses my personal strategy to find entry signals, The indicator it uses is simple but yet effective. It is used by professional traders for many years and now also part of the MT5 framework. If you ever wanted to use the indicator's signals for scalping entries, this is the right EA for you.
2 different tests were done on the preview photo's, this is to show that the bot is profitable long term and short term, !!!!!Please note that I never recommend specific settings because

Functionalities - Open buy and sell - Customizable break-even AND TP SL - Implements Martingale Features
Recommendations - Currency pairs: Major currency pairs - Currency pairs recommend : EURUSD - Not recommended : XAUUSD - Timeframe : 1H - Minimum deposit: $2000 per currency pair *Recommend $10000 - Leverage: Minimum 1:100, recommended 1:500 - Account type: ECN, Raw, or Razor with very low spreads. - Use a VPS for the EA to operate 24/7 (strongly recommended)
Warning - Withdraw profits ev

Trend Following with Adaptive Weighted Average (AWA) Indicator The Adaptive Weighted Average (AWA) indicator is is a powerful technical analysis tool designed to provide highly accurate trading signals across various symbols and timeframes. This indicator leverages a unique Adaptive Weighted Average (AWA) calculation, combining multiple moving averages with user-defined weights, and incorporates advanced filtering techniques to minimize noise and whipsaw signals. The indicator is particularl

Breakout Strategy: Full Automated and Semi-Automated Trading Robot Starting with you, continuing with the robot. "After purchasing the bot, message me on WhatsApp or email, and you'll receive a powerful and highly useful indicator—perfect for trading the New York session—as a free gift!" Contact: WhatsApp How the Semi-Automated Robot Works Test is free : https://t.me/ForexAssistant The robot provides flexibility by allowing the user to define a specific area for price monitoring. Here's how
【R】【Y】【M】 【R】【Y】【M】 【R】【Y】【M】
The Linear Regression Channel Indicator is a powerful technical analysis tool that helps traders capture price trends and potential reversal points. By calculating and displaying linear regression channels, bands, and future projections, this indicator offers an in-depth perspective on market dynamics. It aids in identifying overbought and oversold conditions, trend direction, and provides clear visual cues for potential future price movements.
STILL ON I
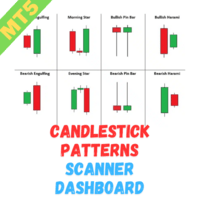
Candlestick Pattern Scanner Dashboard MT5 est un outil puissant pour surveiller les motifs de chandeliers sur plusieurs paires de devises et périodes de temps. Il organise les motifs détectés sous forme de grille, affichant la forme courte du motif et le nombre de bougies depuis son apparition (par exemple, BUEN(3) pour un motif de Bullish Engulfing détecté il y a trois bougies). Vous pouvez trouver la version MT4 ici : CandleStick Patterns Multicurrency Scanner MT4 Pour la documentation déta

The “RamonX” Expert Advisor is designed to automate trading based on a simple and reliable strategy of crossing two moving averages (Moving Averages). This approach is widely used by traders to identify trends in the market and find entry and exit points.
Functionality: 1. Basic strategy: - The Expert Advisor analyzes the crossovers of two moving averages (fast and slow) on the selected timeframe. - Trade opening: - Buy: occurs when the fast moving average crosses the slow moving a

- Strategy: The expert advisor is based on the crossover of fast and slow moving averages (MAs). This is a classic approach that helps identify trend directions. - Flexible Settings: Users can easily configure the periods of moving averages, calculation methods (SMA, EMA, etc.), price types (close, open, etc.), as well as Stop Loss and Take Profit levels. - Risk Management: It supports strict risk limits with precise lot size adjustments and automatic verification of minimum and maximum stop le

The Ichimoku Multicurrency Scanner Dashboard MT5 is a powerful trading tool designed for monitoring multiple currency pairs and timeframes using Ichimoku Kinko Hyo. It organizes signals in a grid format, with symbols grouped by base currencies and timeframes, ranging from M1 to MN1. Traders can enable or disable specific timeframes to suit their strategies. You can find the MT4 version here Ichimoku Cloud Multicurrency Scanner MT4 For detailed documentation click here Ichimoku Integration: The
The Moving Average Multicurrency Scanner Dashboard MT5 is a powerful trading tool designed to monitor multiple currency pairs and timeframes using customizable moving averages. It organizes signals in a grid format, displaying each symbol’s status across timeframes from M1 to MN1. Traders can enable or disable specific timeframes to align with their strategies. You can find the MT4 version here Moving Average Multicurrency Scanner MT4 For detailed documentation click here
Moving Average I
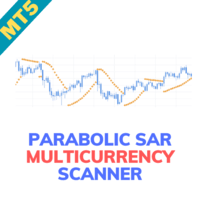
The Parabolic SAR Multicurrency Scanner Dashboard MT5 is a comprehensive tool for monitoring multiple currency pairs and timeframes using the Parabolic SAR (PSAR) indicator. It organizes signals in a grid format, displaying each symbol’s status across timeframes from M1 to MN1. Traders can enable or disable specific timeframes based on their strategies. For detailed documentation click here Parabolic SAR Integration: The dashboard uses the PSAR indicator with customizable parameters for Step and

Quantum Weave — это автоматизированный торговый советник, который помогает трейдерам в принятии решений на финансовых рынках. Основная идея стратегии заключается в использовании пересечения двух скользящих средних (SMA) для идентификации потенциальных точек входа в рынок.
Советник анализирует рыночные данные в реальном времени, чтобы: - Определить моменты, когда цена демонстрирует устойчивую тенденцию. - Автоматически открывать сделки на покупку или продажу в зависимости от условий рынка.
- И
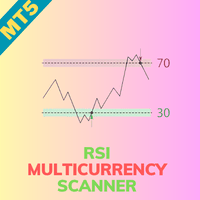
The RSI Multicurrency Scanner Dashboard MT5 is a powerful tool designed to monitor multiple currency pairs and timeframes using the Relative Strength Index (RSI). It organizes signals in a grid format, displaying each symbol’s status across timeframes from M1 to MN1. Traders can enable or disable specific timeframes to suit their strategies. You can find the MT4 version here RSI Multicurrency Scanner MT4 For detailed documentation click here RSI Indicator Integration: The dashboard supports fou
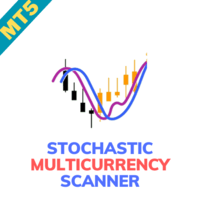
The Stochastic Multicurrency Scanner Dashboard MT5 is a powerful tool for monitoring multiple currency pairs and timeframes using the Stochastic oscillator. It organizes signals in a grid format, displaying each symbol’s status across timeframes from M1 to MN1. Traders can enable or disable specific timeframes to suit their strategies. You can find the MT4 version here Stochastic Oscillator Multicurrency Scanner MT5 For detailed documentation click here Stochastic Oscillator Integration: The
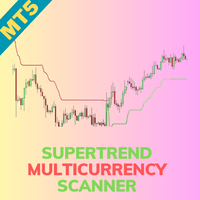
The Supertrend Multicurrency Scanner Dashboard MT5 is a powerful tool designed to monitor multiple currency pairs and timeframes using the Supertrend indicator. It organizes signals in a grid format, displaying each symbol’s trend status across timeframes from M1 to MN1. Traders can enable or disable specific timeframes to align with their strategies. You can find the MT4 version here Supertrend Multicurrency Scanner MT4 For detailed documentation click here Supertrend Integration: The d

Introducing the Ultimate Automated Trading Expert Advisor XAUUSD M1 Take your trading to the next level with our highly advanced Expert Advisor (EA) for MetaTrader 5. Designed for traders seeking an automated, precise, and efficient trading experience, this EA harnesses the power of sophisticated algorithms and technical analysis to help you maximize potential returns while reducing the manual work involved in trading. The automated trading expert Phantom Scalper EA is specifically designed for
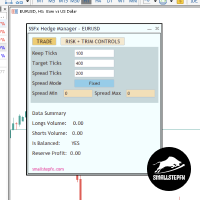
Simplify Trade Management with the SSFx Hedge Manager
The SSFx Hedge Manager is a robust Expert Advisor (EA) designed to streamline your trading experience by managing open positions through smart hedging techniques. It uses profits from winning trades to close out losing ones gradually, helping you minimize losses and maximize overall efficiency. Whether you're a seasoned trader or a beginner, this EA makes trade management seamless and stress-free. Key Features Automated Hedging :
The EA acti

Minic concept is a simple implementation of the ICT silver Bullet strategy. The strategy is intend for traders with a fair understanding of the time-based algorithmic model that involves catching trade entries within specific one-hour intervals during the trading day using Smart Money Concepts like liquidity and fair value gaps. Feel free to try and customize my bot. The AM session Silver Bullet (10:00 AM – 11:00 AM) The PM session Silver Bullet (02:00 PM – 03:00 PM) The London Ope

The " Trends Analyzer " is an advanced MQL5 script tailored for both manual and automated trading strategies. It provides comprehensive market trend analysis, real-time insights, and the capability to execute algorithmic trades based on predefined rules. Designed for traders and analysts, it serves as a versatile tool for monitoring, logging, and acting on market trends.
Key Features: Data Logging: Collects and logs key market metrics (Open, High, Low, Close prices, Volume) in a CSV file for
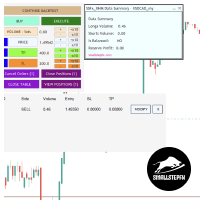
SSFx Ultimate Hedge Manager EA Description:
The SSFx Ultimate Hedge Manager EA is the pinnacle of trade management tools for the MT5 platform. Combining the advanced trade management features of the SSFx Hedge Manager EA with the comprehensive backtesting capabilities of the SSFx Manual Backtester, this ultimate product empowers traders to refine and optimize their strategies with unmatched flexibility. This EA focuses on a hedging-based approach to risk management, providing traders with a dyn

DeepRL AI Frontier v1.00 Deep Reinforcement Learning-Based Trading Algorithm.
Before using this Expert Advisor (EA), it is essential that you fully understand the following important information. Please take the time to read the description. Overview DeepRL AI Frontier framework was initially developed for institutional use, due to its advanced AI-driven framework and the ability to adapt to complex market dynamics , designed to meet the high-performance standards required by professional tra

Momo botbot is an automated trading bot designed to maximize profit potential in Forex trading, specifically for the EUR/USD currency pair. The bot operates based on a smart combination of technical indicators and an advanced averaging strategy, with a focus on the 5-minute timeframe (M5). Key Advantages: Advanced Technology: Combines precise data from multiple technical indicators for accurate market analysis and optimal trade execution. Sophisticated Averaging Method: Enables smart risk manag

This expert use grid and advanced DCA and martingale strategy. The strategy used by Fund Manager by our country. Use only pair AUDCAD, with timeframe H4 it can survive 2015-Nov 2024. For the last 2 years timeframe M30 have lowest drawdown. You can use it on M5.
It works well in other Pairs in H4 : EURNZD, EURGBP, EURCAD
Use proper money management, use money that you can loose, withdraw your profit. This strategy can make good profit if you use good money management. Use the balance minim

Bober Lazer : bot Breakout pour les échanges de crypto et le forex.
Libérez la puissance du trading de précision avec Bober Lazer, votre solution de rupture spécialisée pour les marchés des contrats à terme et des changes cryptographiques.
Optimisé pour les actifs volatils tels que l'ETHUSDT , ce bot a affiché d'excellentes performances en temps réel sur des plateformes comme Binance, OKX et Bybit. Sur les comptes suivis récemment, une croissance supérieure à 1 300 % a été observée en

Description:
This indicator adds customizable buttons for symbols (currency pairs) and timeframes directly onto the chart. It allows traders to quickly switch between different symbols and timeframes by simply clicking on the respective buttons. The indicator also includes a toggle button to show or hide all the symbol and timeframe buttons, providing flexibility in chart customization. Key Features: Symbol Buttons: Automatically generates buttons for symbols from the Market Watch or allows man

Time Open Close EA / Seasonal Day
Der EA kann um 21 Uhr und 52 Minuten eine Position open.
Die Uhrzeit und die Minuten sind getrennt einstellbar.
Der EA kann um 22 Uhr und 15 Minuten die Position close.
Die Uhrzeit und die Minuten sind getrennt einstellbar.
Sell oder Buy der Position kann eingestellt werden.
Die Größe der Position kann eingestellt werden.
Die Position hat einen Stop Los und einen Take Profit. Die Wochentage sind einstellbar.

O IKARUSS Autotrader é o robô especialista em trade em minidólar WDO na bolsa brasileira B3. Com uma estratégia única, o robô opera a cada hora nas melhores direções do mercado.
O robô já é configurado para o minidólar em timeframe M5. O robô tem alvos maiores fixos, mas abre e fecha operações a cada hora.
Ainda é possível configurar um trailling stop por horário e tamanho de alvo, bem como configurar horários de trades.
OBS: alterar o parâmetro BR1 para BR.

O Alexxander Autotrader é seu robô especialista em trade em minidólar WDO na bolsa brasileira B3.
Com estratégia única, o robô já está configurado para operar minidólar na abertura do pregão, operando em fechamentos de gaps principalmente.
O robô também pode ser otimizado para operar além do horário de abertura. Alem disso, o robô pode ser configurado com trailling stop, horários de trades e tipo de stop, se fixo ou dinâmico.
OBS: alterar o parâmetro BR1 para BR.
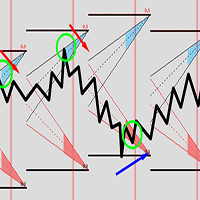
This Ribbon graphical template helps to identify potential turning points. Statistically, it's rare for price to push down and continue before the red buy zone or push up and continue before reaching the top blue sell zone. These zones serves as potential entry areas. Even if price does intend to go lower, it's usually some upside first. Vice versa for selling. Even if price does hit 2-3 consecutive zones in a row, the likelihood of price turning becomes much stronger. A great way of filtering o

Note = After the purchase please send me a private message to receive the set file. FCK Emperor EA is best for session's high-low break trading strategy. Option shows for trading. Note = After the purchase please send me a private message to receive the set file. Common set file available in comments. Connect with other traders by joining our MQL5 community of over 390 members. Stay up to date with the latest product updates, tips, and exclusive content. FCK Emperor EA stands o

The Band Theory EA is a cutting-edge automated trading solution, meticulously crafted for traders who seek to capitalize on market movements using Bollinger Bands and Moving Averages . Combining advanced risk management, session filters, and smart money management, this EA is designed to deliver consistent results while safeguarding your capital. Key Features Core Strategy Bollinger Bands Integration : Detect volatility and trend reversals with precision. The EA leverages the upper, middle, and

Hi Traders. Lot - lot size for pending orders. Martingale - change lot size of pending orders. Take Profit - profit in points and auto tp in input edit. Stop Loss - loss in points. and you can open order BUYLIMIT, SELLLIMIT you can Close Pending, Close orders Profit and Close All *** Guide: https://youtu.be/fBhdutbZq7g
if you have a problem you can contact me all time. Please Ratings and Reviews.
Thanks Traders. ENJOY.

EchoTrade Pro: The Ultimate MT4/MT5 Trade Copier
FREE DEMO & INSTALLATION GUIDE
Take Charge of Your Trades with Unmatched Flexibility and Risk Management
EchoTrade Pro is your ultimate companion for seamless trade copying between MetaTrader 4 and MetaTrader 5. Designed for traders who demand precision, control, and efficiency, this local copier is packed with customizable features to match any trading strategy or style.
Key Features: - Daily Risk Control: Set daily trade caps, l

Golden Portal EA - XAUUSD Expert Advisor
Débloquez le potentiel de l'or avec des trades à faible risque et haute récompense
Ce **Expert Advisor** (EA) de pointe est conçu pour faire briller vos transactions XAUUSD, que vous soyez en train de faire du scalping pour des profits rapides ou de vous positionner pour des swings à plus long terme. Avec un accent sur la croissance constante et des stratégies à faible risque, **Golden Portal EA** est parfait pour les traders qui veulent profiter de la

Ce robot de trading automatique est un outil puissant et flexible, conçu pour les traders souhaitant opérer avec précision, sécurité et efficacité sur n'importe quel marché financier. Avec une large gamme de fonctionnalités configurables, il permet d'exécuter des stratégies sophistiquées tout en gardant un contrôle total sur les entrées, les sorties et la gestion des risques. Fonctionnalités principales : Gestion de l’exposition et des urgences : Verrouillage manuel de l'exposition :

Indicators Tracking for Trader Sale on MT5 The Indicators Tracking feature in MetaTrader 5 (MT5) is an essential tool for traders looking to optimize their sales and decision-making processes. This functionality allows traders to monitor key market metrics and analyze trends effectively, enhancing the accuracy of trade executions and strategy adjustments. Key Features: Real-Time Market Monitoring :
Track live data across various markets, including forex, stocks, and commodities, with indicators

A - Genesis: Redefining Trading Efficiency and Precision Genesis is a cutting-edge trading panel crafted to empower traders with unmatched precision and versatility. Featuring two graphical modes : the Main Window Graph offers a comprehensive view of the market's dynamics, while the Sub Window Graph provides a focused analysis of specific indicators and patterns. This dual-mode visualization enables traders to switch seamlessly between a macro and micro perspective of the market, ensuring they

redo the translation in koreean , french , italian and turkish Of course! Here are the translations for Korean, French, Italian, and Turkish: Korean TradeTech Titan 전문가 조언자(EA)는 다양한 표준 지표 세트를 활용하여 거래를 시작합니다. 거래 조건이 충족되면 최적의 진입점을 보장하기 위해 추가적인 조정 가능한 필터 또는 임계값 레이어가 적용됩니다. 이러한 임계값은 1에서 100까지 조정 가능하여 맞춤형 거래 필터링을 제공합니다. 모든 거래는 가상 StopLoss 및 가상 TakeProfit 값으로 보호됩니다. EA는 마팅게일 시스템 또는 로트 크기 증가와 같은 위험한 전략을 피하고, 한 번에 하나의 주문만 열어 통제된 측정 거래를 보장합니다. 사용된 지표에는 Accelerator Oscillator, Adaptive Moving Average, Aw

HFT ZONE MOMENTUM RECOVERY
EA_Name ค่า: HFT MTRADER ใช้สำหรับระบุชื่อของ EA เพื่อให้ง่ายต่อการจัดการหรือตรวจสอบในประวัติการเทรด (History) Lot_fix ค่า: 0.02 ใช้กำหนดขนาดของล็อตคงที่ (Fixed Lot Size) ที่ EA จะเปิดในแต่ละคำสั่งเทรด โดยไม่ขึ้นอยู่กับเงื่อนไขอื่น ๆ Lots_X ค่า: 1.5 ตัวคูณล็อต (Lot Multiplier) ซึ่งมักใช้ในการเพิ่มขนาดล็อตในลักษณะการ Martingale หรือ Hedging โดยเมื่อขาดทุนหรือเปิดคำสั่งถัดไป ระบบจะเพิ่มล็อตตามค่าที่กำหนดไว้ High_Low_end_candle ค่า: 10 จำนวนแท่งเทียนที่ใช้ในการคำนวณระ

The best way to place and close trades using your keyboard. Perfect for Scalpers, sniper entries.
The default keys are as follows: 8= Buy (Lots set by user) 5= Sell (Lots set by user)
9= Closes All Buy Positions 6= Closes All Sell Positions 2= Opens a Sell and a Buy position instantly.
0= CLOSES All Positions //These are the default keys, can be changed upon request.

Version MT4 : https://www.mql5.com/en/market/product/127793 Version MT5 : https://www.mql5.com/en/market/product/127794 Signal en direct : https://www.mql5.com/en/signals/2281945
« Gold Breakout » est un Expert Advisor (EA) premium spécialement conçu pour capitaliser sur les fluctuations du cours de l'or grâce à une stratégie de cassure à partir d'un prix et d'une période spécifiques.
Combiné à une gestion avancée du risque de commutation, cet EA offre une solution automatisée aux traders à l
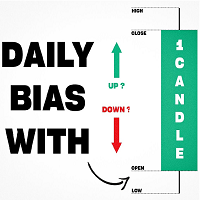
Inspired by TTrades video on daily bias, this indicator aims to develop a higher timeframe bias and collect data on its success rate. While a handful of concepts were introduced in said video, this indicator focuses on one specific method that utilizes previous highs and lows. The following description will outline how the indicator works using the daily timeframe as an example, but the weekly timeframe is also an included option that functions in the exact same manner.
On the daily timefr

Explosive Breakout Hunter est un Expert Advisor (EA) conçu pour maximiser les profits en capturant des cassures puissantes. Avec un taux de réussite d’environ 50 % et seulement quelques entrées par mois, cet EA privilégie la qualité plutôt que la quantité.
Il attend patiemment les meilleures opportunités et accumule des gains importants de manière régulière. Découvrez le potentiel de cet EA en consultant les résultats des backtests dans les captures d’écran.
N’hésitez pas également à essayer la

Copy trading has never been easier! Our MT5 Copy Trade Tool is designed to seamlessly duplicate trades across multiple accounts, whether you're a signal provider or a follower. With real-time synchronization, customizable risk management options, and lightning-fast execution, this tool empowers you to maximize profits effortlessly. Trade Copier with Dual Functionality: Master and Slave in a Single EA

Unlock Stable Long-Term Growth with Our Expert Advisor
Hello! We’re a dedicated team of experienced traders and developers with over a decade of combined expertise in the forex markets. After working with numerous EAs and encountering common pitfalls, we leveraged our skills in data analysis, statistics, and software development to create a reliable trading tool. Introducing MultiCurrency_LinearEA—designed to enhance your trading strategy while prioritizing the safety and growth of your account.

The Market Heart indicator scans market entries after high volatility is noticed. Most big moves occur a short time after market volatility. Most big moves occur a short time after market volatility. The idea is to look for entries after the rectangles form and not necessarily as trade entry signals. . For example, you could use the Retracement Feeder indicator that generates arrow signals.
Market Heart MT4 Version
How to use: 1. Primary use The White Box is the first to be formed an

Bullish AI Trader EA – Advanced AI-Powered Trading for MetaTrader 5 (MT5) Limited Time Offer: Only 10 Products Left at $189!
Once these are gone, the price will return to the standard price of $589. Unlock the power of artificial intelligence with the Bullish AI Trader , a cutting-edge Expert Advisor (EA) designed for MetaTrader 5 (MT5) . This EA offers a fully automated trading experience, harnessing advanced AI technology to make smart, data-driven decisions. Perfect for both new and experienc

Siciliano Gold , robot unico nel suo genere funziona solo timefrime di 1H , nessun sistema martigala e a griglia, che determino questi sistemi molto pericolosi che la maggior parte di expert advisor in circolazione sono cosi e alla fine di tutto finiscono di bruciare il proprio conto, questo invece no! Investimento minimo 100 $ Ovviamente funziona solo sul GOLD o XAU/USD come volete chiamarlo. Offro diversi servizi, provate la demo non ve ne pentirete, ovviamente è un robot di lungo termine. Pr

This Simple Smart Money Concepts indicator displays real-time market structure (internal & swing BOS / CHoCH), order blocks, premium & discount zones, equal highs & lows, and much more...allowing traders to automatically mark up their charts with widely used price action methodologies.
"Smart Money Concepts" (SMC) is used term amongst price action traders looking to more accurately navigate liquidity & find more optimal points of interest in the market. Trying to determine where institutional

EMA Cloud System is a Trading System Invented by Ripster where areas are shaded between two desired EMAs. The concept that the EMA cloud area serves as support or resistance for Intraday & Swing Trading. Can be utilized effectively on 10 Min for day trading and 1Hr/Daily for Swings. Ripster utilizes various combinations of 5-12 EMA clouds 34-50 EMA clouds among others. 8-9, 20-21 EMA clouds can be used as well. Adjust what works for you. Ideally 5-12 or 5-13 EMA cloud acts as sold fluid Trendli

L'outil ultime de trading par glisser-déposer pour la précision et la simplicité Dites adieu aux configurations de trading compliquées et aux calculs fastidieux. Avec cet Expert Advisor, vous pouvez calibrer votre risque une fois pour toutes, puis gérer facilement vos trades directement sur le graphique. Comment ça marche : Réglez une fois : Définissez votre pourcentage de risque souhaité. Choisissez si vous voulez ajouter une ligne de Take Profit. Décidez si vous souhaitez utiliser le prix actu

BTC EVOLUTION ================
The Ultimate Trading Companion: A Revolutionary Expert Advisor Built for Success Imagine an Expert Advisor (EA) that doesn't just trade for you—it thinks, adapts, and evolves with the market. Designed for traders who seek precision, control, and consistency, this EA integrates state-of-the-art algorithms with user-friendly features to deliver a truly superior trading experience. From robust trend-following strategies to intelligent money management, every componen

MA Scalper PRO: Your Trusted Partner for Precise and Profitable Scalping Welcome to MA Scalper PRO , the ultimate solution for traders seeking precision, speed, and profitability in the fast-paced world of scalping. This advanced Expert Advisor (EA) combines the power of moving averages with cutting-edge trading technology to create a seamless trading experience. Whether you're a beginner or a professional, MA Scalper PRO is engineered to elevate your trading to new heights. Unlock the Power of

Version MT4 : https://www.mql5.com/en/market/product/127890 Version MT5 : https://www.mql5.com/en/market/product/127891
Fisherman est un Expert Advisor (EA) avancé basé sur une grille conçu pour capturer systématiquement les mouvements de prix. Tout comme un pêcheur jetant un filet pour attraper du poisson, cet EA déploie une grille structurée d'ordres en attente pour maximiser les opportunités du marché.
L'EA fonctionne selon deux modes flexibles : 1. Mode automatique : l'EA ouvre de manière
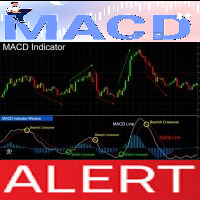
MACD Crossover with Alerts, Colored Histogram, and Zero Line Arrows Overview
The MACD Crossover Indicator is designed to help traders analyze trend direction and momentum shifts. This enhanced version of the classic MACD includes visual crossover markers, dynamic histogram coloring, and real-time alerts, offering a clear and structured approach to market analysis. Histogram color changes based on MACD position (above or below zero). Zero-line arrows for crossover points to highlight key trend
Le MetaTrader Market offre un lieu pratique et sécurisé pour acheter des applications pour la plateforme MetaTrader. Téléchargez des versions démo gratuites de Expert Advisors et des indicateurs directement depuis votre terminal pour les tester dans le testeur de stratégie.
Testez les applications dans différents modes pour surveiller les performances et effectuez un paiement pour le produit que vous souhaitez en utilisant le système de paiement MQL5.community.
Vous manquez des opportunités de trading :
- Applications de trading gratuites
- Plus de 8 000 signaux à copier
- Actualités économiques pour explorer les marchés financiers
Inscription
Se connecter
Si vous n'avez pas de compte, veuillez vous inscrire
Autorisez l'utilisation de cookies pour vous connecter au site Web MQL5.com.
Veuillez activer les paramètres nécessaires dans votre navigateur, sinon vous ne pourrez pas vous connecter.