Regardez les tutoriels vidéo de Market sur YouTube
Comment acheter un robot de trading ou un indicateur
Exécutez votre EA sur
hébergement virtuel
hébergement virtuel
Test un indicateur/robot de trading avant d'acheter
Vous voulez gagner de l'argent sur Market ?
Comment présenter un produit pour qu'il se vende bien
Expert Advisors et indicateurs pour MetaTrader 5 - 121

1. Why did I develop this series of indicators
I found that most traders need to use multiple time frame indicators. They usually switch time frame to see indicators. However, once the timeframe is switched, you cannot see the corresponding relationship between the price in the smaller timeframe and the indicator in the larger timeframe . For example: if your price chart is in H1 timeframe, you can see H4, D1 and W1 indicators in H1 timeframe Chart. This is more helpful for you to find t

The RiseTrading is a unique High quality and easy to use and affordable trading tool because we have incorporated a number of proprietary features and MACD and Stochastic indicators. The main advantages of the trend trading strategy used by the Expert Advisor are opening positions only in the direction of a trend, ability for the long-term retention of profitable positions allowing users to achieve good combinations of profit/loss distributions. That can work on a real account at any broker with

1. Why did I develop this series of indicators
I found that most traders need to use multiple time frame indicators. They usually switch time frame to see indicators. However, once the timeframe is switched, you cannot see the corresponding relationship between the price in the smaller timeframe and the indicator in the larger timeframe . For example: if your price chart is in H1 timeframe, you can see H4, D1 and W1 indicators in H1 timeframe Chart. This is more helpful for you to find t


Just $10 for six months!!!. This will draw Supply & Demand zones just by clicking on a candle. It can also draw a 50% line on the zone. https://youtu.be/XeO_x7cpx8g As a drawing tool, it is not active all the time after adding it to the chart.
Activate by pressing 's' twice on the keyboard within a second. If activated but then decided not to draw, deactivate by pressing 's' once. Box color depends if candle is above or below current price.
Features: Draw the box up to the last current can

Panthers Traders presents the new Expert Advisor "MRK TRADER", a robot for Forex, Indices, Commodities and Cryptocurrencies. This expert advisor works hedge strategies, has different variables to configure each other, works as a work tool or as a 100% automatic expert advisor, if you do not have experience, for your greater profitability, get in touch by private and I will explain your different variables and how to apply them in different assets, I recommend watching the videos of the YouTub

Backtest from 2003-2019 MetaQuotes Data Every Tick Mode
EA created for EURUSD H1
Open transaction based on MA and Volume
Close transaction based on RSI or take profit
One transaction at the time.
No adding position, no martingale, no grid.
My recommendations: For "safe mode" i recommend 0.1 lot per 10000USD
For "risky mode" i recommend 0.5 lot per 10000USD
Personally i use 0.3 lot per 10000 USD
Fell free to increase lot size while you earn.
This EA does not open transaction e

The Rise of Skywalker: It is an advanced trading system. This is a fully automatic Expert Advisor, which allows you to presize the trade according to the preferences of the trader. Is a revolution in the customization of the trading. The Rise of Skywalker is a expert advisor based in the indicator The Rise of Sky walker: ( https://www.mql5.com/es/market/product/44534 ) This system uses only one trade in each operation. Do not use Grip or martingale Low risk system since it h

The indicator for trading on the signals of the harmonic pattern AB=CD. It gives signals and shows the levels of entry into the market, as well as levels for placing stop orders, which allows the trader to make timely decisions on entering the market, as well as effectively manage positions and orders. It supports sending push notifications to a mobile device, e-mail, as well as alerts. This indicator has been ported from the version for MetaTrader 4. For more information, as well as a detailed
Rectangle Detector Alert
About Rectangle Detector Alert Indicator
Rectangle detector alert detects manually drawn rectangle shapes on charts and sends out push notifications
also auto extending the rectangles at the same time as new candles form.
The concept behind this indicator is based on the manual trading of supply and demand zones. Most traders prefer
to draw their supply (resistance) and demand (support) zones manually instead of depending on indicators to auto draw
the

This product is a set of tools that help the trader to make decisions, bringing information from different categories that complement each other: trend, support / resistance and candle patterns. It also has a panel with information about the balance. The trend has two different calculations and is shown as colored candles. Strategy 1 is longer, having 3 different states: up, down and neutral trend. Strategy 2 has a faster response and has only 2 states: up and down trend. Support and resistance

The main idea of this product is to generate statistics based on signals from 5 different strategies for the Binary Options traders, showing how the results would be and the final balance based on broker's payout.
Strategy 1: The calculation is secret. Strategy 2: The signal is based on a sequence of same side candles (same color). Strategy 3: The signal is based on a sequence of interspersed candles (opposite colors). Strategy 4: The signal consists of the indicators bollinger (we have 3 typ

Versão Darkray para Bolsa de Valores (Ações, Fundos Imobilirários, contratos futuros, etc.) O Robô DarkrayB3EA usa uma estratégia baseada no retorno a média, conjugada a detecção de zonas de exaustão de compra e de venda. Indicadores disponíveis para configurações de setups: EMA200 à Média móvel de 200 períodos (podem ser usados outros períodos com ótimos resultados também); RSI à Verifica os níveis de sobre venda para abertura das vendas e sobre compra para abertura das compras; ADX à Veri
This indicator measures the largest distance between a price (high or low) and a moving average. It also shows the average distance above and below the moving average. It may come in handy for strategies that open reverse positions as price moves away from a moving average within a certain range, awaiting it to return so the position can be closed. It just works on any symbol and timeframe. Parameters: Moving average period : Period for moving average calculation. Moving average method : You can

The Candlestick Patterns indicator for MT5 includes 12 types of candlestick signales in only one indicator. - DoubleTopsAndBottoms - SmallerGettingBars - BiggerGettingBars - ThreeBarsPlay - TwoBarsStrike - Hammers - InsideBars - OutsideBars - LongCandles
- TwoGreenTwoRed Candles - ThreeGreenThreeRed Candles The indicator creats a arrow above or under the signal candle and a little character inside the candle to display the type of the signal. For long candles the indicator can display the exac

Walking Pips is a scalping Expert Advisor designed to work in a volatile market. It is suitable for working with any brokers, including American brokers, requiring FIFO to close primarily previously opened transactions. All orders are accompanied by a virtual stop loss and take profit in pips, and there are also breakeven and trailing stop functions. The chart displays information on the speed of order execution and slippage. Advisor does not use martingale or grid. The EA does not depend on the
FuturesBot NQ100 Advisor works only on NETTING accoun ts!
Trading Advisor " FuturesBot NQ100 "is intended solely and exclusively for trading futures on the CME Group exchange
Advisor is adapted for trading futures contracts: - E-mini Nasdaq-100 Futures
- micro E-mini Nasdaq-100 Future
The specification of the E-mini Nasdaq-100 Future contract is available at the following link on the exchange website:
https://www.cmegroup.com/trading/equity-index/us-index/e-mini-nasdaq-100_contract_sp
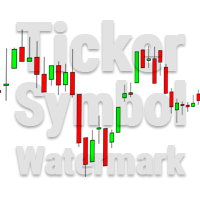
This utility tool draws the ticker symbol and timeframe information as a watermark in the background of the chart. It may come in handy if you have multiple charts on the screen at the same time. Inputs: Font Name: You can change text font by typing in the name of your favorite font installed on your operating system. (e.g.: Verdana, Palatino Linotype, Roboto, etc...) Font Color: You can choose your favorite from the available colors or type in a custom RGB color (values from 0 to 255, e.g.:

mql4 version: https://www.mql5.com/en/market/product/44606 Simple indicator to calculate profit on fibonacci retracement levels with fixed lot size, or calculate lot size on fibonacci levels with fixed profit. Add to chart and move trend line to set the fibonacci retracement levels. Works similar as default fibonacci retracement line study in Metatrader. Inputs Fixed - select what value will be fix, lot or profit Fixed value - value that will be fix on all levels Levels - levels for which

*Non-Repainting Indicator Arrow Indicator with Push Notification based on the Synthethic Savages strategy for synthethic indices on binary broker.
Signals will only fire when the Synthethic Savages Strategy Criteria is met BUT MUST be filtered.
Best Signals on Fresh Alerts after our Savage EMA's Cross. Synthethic Savage Alerts is an indicator that shows entry signals with the trend. A great tool to add to any chart. Best Signals occur on Fresh Alerts after our Savage EMA's Cross + Signal

Horizontal Volumes Indicator - using a histogram, displays the volume of transactions at a certain price without reference to time. At the same time, the histogram appears directly in the terminal window, and each column of the volume is easily correlated with the quote value of the currency pair. The indicator practically does not require changing the settings, and if desired, any trader can figure them out.
The volume of transactions is of great importance in exchange trading, usually an in

Trend indicator Carina . The implementation of the trend indicator is simple - in the form of lines of two colors. The indicator algorithm is based on standard indicators as well as our own mathematical calculations. The indicator will help users determine the direction of the trend. It will also become an indispensable adviser for entering the market or for closing a position. This indicator is recommended for everyone, both for beginners and for professionals.
How to interpret information f
This app supports customer investments with equipment financing and leasing solutions as well with structured chat Our success is built on a unique combination of risk competence, technological expertise and reliable financial resources.
Following topics are covered in the Trading Support Chat -CUSTOMISATION -WORKFLOW -CHARTING TIPS -TRADE ANALYSIS
PLEASE NOTE That when the market is closed, several Brokers/Metatrader servers do not update ticks from other timeframes apart from the current

Night Scalper is a scalping system for working in a calm market at night. Does not use martingale or grid. Suitable for all brokers, including American brokers with FIFO rules. All orders are accompanied by a virtual stop loss and take profit in pips, the values can be either fixed or dynamic. It also has a virtual trailing stop and breakeven. The chart displays information on the speed of order execution and slippage.
MT4 version link The advisor provides protection:
The EA will stop losi

KT Power Pennant finds and marks the famous pennant pattern on the chart. A pennant is a trend continuation pattern with a significant price movement in one direction, followed by a period of consolidation with converging trend-lines.
Once a pennant pattern is formed, a buy/sell signal is provided using a bullish or bearish breakout after the pattern formation. MT4 Version is available here https://www.mql5.com/en/market/product/44713
Features
Pennant patterns provide a low-risk entry aft

The Rise of Sky walker is a trend indicator is a powerful indicator for any par and any timeframe. It doesn't requires any additional indicators for the trading setup.The indicator gives clear signals about opening and closing trades.This Indicator is a unique, high quality and affordable trading tool. Can be used in combination with other indicators Perfect For New Traders And Expert Traders Low risk entries. Never repaints signal. Never backpaints signal. Never recalculates signal. Great Fo

RageX EA is an unique fully automated EA which analyses current market trend on time-frame basis. Thanks to that it makes performance of this EA stable regardless the current market condition like slippage, execution speed, etc. Every order is protected by automatically calculated stop-loss. RageX EA successfully passed 100% quality data back-tests in Metatrader 5 with different execution speed as well as back-tests with 99.90% quality historical data and variable spread in Metatrader 4. Link

Introduced expert system works with the EURUSD currency pair and only with it. This system implemented the principle of five orders - that is, a maximum of five orders can be placed in one direction, after which the total position of the series should be closed by stops, either real or virtual. The trading system is designed to work separately with a series of buy orders and separately with a series of sell orders. which makes the trading system versatile enough. The expert passes all types o

KT Stochastic Divergence robot is a 100% automated expert advisor that trades regular and hidden divergence built between the price and Stochastic oscillator. The divergence signals are fetched from our freely available Stochastic Divergence indicator.
Not every divergence ends up in a successful price reversal, that's why this ea combines the raw divergences signals with its inbuilt technical analysis module to exploit the price inefficiency that occurs after some selected divergence signals

KT RSI Divergence robot is a 100% automated expert advisor that trades regular and hidden divergence built between the price and Relative Strength Index (RSI) oscillator. The divergence signals are fetched from our freely available RSI divergence indicator.
Not every divergence ends up in a successful price reversal, that's why this ea combines the raw divergences signals with its inbuilt technical analysis module to exploit the price inefficiency that occurs after some selected divergence si

Powerful trend indicator provided with all necessary for trade and it is very easy to use. Everyone has probably come across indicators or Expert Advisors that contain numerous input parameters that are difficult to understand. But here, input parameters are simple and it is no need to configure anything — neural network will do all for you.
Difference from a classic version
The real-time multi time frame panel is added, so you can check a trend for other timeframes without switching the sche

The Breakout Box for MT5 is a (opening) range breakout Indicator with freely adjustable: - time ranges - end of drawing time - take profit levels by percent of the range size - colors - font sizes It can not only display the range of the current day, but also for any number of days past. It can be used for any instrument. It displays the range size and by request the range levels and the levels of the take profit niveaus too. By request it shows a countdown with time to finish range. The indic

- This is an indicator of directional movement that allows you to determine the trend at the time of its inception and set the levels of a protective stop.
Trailing can be carried out both from below, when the stop level is below the current price and is pulled up behind the price if it increases, and above, when stop levels are above the current price.
Unlike trailing with a constant distance, the stop level is set at the lower boundary of the quadratic regression channel (in the case of t

The adviser uses a strategy based on the use of custom indicators; trading is carried out on 4 time frames. The expert uses the adaptive system for determining market entries for trading, which determines the most appropriate moment for opening an order. The adviser trades according to numerous patterns on currency pairs. The adviser uses economic news to achieve more accurate signals. Hidden Stop loss, Take Profit, Break Even and Trailing Stop are used. Use multicurrency testing for 11 currency
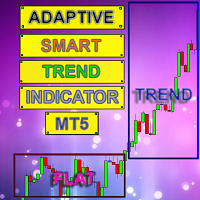
Smart indicator Adaptive Smart Trend Indicator determines the sectors of the Trend and the Flat and also in the form of a histogram shows the breakdown points of the levels (1 - 5).
The indicator performs many mathematical calculations to display more optimal Trend movements on the chart.
The program contains two indicators in one: 1 - draws the Trend and Flat sectors, 2 - the histogram indicator shows the best signals for opening an order. The indicator autonomously calculates the mo
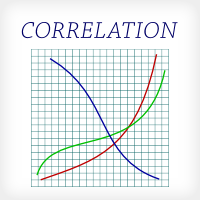
This indicator is fully user-adjustable, calculates corellation between all symbols, which you want. Indicator is real-time updated and fully automated. You can adjust a lot of parameters.
Calculation Parameters List of symbols: write all symbol, which you want to calculate, just separate them by comma Calculated bars: amount of bars from which will be calculated Time frame: time period of calculation Used price: used price - 0 (CLOSE), 1 (OPEN), 2 (HIGH), 3 (LOW), 4 (MEDIAN), 5 (TYPICAL), 6

Crossing of market price and moving average with all kinds of alerts and features to improve visualization on the chart.
Features Crossing of market price and Moving Average (MA) at current bar or at closing of last bar; It can avoid same signals in a row, so it can allow only a buy signal followed by a sell signal and vice versa; MA can be set for any of the following averaging methods: Simple Moving Average (SMA), Exponential Moving Average (EMA), Smoothed Moving Average (SMMA), Linear-w
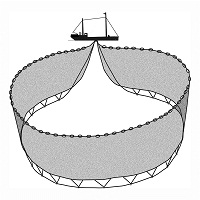
Dragnet mt5 Fully automated trading robot. Doesn't use indicators, constantly market. Analyzes the current open positions to make trading decisions. There is no martingale, no increase in trading lots. Description of settings Count_All - number of positions for total profit Lot - position volume, if = 0, the Risk parameter works Risk - automatic lot calculation from the trading account balance TakeProfit - profit level of a single position Steps - step between positions ProfitTarget - total pr

Every trader knows that he or she should never Risk more than 2% (or 5%) per trade. This is a Money Management law and an usable LotSize should be calculated each time because a trader must use a different StopLoss value for different Support and Resistant level. This indicator will calculate an appropriate LotSize for the moment when you will put it on the chart and each time you will drag the "Stop Loss Line" in any direction.
Inputs: Order_Type - Buy or Sell TakeProfitPoints - how many p

The VMA is an exponential moving average that adjusts its smoothing constant on the basis of market volatility. Its sensitivity grows as long as the volatility of the data increases. Based on the Chande's Momentum Oscillator, the VMA can automatically adjust its smoothing period as market conditions change, helping you to detect trend reversals and retracements much quicker and more reliable when compared to traditional moving averages.
RSI Swinger
Do you want to maximize your trading profits while minimizing your risk exposure and time spent analyzing technical indicators? The RSI Swinger Expert Advisor is the perfect solution for you. By relying on the powerful RSI indicator to identify price swings, this fully customizable EA can help you achieve your trading goals in a risk-averse manner, even if you're not a technical analysis expert. With the RSI Swinger, you can easily configure the RSI ceiling and floor values to suit
Don't need to calculate your position size anymore. Set the Risk size in % (based on your balance) and then locate your StopLoss level of your would-be position and your trade will be executed with the proper position size. You have the chance to close all your floating positions on the instrument you are currently on by clicking on the "CLOSE" button.
How to use? Attach the expert to the chart and set its parameters. Click on the STOP button and locate the horizontal line to your would-be Sto
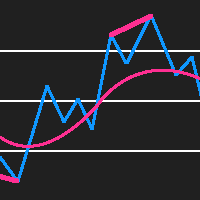
RSI Divergence Detector is an RSI indicator which also detects divergences and plots arrows and trend lines on the chart where you should buy and sell. Please note that this indicator provides 5 buffers and doesn't repaint making it an exceptional indicator for Expert Advisors. The indicator also provides alerts. Buffer 0 = RSI Buffer 1 = Buy Buffer 2 = Sell Buffer 3 = RSIGradient Buffer 4 = PriceGradient
NON REPAINTING
DIVERGENCE DETECTION

IlanisNeuro MT5 - expert variation Ilanis . The expert Advisor uses averaging. A neural network is used to open positions. The network was trained on seven major currency pairs (EURUSD, GBPUSD, AUDUSD, NZDUSD, USDJPY, USDCHF, USDCAD) in the interval 2010-2019. Compared to the MT4 version , the expert Advisor was able to multi-currency trading from a single chart and was retrained on fresh data. Version monitoring for МТ4: https://www.mql5.com/en/signals/339250 Free version: https://www.mql5.c

Smart YTG mt5 Expert Advisor for the MT4 terminal Smart YTG was written to work on the GBPUSD and EURUSD currency pairs, chart period H1. In essence, the system is trending and works perfectly on trend sections of price movement with STOP orders, the trend is determined by analyzing the Price Channel indicator built into the inside of the Expert Advisor; there is no need to additionally install the indicator. In the flat areas, when the market is indecisive and the further movement of the ma
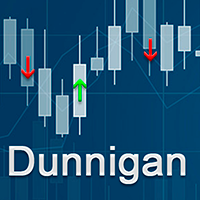
This is a trend indicator based on a strategy created by William Dunnigan that emit signals to buy or sell on any timeframe and can assist in decision making for trading on stock market or Forex. The signals are fired according to the following rules: Buy Signal = Fired at the first candlestick in which close price is higher than the higher price of the last candlestick. The higher and lower prices of the current candlestick must be higher than the corresponding ones of the last candlestick as w
Présentation de l' Awesome Oscillator Alert , un puissant indicateur technique qui fournit aux traders des informations précieuses sur la dynamique du marché et les opportunités de trading. Avec ses fonctionnalités complètes et son interface conviviale, cet indicateur est un outil essentiel pour les commerçants qui cherchent à gagner un avantage sur le marché.
L'une des caractéristiques les plus remarquables de l'Awesome Oscillator Alert est sa compatibilité avec toutes les paires de devi

Hello my friends. This Expert Advisor is based on Ichimoku Kinko Hyo and Heiken_Ashi indicator. The input parameters are optimized for EURCAD H1. - magics = magic number - Lots = Lots - CloseMethod = Method to Close order - TP-SL-TSL (if set SL and TP = 0 it will open and close by signal) - MartinBuyOrSell = Open and Martingale oneway - MartinBuyandSell = Open and Martingale twoway - TP = take profit (point) - SL = stoploss (point) - tsl = trailing stop - martin_Plus =

Candlestick Patterns MT5 is a simple and convenient indicator able to define 29 candle patterns.
Advantages Defines and highlights 29 candle patterns; Estimated trading direction is shown as an arrow; Each candlestick pattern can be disabled in the settings; The indicator can be used as an arrow indicator in EAs.
Parameters TextSize - chart text size; TextColor - chart text color; Alert - enable/disable alerts; ---------- Candlestick Patterns ------------- - settings separator; AdvanceB

KT CCI Surfer uses a mean reversion trading strategy with a combination of extreme overbought/oversold zone detection using the Commodity Channel Index (CCI). Developed by Donald Lambert in 1980, CCI is a leading indicator that helps to identify the overbought/oversold region in the market without any lag.
Obviously, not every overbought/oversold signal turns out into a price reversal. However, when combined with a well-planned mean reversion strategy, it produces excellent results.
Recomme
Découvrez comment acheter un robot de trading sur le MetaTrader Market, le magasin d'applications de la plateforme MetaTrader.
e système de paiement de MQL5.community prend en charge les transactions via PayPal, les cartes bancaires et les systèmes de paiement populaires. Nous vous recommandons vivement de tester le robot de trading avant de l'acheter, pour une meilleure expérience client.
Vous manquez des opportunités de trading :
- Applications de trading gratuites
- Plus de 8 000 signaux à copier
- Actualités économiques pour explorer les marchés financiers
Inscription
Se connecter
Si vous n'avez pas de compte, veuillez vous inscrire
Autorisez l'utilisation de cookies pour vous connecter au site Web MQL5.com.
Veuillez activer les paramètres nécessaires dans votre navigateur, sinon vous ne pourrez pas vous connecter.