Regardez les tutoriels vidéo de Market sur YouTube
Comment acheter un robot de trading ou un indicateur
Exécutez votre EA sur
hébergement virtuel
hébergement virtuel
Test un indicateur/robot de trading avant d'acheter
Vous voulez gagner de l'argent sur Market ?
Comment présenter un produit pour qu'il se vende bien
Nouveaux Expert Advisors et indicateurs pour MetaTrader 5 - 94

UPDATE v1.0 IS OUT - PLEASE READ ALL THE DESCRIPTION BEFORE USE IT "like all expert advisors, LL Magnetic EA works for you, but you can't always leave it alone. use it with care and attention, choose a time slot and decide your money management first. the best results are obtained by using with care, avoiding important news that generate large movements and keeping the EA off on high volatility days. the key to success is always the management of your tools, remember that" L.Licari LL Magnetic

Neural Bands is a scalping indicator. There are 2 different deviation bands for oversold and overbought levels. Color candles are to determine the trend if it passes the deviations and is showing a strong trend or if the color candles stop at the deviations and revert back to the mean. This indicator is a type of regression indicator trading ranges and breakouts in price. 15 min charts and above recommended. TRADE WITH THE LARGER TREND DIRECTION

The Expert Advisor is real trading strategy that does not use any grids, martingales or other dangerous functionalities. The EA has been developed for GBPJPY M15 based on Range Breakout. It has been backtested on tick data with 100% quality of modeling. There is no need to set up any parameters, all settings are already optimized and fine-tuned.
FX Blue - find strategy with magic number # 225108 I recommend you always do your own testing with your broker. My recommendation is to have a l

The Expert Advisor is real trading strategy that does not use any grids, martingales or other dangerous functionalities. The EA has been developed for GBPJPY M15 based on Range Breakout. It has been backtested on tick data with 100% quality of modeling. There is no need to set up any parameters, all settings are already optimized and fine-tuned. I recommend you always do your own testing with your broker. My recommendation is to have a look also on the rest of my products in the portfolio as
This expert advisor will help updating your stoploss when your trades are in profit. It will work on all open trades for the symbol it is attached with. It takes 2 input.
Recommended Settings:
For eur/usd,gbp/usd/usoil etc 1. Stop Loss Points: 50 2. Stop Loss Trigger Points: 100
For eur/usd,gbp/usd/usoil etc 1. Stop Loss Points: 500 means 0.5 usd or 5 pips 2. Stop Loss Trigger Points: 1000 means 1 usd / 10 pips
1. Stop Loss Points It is stop loss point, distance from current price to s
Dear trader, others have seen what is and asked why. We have seen what could be and asked why not. We present to you, The Sandman.
This is an MT5 scalping robot designed to give you a pleasant and simple trading experience. The market is chaotic and unpredictable. Even the most experienced traders get it wrong due to one reason or the other. We imagine it would be a liberating experience to have a robot that makes predictions and makes the bold moves in your stead. This was the very intent

Promotion actuelle : Plus qu'un seul à 549$ Prix final : 999$ NEW: Choose 1 EA for free! (for 2 trade account numbers) N'oubliez pas de jeter un coup d'œil à notre « Ultimate EA Combo Package » sur notre blog promotionnel !
LIVE SIGNAL
Bitcoin Scalp Pro est un système de trading unique sur le marché. Il se concentre entièrement sur l'exploitation de la volatilité du marché Bitcoin en négociant les cassures des niveaux de support et de résistance. L'EA se concentre sur la sécuri

Art of Scalper is a fully automated Expert Advisor that trades accurately and relies on price reversion. The EA trades using market orders and uses time averaging to improve performance. This EA works best on XAUUSD, GOLD and will also work on AUDUSD, GBPUSD, NZDUSD, USDCAD, USDCHF and likely many more. A VPS is advisable when trading this system and compatible to use to any broker. Check back test results and optimized settings.
Requirements: Trading pairs - GOLD, XAUUSD, EURUSD and many
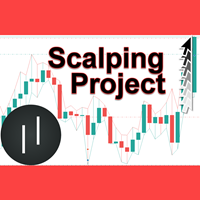
The Scalping Project EA follows a scalping breakout strategy. It trades the breakouts from relative highs and lows. For the entry stop orders are used for the fastest possible execution. Profits can be secured by the adjustable trailing stop. Since the strategy works with small average profits it is highly suggested to trade with a low spread and commission broker. Trading costs are crucial here! The backtests shown in the screenshots were done with the default settings. There might be better or
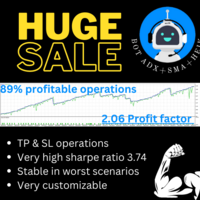
The Azurita North bot it's the ultimate expert advisor. Robust and very customizable, it ensured consistent growth even during the worst case scenarios during the last 2 years. If you are a data freak, check out the images attached and the youtube video. This bot uses specific indicators and ADX, SMA with Heiken ashi candles strategies. No martingale. All operations uses TP and SL. Some key indicators . Sharpe Ratio : 3.74 Profit factor: 2.06 Profitable positions (% total) : 89.04%
Recom

Slick Superior Expert Advisor est basé sur l'action des prix, la tendance, les modèles de chandeliers et il dessine les zones d'offre et de demande sur les graphiques. Le rapport risque/récompense est de 1:3. Le système de gestion de l'argent vous permet de ne risquer que 2 à 6 % de votre capital pour chaque transaction. Chaque transaction est protégée par un stop loss et un take profit. L'Expert Advisor suit le stop loss jusqu'au seuil de rentabilité et continue de suivre le stop loss et de pre
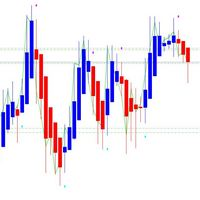
L'indicateur Heiken Ashi Signal est conçu pour le terminal de trading MT5. Il est basé sur l'indicateur Heiken Ashi standard, qui est disponible dans le terminal Mt5. L'indicateur peut être utilisé en manuel, ainsi qu'en autotrading par les Expert Advisors de l'auteur. Pour utiliser l'indicateur Heiken Ashi Signal dans les EA de trading, il existe des tampons de signaux pour l'entrée sur le marché et l'ouverture de positions d'achat et de vente. Vous en saurez plus ci-dessous.
Fonctions et ca

RaysFX (Average Directional Movement Index)
Technical indicator (ADX) helps to determine the market trend. It was developed and described in detail by Welles Wilder.
The simplest trading method based on the system of directional movement implies comparison of two direction indicators: the 14-period +DI one and the 14-period -DI.
To do this, one either puts the charts of indicators one on top of the other, or +DI is subtracted from -DI.
W. Wilder recommends buying whenever the +DI crosses ab
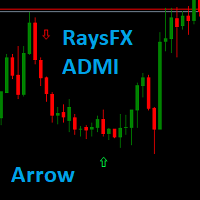
RaysFX (Average Directional Movement Index) to → ARROW
Technical indicator (ADX) helps to determine the market trend. It was developed and described in detail by Welles Wilder.
The simplest trading method based on the system of directional movement implies comparison of two direction indicators: the 14-period +DI one and the 14-period -DI.
To do this, one either puts the charts of indicators one on top of the other, or +DI is subtracted from -DI.
W. Wilder recommends buying whenever the +DI

1. Copiez les commandes, de 12 comptes maîtres vers 100 comptes esclaves. Le nombre de comptes esclaves peut être personnalisé, de 12 à 100. 2. Prend en charge MT4 à MT4, MT4 à MT5, MT5 à MT4, MT5 à MT5. 3. Identifiez les suffixes des variétés de trading sur différentes plateformes, telles que EURUSD, EURUSDm, EURUSDk. 4. Correspondance de devise personnalisée, telle que XAUUSD=GOLD. 5. Peut copier toutes les transactions, ou seulement copier les instructions ACHETER, VENDRE, FERMER 6. Vous pou
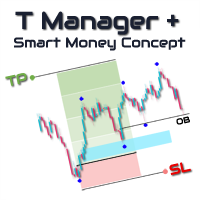
Maximisez votre potentiel de trading avec T Manager Plus, le compagnon de trading ultime conçu par des traders, pour les traders.
Cette puissante plateforme de gestion de trades et de charting avancé offre une interface conviviale et intuitive, ainsi que des règles automatisées pour vous aider à atteindre vos objectifs de trading en toute simplicité. Prenez le contrôle de vos trades et gérez votre risque avec précision en définissant vos prix d'entrée, vos stop losses et vos profits en quelque

COPY TRADING LOCAL OSW
C'est un excellent outil si vous souhaitez copier des transactions d'un compte à un autre.
Pour configurer l'Expert, vous devez suivre les étapes suivantes :
1) Vérifiez que le trading automatique est activé dans le terminal SLAVE.
2) Vérifiez que l'EA dispose des autorisations de négociation dans le terminal SLAVE.
3) Ajoutez l'expert à un diagramme MASTER et configurez-le en tant que MASTER.
4) Ajouter l'expert à un graphique SLAVE et configurer en tant que

Lorsque vous travaillez avec plusieurs actifs et que vous avez plusieurs positions ouvertes dans les actifs, il est un peu compliqué de visualiser quand profite ou profite chaque problème actif, donc dans cet esprit, nous développons cet indicateur où il facilite la visualisation des opérations dans les actifs , où vous pourrez ouvrir plusieurs ressources différentes et vous pourrez visualiser le résultat individuel de chaque actif et accélérer votre prise de décision dans votre entreprise.
FREE

ScriptBot+ It is a robust programmable robot, designed to allow the user to develop their strategy quickly, with fewer limitations and a multitude of subsystems and triggers based on logical expressions.
Utility:
With ScriptBot+ , it is possible to convert a variety of TEXTS into logical expressions. These expressions, composed of Operators , Variables , and Functions , make it possible to perform calculations using data from indicators , charts , orders , or the client's account . By means

Good day!
I present to you a trading technical indicator for Deriv broker synthetic indices. This indicator ONLY works with the following indices: Boom 300 Index Boom 500 Index Boom 1000 Index Crash 300 Index Crash 500 Index Crash 1000 Index The indicator was created to give signals to open medium-term trades in the direction of Spikes. But you can open trades in the opposite direction to Spikes, at your own risk. Trade only on M1. Other TFs do not guarantee the correct operation of the indic

USE IT ONLY WITH THE SET FILES I POSTED TO THE COMMENT SECTION.
Youtube video: https://www.youtube.com/watch?v=kQN5LTd91rk& ;t=2s
This is the biggest update in the life of the Imperium Pattern EA, it got new features and engine.
---It got the official TheNomadTrader Dynamic engine system alongisde with good risk:reward ratio
---New feature that allows traders to tell the EA after how much time(X value in minutes) the EA can close trades by dynamic exit. This feature boosts the EA p

this indicator has the finality of show in graph the size of candle in formation to show the force of market in some moments of the day. This indicator is free and based on example disponible on the comunity. I'm disponibilizing here to anyone who don't know about programing. Please enjoy this indicator and leave a coment or a rate to help this indicator to other people who needs.
FREE

After purchasing, you can request and receive any two of my products for free!
После покупки вы можете запросить и получить два любых моих продукта бесплатно! The utility is designed for manual placement of pending orders at the high and low of yesterday. The program has a built-in trailing stop, virtual take profit and stop loss. Unworked orders are deleted at the end of the day or manually. You may be interested in my other products: https://www.mql5.com/ru/users/vypchela/seller
Settings
FREE

MT4 Version SMT Divergences MT5
SMT Divergences is one of the most innovative indicators in the market. It offers the possibility of analyzing price divergences between 2 pairs. These divergences highlight and help to foresee what banks and institutions are planning to do. SMT divergences also provides you with a kill zones indicator and the possibility of filtering divergences occurring during these kill zones. This indicator is specially powerful if applied in 2 highly correlated pairs. A pr

In a nutshell Karla One is a product that organically came out from several years of manual trading. My goal was to built a system without the necessity of regular updates. Having said that, this Expert Advisors was specifically built for MQL5 customers, so please remember that I am always open to suggestions. Karla One uses machine learning to find the right entry points but at the same time before placing a trade, there are 7 conditions that have to be met. It relies on Price Action which se
The trading utility simplifies trading by quickly setting stop loss and take profit and risk calculation. Capabilities: 1. Using hotkeys: - The “s” key is responsible for showing/hiding the trading panel and stop loss and take profit levels. - The “~” key is responsible for changing the direction of trading. - It is possible to select in the settings a key that is convenient for you from the list for each of the parameters. 2. Using two modes of risk and volume calculation (the first button on t

This MT5 indicator has been designed to be used on any currency pair and any time frame . It has the scalper and swing trader in mind. The indicator looks for short-term high-probability reversals in price and will indicate to you to go long (buy) or short (sell) if you see a green or red arrow next to the current candlestick respectively. The indicator provides the best trading opportunities to you during the active trading hours of London and New York, but it will continue to give signals al

This MT5 indicator has been designed to be used on any currency pair or indices and on the daily time frame or higher . The indicator looks for medium-term high-probability continuations in price and will indicate you to go long (buy) or short (sell) if you see a green or red arrow next to the current candlestick respectively. The indicator paints an arrow when the specific criteria are met, however, you must wait until the current candlestick has closed until you enter a trade . Therefore you w

This MT5 indicator has been designed to be used on any currency pair, but not indices, on the ONE HOUR time frame only . This indicator has the highest win rate of all my indicators but it is not perfect and there is no holy grail in trading. The indicator looks for short-term high-probability trend continuations in price and will indicate you to go long (buy) or short (sell) if you see a green or red arrow next to the current candlestick respectively. The indicator paints an arrow when the spe

Ichimoku Genius (imG)
is a very Intelligent Indicator for the Perfect Entry & Exit. This is strongly recommended to: Check the Video properly to understand the Indicator setup, how does it work and exactly how to take Entries and Exit according to this Indicator. Please use this Indicator with "Pivot Points" & "Kijun-Sen" to get the Best result. Always give preference to Long Flat area of "KIJUN SEN" Line as this is act like a strong Support -or- Resistance.
Steps to Setup the Indicator: I

This robot trading based following indicators. ADX (Average Directional Movement Index) MAs (Moving Average, MA) Supported Parameters
Pair: EURUSD
Period: 4H, 8H, 12H, 1Day
https://www.youtube.com/watch?v=yhM91KUIaK8 Tested with FTMO broker.
We suggest tight spread broker. If you do not have tight broker, I recommended icmarket broker and you can created tight spread with using following link. Link: https://icmarkets.com/?camp=64005
Before use it please test own broker. Thank yo

This robot trading based following indicators. RSI (Relative Strength Index) MAs (Moving Average, MA) Supported Parameters
Pair: USDJPY
Period: 30M
Tested with FTMO broker.
We suggest tight spread broker. If you do not have tight broker, I recommended icmarket broker and you can created tight spread with using following link. Link: https://icmarkets.com/?camp=64005
Before use it please test own broker.
Thank you.

Smart Money Concepts is new trading method was developed from traditional Supply & Demand strategy after removing weak market conditional.
SMC also can support to trade with traditional Supply & Demand created nice strategy to understand total movement of market. 6 copy out of 10 are Left at $3000! Next price --> $4100
Our trading robot strategy is just hunting stoploss and we trade 1 or 2 trade in one day and we tested over 20 years. Supported Config:
Pair : EURUSD
Period : 1H(5

The Mathematical Trader is a new addition to my highly profitable indicator products. It can be used for scalping or catch the beginning of mid-term strong trends . This is an MT5 indicator only that utilises several mathematical formulations and has been designed to run on any instrument and any time frame less than the daily time frame . The lower the timeframe the more frequent the signals. The indicator will signal to you to go long (buy) or short (sell) if you see a green or red arrow next

A simple and efficient indicator that plots and updates the 50% of the current day, for those who use this point as a reference in day trading.
On trend days the 50% region tends to be a good resistance point, ideal for making new entries.
On non-trend days (sideways) the 50% region is great for carrying out positions.
In addition, for study or back-testing criteria, you can define the amount of previous days to be plotted by the indicator.
For questions or suggestions, please contact u
FREE

2 days left - next price 699$ . The price will be increased until it reaches the final price.
Please contact us after purchase so that we can give you the necessary Set Files and invite you to our VIP group .
N9T is an innovative Night-Scalping EA. The main strategy is from PROscalper supplemented by TrendFollowerSR and DailyBreakouts with several additional filters. The EA does not use grid , martingale or other dangerous strategies . Fixed stoploss and take profit ar
This is a trend following trading algorithm, not a highly risky martingale grid strategy. The strategy the uses exponential moving averages. On the 1 hour timeframe, two moving averages determine the long term direction, Bullish Trend allows only long while bearish trend allow short position enter. On the 5 minutes timeframe 3 moving averages determines the short term trend. Stop order activated on pull backs. By default stoploss will be set when market order activated, 50% partial lot closure
Interval Breakout (IB)
is a Breakout Indicator Mixing with Time Interval.
We can set a Particular Time and Support / Resistance Line Length for a Breakout Scanning. This is strongly recommended to: Check the Video properly to understand the Indicator setup, how does it work and exactly how to take Entries and Exit according to this Indicator. Give preference to Support / Resistance zone to get rid of False signal.
Steps to Setup the Indicator: Install the Custom Indicator; Set all the

After purchasing, you can request and receive any two of my products for free!
После покупки вы можете запросить и получить два любых моих продукта бесплатно! The fully automated algorithm is designed for long-term XAUUSD gold trading, does not require intervention and additional settings, without fairy tales and super profitability. The EA does not use dangerous trading methods like grid and averaging. The EA has four trading strategies based on Bollinger Bands, Moving Average, MACD and Chai

This program uses a two-time frame trading system. Use a large time frame to set the direction. and small time frames to find trading entry points.As for the AI, the perceptron method is used.Please try the demo before you actually buy it. Disclaimer - Trading has large potential risk. You must be aware of the risks and be willing to accept them in order to invest. - Do not trade with money you cannot afford to lose. This is neither a solicitation nor an offer to Buy/Sell futures, options or cu

The scientific approach to trading and responsible development are the main principles of Millennium EA. In order to create this EA, a research work was done in the field of trading. Dow theory, the theory of fractal analysis, the methods of Bill Williams and other traders, all this served as the theoretical basis for the advisor, which is designed to automate trading decisions. Signals: https://www.mql5.com/en/signals/1748354 https://www.mql5.com/en/signals/1748359 https://www.mql5.com/en/signa

My EA does not use any martingale or grid functionalities and follows a logical automatic concept. EA used one day one trade logic.
Forex Master EA finds its direction in the real data analysis and then follows this trend for the day. This expert advisor is designed to trade these trends especially in EURUSD pair M15. Recommended pair: EURUSD Timeframe :M15 EA also has News Filter Option for users who do not want to trade in News Times.
MT4 Version is HERE
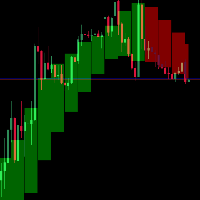
Anyone who is experienced in trading knows that longer time signals are trend signals. That's why it's always good to follow the trends of longer times to make a good trade.
With that in mind, I created the trend indicator in the background
Indicator Parameters TFBar - TimeFrame BackgroundEnabled - Enable Background NumbersOfBars - Numbers of Bar draw ColorUp - Color Up ColorDown - Color Down Smoothing - Heiken-Ashi Smoothing Average inpMA_METHOD - Smoothing Method width - Size Line bor
RSI Traffic Lights Dashboard Trend is you friend, one of the classical Trend following is the Relativ Streng Index (RSI). With RSI Traffic Light Dashboard you get an Overview how the current trend is moving for several Pairs. How many pairs you monitor, can be configured in Indicator settings. The order of symbols is equivalent to your Market Watchlist. The RSI Traffic Light Indicator alerts you if the trend is changing for your pair. Alert can be switched on/off
Important: Get informed about

This Indicator help you to identify trends and patterns. It shows the short-term, medium-term and long-term trend at the same time on the screen. It supports every timeframe except monthly. This indicator NOT implement the ZigZag indicator, but it uses its own algorithm.
Supported markets: - Forex - Metal - Energies Spot - in Energies Futures only o US Crude Oils - in Indices Spot only o US Tech 100 Index o UK 100 Index o US Wall Street 30 I
Tracker Candle Signal est un indicateur simple et pratique, capable de déterminer le mouvement des acheteurs et vendeurs, A savoir, qui aura le dessus à la fin de la chaque bougie en fonction de l'unité de temps choisi. Il est très précis sur les grandes unités de temps 1H, 4H, Daily. En effet, je l'utilises en daily pour comprendre le comportement du marché puis en 1H pour prendre position. Surtout n'hesitez pas à me faire un retour après utilisation.

Backtested report check the screenshots. This bot is perfect for prop firms. Only one losing month with a 3.67% max drawdown and a 100% return. We ran this bot through tons of different simulations to find a bot that can literally pass prop firms with little to no risk at all based off the settings. We ran this through monte Carlo simulations to make sure it works in any market condition. With this EA you'll have nothing to worry about when it comes to ever losing. Everything we do is based off

Mango Scalper is a fully automated scalping robot that uses a very Good and Smart breakout strategy, advanced money management and probabilistic analysis. Most effective in the price consolidation stages that occupy the bulk of the market time. Proven itself on real accounts with an excellent risk-to-reward ratio. Does not need forced optimization, which is the main factor of its reliability and guarantee of stable profit in the future. S uitable for both beginners and experienced traders.

==> This is an range breakout expert adviser.
==> Recommended pairs are EURUSD, GBPUSD, USDJPY, USDCHF,GBPCAD,NZDCAD ==> User is allowed to go through multiple setting parameters ==> This inputs will allow user to make customized EA to trade any asset based on Range Breakout System.
==> This will allow user to user 3 Type of Trailing Stop Loss
==> Other Improvements are coming soon ==> happy trading happy investing...! ==> Spreads are not in Pips Or Tick but, it is calculated by
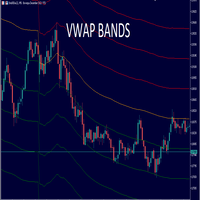
Este indicador contém 6 desvios, ótimo para ativos de alta volatilidade, podendo alterar as cores dos desvios como a largura da linha.
VWAP (Volume Weighted Average Price) nada mais é do que uma média móvel ponderada pelo volume das negociações de um ativo. Esse indicador é um dos mais utilizados pelos grandes investidores – na sua maioria institucionais –, pois permite ampla visualização da liquidez e dos pontos de interesse do ativo em análise. O volume é um dos elementos m

This EA is used to close all your open market positions and/or pending orders with a click of a button. The EA is ultra fast and your positions will close within a blink of an eye. It also allows you to close profit trades only or losing trades. You can also choose to close sell/short trades only or buy/long trades only. If your strategy include having many open and pending orders positions, this is a good EA to help you close your positions all at once with one click.
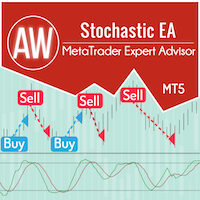
Système de trading avancé automatisé. L'EA se négocie sur les signaux de l'indicateur stochastique classique. Pour sortir des positions, il utilise un système de suivi intelligent et une moyenne utilisant les ordres en attente. Avantages : Système de trading entièrement automatisé Signaux d'oscillateur personnalisables pour le fonctionnement du robot Réglage simple et intuitif des variables d'entrée Convient à tous les types d'instruments et à tous les délais Système de remorquage réglable intég

Rasoir EA est un système entièrement automatisé et Ouvrir Système avec Protection contre les retraits et Fixé SL.
Only 1 Copies of 10 Left for 815 $ Next Price 1675 $ Signaux Guide Remboursement des commissions Mises à jour Mon blog Not Simple Grid, Not Martingale, Not AI , Not Neural Network. Default Settings for One chart AUDCAD M15 (Supports 1OHLC mode for weak PCs) Il s'agit d'une stratégie multi-devises pour trois paires de de
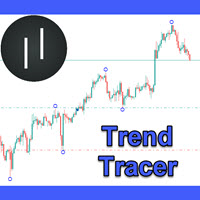
The Trend Trader EA can identify and trade market trends. Due to the nature of the strategy it will perform better in trendy market conditions and might struggle with sideways markets. It includes various trade management options to make adjustments whenever the market requires it. If you like the program then please consider leaving a 5 star rating and a short comment :)
FREE
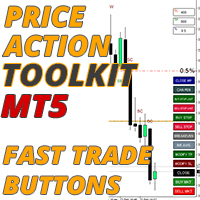
La boîte à outils d'action sur les prix EA est principalement conçue pour les scalpers mais peut être utilisée sur toutes les périodes pour entrer rapidement sur le marché avec une taille de lot correctement calculée en fonction de votre niveau d'arrêt. ordres), puis ajustez les stops et prenez les bénéfices au fur et à mesure que le marché évolue.
Pour une liste complète de toutes les fonctionnalités, paramètres et stratégie des meilleures pratiques à utiliser, cliquez ici : https://www.mq
Il s'agit d'un utilitaire pour faciliter votre trading en mettant en un ou quelques clics des tâches fastidieuses comme la gestion des ordres et la gestion des risques.
Caractéristiques
Gestion du risque
Calcule automatiquement les lots en fonction du risque spécifié en % ou en $ (paramètre d'entrée MoneyBasedRisk) dans le champ risque et vous laisse entrer en plaçant des lignes pour SL TP etc. et affiche le Risk Reward en temps réel. TrueRisk inclut les commissions lors du calcul de l

Préparez-vous à révolutionner votre expérience de trading avec le conseiller expert Intraday News pour la plateforme MT5 ! Cet outil de pointe est spécialement conçu pour le trading d'actualités, vous permettant de capitaliser sur des événements à fort impact comme le rapport sur la paie non agricole (NFP). Vous ne manquerez jamais un rythme sur les marchés des changes et des actions. Personnalisez votre stratégie de trading avec des entrées réglables pour les lots, les heures de trading, les m

Golden Idol négocie XAU/USD. Il a été construit avec des algorithmes d'apprentissage automatique de 2004 à aujourd'hui 2022. Une optimisation supplémentaire peut être effectuée si le commerçant juge bon de modifier les paramètres. Les valeurs par défaut sont fixées pour la prise de bénéfices à 700 et le stop loss à 500.
Golden Idol n'utilise pas de martingales ni aucune autre stratégie dangereuse. Dormez en sachant qu'il existe une gestion avancée de l'argent intégrée à chaque transaction

L'indicateur de tendance « Super Trend Flexible Alert » possède un minimum de réglages. Cet indicateur est conçu pour être aussi facile à utiliser que possible. L'indicateur affiche la tendance avec une ligne colorée principale (ligne "SuperTrend", que vous pouvez voir dans la fenêtre "Data Windows"). De plus, aux endroits où la tendance change, l'indicateur affiche des flèches colorées ( icônes "STBuy" et " STSell", que vous pouvez voir dans la fenêtre "Data Windows" ). Aux endroi

Divergence indicator 10 different indicators. Finding and displaying classic and hidden divergences.
Indicators in which divergences are searched: MACD MACD Histogram; RSI; Stochastic; CCI; momentum; OBV; VWmacd; Chaikin Money Flow; Money Flow Index. This is a replica of the indicator from the tradingview resource, adapted for the MT5 terminal.
MT4 version available here: https://www.mql5.com/en/market/product/87846
Settings: Bars in history for analysis - number of bars for analysis

Are you tired of drawing trendlines every time you're analyzing charts? Or perhaps you would like more consistency in your technical analysis. Then this is for you. This indicator will draw trend lines automatically when dropped on a chart. How it works Works similar to standard deviation channel found on mt4 and mt5. It has 2 parameters: 1. Starting Bar 2. Number of bars for calculation The starting bar is the bar which drawing of the trend lines will begin, while the number of bars for c
FREE

Indicator Introduction: The indicator comes from network ,It is more stable relative to RSI or CCI. You can set the indicator to send emails/notifications/alerts when the previous bar has an up or down arrow, you can specify the text of emails by inputing string into the parameter box of "UpMessages/DownMessages". It can be used to analyze market trend and design new expert that is based on trend. If the indicator below the axis ,this is a buy zone. The trend indicator is suitable for M1 and ab
FREE

The scalper EA uses strategies based on intra-bar trading on the H1 and H2 timeframes. Also many filters are used to find the right signals to open an order. The EA uses pending orders BuyStop and SellStop. The EA trades on two pairs: EURUSD, USDJPY and two timeframes H1, H2. Also, the adviser can be installed on other currencies using the instructions: https://www.mql5.com/ru/blogs/post/750726 The EA places a protective stop order on all orders. The adviser is safe and does not require any s
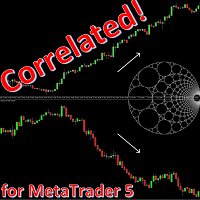
Correlation occurs when the price of two or more currency pairs move together. Being positive correlation, where prices move in the same direction or negative correlation, where they move in opposite directions. As a trader, it's important to understand that relation, as it can unconsciously affect your account's risk exposure.
Correlated is an Expert Advisor that identifies and takes advantage of divergent movements in strongly correlated currency pairs. It also shows a table of yields, stan
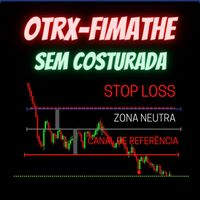
Fimathe Tool for Semi-Automatic Trading.
This tool serves as a support for trading using the Fimathe strategy, the same one used by Trader Marcelo Ferreira in his negotiations.
Features:
Button to set/change Trend chosen by Trader. Adjustment of Buy Zone and Neutral Zone Level Lines. Adjustment of Sell Zone and Neutral Zone Level Lines Subcycle Levels, R1, R2, R3, R4 and S1, S2, S3, S4.
Automatic Trailling Stop for previous level with each new (Subcycle) level reached.
Trading stop at

Trend ML entry points should be used as potential market reversal points. The indicator works using the cyclic-wave dependence function. Thus, all entry points will be optimal points where the movement changes.
The simplest way to use the indicator is to open a trade in the direction of an existing trend. The best result is obtained by combining the indicator with fundamental news, it can act as a news filter, that is, it can show how the market reacts to this or that news.
A simple and con

Trend Hunter is based on the process of detecting the rate of change in price growth and allows you to find points of entry and exit from the market.
The indicator was created on the basis of the original indicators of the search for extremes, the indicator is well suited for detecting a reversal or a large sharp jerk to one side, thanks to it you will know when this will happen, it will notify you by the appearance of a blue point for buying red for selling
A fundamental technical indic

Promotion $66 lifetime for you.
The principle of this indicator is very simple: detecting the trend with Moving Average, then monitoring the return point of graph by using the crossing of Stochastic Oscillator and finally predicting BUY and SELL signal with arrows, alerts and notifications. The parameters are fixed and automatically calculated on each time frame. Example: If you install indicator on EURUSD, timeframe M5: the indicator will detect the main trend with the Moving Average on this t

The bot is a scalpel, and accordingly works with ticks. The bot works on all types of accounts: netting, hedging. For Works with 5 digit quotes. The bot does not use the history stored in the database for work. For his own needs, he uploads historical data online, creating his own database. To achieve good results in real tick mode on the tester, it is necessary to carry out optimization. Custom bot features ORDER_TYPE_FILLIN - Sets the order execution policy. HourLimit - Trade restrictions at

Developed by Smart Trader - Smart Reversion Pattern is an indicator capable of identifying reversal patterns , both bullish reversals and bearish reversals.
It is designed to provide fast, real-time awareness of patterns.
We also thought about the interface part, creating a clean and pleasant look to identify formation patterns on the chart.
Note: If any pattern you need is not listed, just contact us and request inclusion - we usually respond within a few hours.
Bearish Reversal P
Le MetaTrader Market est le meilleur endroit pour vendre des robots de trading et des indicateurs techniques.
Il vous suffit de développer une application pour la plateforme MetaTrader avec un design attrayant et une bonne description. Nous vous expliquerons comment publier votre produit sur Market pour le proposer à des millions d'utilisateurs de MetaTrader.
Vous manquez des opportunités de trading :
- Applications de trading gratuites
- Plus de 8 000 signaux à copier
- Actualités économiques pour explorer les marchés financiers
Inscription
Se connecter
Si vous n'avez pas de compte, veuillez vous inscrire
Autorisez l'utilisation de cookies pour vous connecter au site Web MQL5.com.
Veuillez activer les paramètres nécessaires dans votre navigateur, sinon vous ne pourrez pas vous connecter.