Regardez les tutoriels vidéo de Market sur YouTube
Comment acheter un robot de trading ou un indicateur
Exécutez votre EA sur
hébergement virtuel
hébergement virtuel
Test un indicateur/robot de trading avant d'acheter
Vous voulez gagner de l'argent sur Market ?
Comment présenter un produit pour qu'il se vende bien
Nouveaux Expert Advisors et indicateurs pour MetaTrader 5 - 54

Ce signal DYJ est un système de trading complet basé sur les indicateurs techniques ATR. Ces indicateurs enregistrent l' état actuel de chaque tendance de force dans chaque paire de devises pour chaque période et chaque analyse. En évaluant ces données, les signaux électriques DYJ créent de manière professionnelle une liste de signaux d'intensité de tendance et de point d'entrée. Si l'une des paires correspond exactement, une alerte s'affiche pour l'indiquer. Les données de la liste comprennent

Système de travail, conseiller tendance!!! et est conclu sur la moyenne des prix pour la période de temps avec l'exposition et le changement de l'emplacement des ordres en attente. Le système a fait ses preuves pendant de nombreuses années de trading sur un compte réel. Et j'ai écrit un conseiller pour que vous puissiez essayer cette stratégie!!! Promotion prix jusqu'au 15.03.2023 à 50 dollars après +350
Si vous souhaitez utiliser les paramètres sur plusieurs paires de devises, le fichier

** All Symbols x All Time frames scan just by pressing scanner button ** ***Contact me after the purchase to send you instructions and add you in "Swing scanner group" for sharing or seeing experiences with other users. Introduction: Swing Scanner is the indicator designed to detect swings in the direction of the trend and possible reversal swings. The indicator studies several price and time vectors to track the aggregate trend direction and detects situations in which the market is o

Candle Counter This product counts the candles and shows the result according to the configuration defined by the user. Professional traders use it to emphasize a specific candlestick.
Settings Position - Choose whether the numbers will be displayed above or below the candle Distance - The distance that the number will have from the candle, referring to the minimum or maximum Font Size - Font Size Color - Font Color
FREE

It is a secure automated market trading software. The architecture is a fully automatic autonomous expert robot capable of independently analyze the market and make trading decisions Efficient. It is an advanced and professional trading system.
Requirements Supported currency pairs: CADJPY,GBPCHF,AUDJPY,USDCHF,EURCAD,EURNZD,NZDJPY; Best Pair CAD/JPY; Timeframe: H1; The EA may not be sensitive to spread and slippage. I advise you to use a good broker convenient for you; The adviser must work c

Like most things that work in trading, it's really simple. However, it's one of the most powerful tools I have that makes entries of many systems much more precise.
In its essence, it measures the recent volatility against the medium-term average. How does it work? Markets tend to be prone to strong trending movements when relative volatility is low and tend to be mean-reverting when relative volatility is high.
It can be used with both mean-reversion systems (like the Golden Pickaxe) an
FREE

** All Symbols x All Timeframes scan just by pressing scanner button ** *** Contact me immediately after the purchase to send you instructions and add you in "Market Structure group" for sharing or seeing experiences with other users. Introduction: Market structure is important for both new and professional traders since it can influence the liquidity and price action of a market. It’s also one of the most commonly used techniques to understand trends, identify potential reversal points,

The DR IDR Range Indicator plots ADR, ODR and RDR ranges for a given amount of days in the past. A key feature that appears is that it calculates the success rate of the ranges for the shown days. This indicator is perfect for backtest since it shows ranges for all of the calculated days, not just the most recent sessions. PRO VERSION
https://www.mql5.com/en/market/product/93360 Remember: this free version counts neutral days as true days , so stats might be slightly inflated. To get perfect
FREE

EA AMPV System is an automated trading advisor based on the RSI, Bollinger Bands and MACD combined strategy which is well suited for both beginners and experienced traders.
The minimum deposit is $100 for a 1:100 leverage.
I recommend to use a 1:100 ECN account with a low spread and a fast VPS.
Optimized for XAUUSD pair on 1 minute timeframe.
Due to the simplicity and convenience of this EA every user can give it a try and choose the strategy and the appropriate lot size which will matc

This is a derivative of John Carter's "TTM Squeeze" volatility indicator, as discussed in his book "Mastering the Trade" (chapter 11).
Black crosses on the midline show that the market just entered a squeeze ( Bollinger Bands are with in Keltner Channel). This signifies low volatility , market preparing itself for an explosive move (up or down). Gray crosses signify "Squeeze release".
Mr.Carter suggests waiting till the first gray after a black cross, and taking a position in

Profit Aqua , It is an indicator that belongs to the jungle project that has 3 indicators On this occasion, play with the profit aqua indicator, that has the strategy of a professionally programmed moving average to facilitate all types of entry It has the color change strategy, as seen in the photo when it changes red it is clearly marking a short entry when the green color clearly marks you in long, You can do scalping and at long periods of time! It is used for forex and synthetic indices Sui

Stochastic Jungle . It has a new pack called jungle, on this occasion I bring the indicator, stochastic jungle that has the strategy of high ranges and low ranges to better hunt trends and entries according to their temporality He is professionally programmed to make entries with high effectiveness percentages, where it touches the green ceiling and changes color to orange marks entry into low where it is upside down and touches the floor with the orange color changing to green is an upward entr

This is the MT5 version of the absolute OCD tool that delivers Position Size Calculator and many more other options of the matured PSI Position Smart Indicator NEW check the FULL Version Including the private ICT tools limited so far until the release of the full 2016 Mentorship Core Content to the public. Indicator type: Money Management Calculator; Forex Position Size Calculator; Fixed or ATR value for Stop Loss and Take Profit levels; Average Position Size Indicator (True Average Price); Acc

dmi jungle It is the last indicator of the jungle pack On this occasion, it has the DMI jungle indicator, which goes from the strategy of the oscillator with the line crossing, and the color changes, when it gives a line crossing and a color change from gold to lightgreen it is a trend change vice versa it is always the same with the crossing of the line! It works for Forex markets and synthetic indices! Suitable for all seasons! Good profit!

Strength Safari , First indicator of the safari pack On this occasion we have an oscillator that gives perfect crosses indicating where the clear input is At two points is the green line and the gold line where the entrance marks you where it touches the floor or ceiling At the crossing of the lines, the green one above the gold marks the ascent zone, The gold crossing the truth marks the drop zone, ideal for grabbing long trends! used at any time in the Forex and Synthetic Indices markets! Good

Renko Professional, Safari pack indicator 2 . On this occasion it has the professional renko indicator, which has the strategy of support, resistance, bullish green line and bearish red line. It marks the entry points and accumulation points very well! It works for all seasons! For the forex markets and synthetic indices ! Works for all pairs! Good profit!

Filter Professional , Safari pack indicator 3, It has an indicator that is a type of moving average with color that will mark the entrance perfect at different times, when it marks the green line, an upward trend is coming and it is entry for purchase, when it marks the gold line it is a downtrend gives bearish entry zone. It is used for the Forex markets and synthetic indices all pairs! All temporalities! Good profit!

Professional Candles It is the indicator 4 of the Safari pack It has an oscillator that marks each point of the forces of the candles Not only that, but it also measures it by color to be able to fit in perfectly. It is used for scalping and intra day, works for forex markets and synthetic indices works for all pairs ideal for volatility and jumps! works for all seasons! Good profit!

MA Safari, Indicator number 5 of the Safari Pack. It has a series of moving averages where the crossing arrives and gives a very clear entry, perfect for large temporalities, to catch long trends. It works for all seasons. Ideal for forex currency markets and synthetic indices! Ideal for volatility and jumps, go in all pairs! Good profit!! World Inversor !!!!

Bolinger Professional Bands, Last indicator of the Safari Pack. in this last indicator we find a unique programming of bolinger bands where you can better catch the rebounds on the bands above and below, works for forex currency markets! synthetic index markets and also crypto! It works in all temporalities and all pairs! Good profit! World Inversor!!!!!
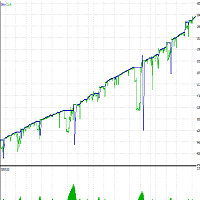
Please backtest with the exact balance of your live account before applying to real money. ==> If account balance is too low it may not trade at all! For MT4 version please contact via private message. Strategy description - Detect trend based on GoldTrader rules. - Enter in both direction as much as needed to achieve acceptable amount of profit. - Although this is a martingale bot it is very unlikely to loose your money, because: ==> the money management rules are safe and low risk. ==> entries
FREE

Please backtest with the exact balance of your live account before applying to real money. ==> If account balance is too low it may not trade at all!
For MT4 version please contact via private message. martingale version is available here . Strategy description - Detect trend based on EMA18-EMA50-SMA200 alignment in three time frames: M15, H1, H4 - Trade in trend direction and exit when above alignment is broken. - The bot is tuned to trade XAUUSD(Gold). - The bot output is break even in rangi
FREE

Panel for send/modify orders/positions by handle moved levels for take profit, stop loss, open price and expire at with lot calculations in several modes. Settings: Risk management Lot calculation mode: default: Free margin, Modes: Fixed, Free margin, Equity, Balance Minimal lot size - default: 0.01 Maximal lot size - default: 0.1 Fixed lot - default: 0.01 Percents - default: 5 Trade when have free margin (0 - disabled) - default: 30 Levels Style - default: Dash Width - default: 1 Panel Positio

The RSI2.0 indicator uses normalized price data and signal processing steps to get a normal distributed oscillator with no skew (mean is zero). Therefore, it can give much better reads than the traditional RSI. Areas/Levels of reversal: Overbought or oversold levels from traditional RSI have no statistical significance, therefore the standard deviation bands are implemented here, which can be used in similar way as possible reversal points. Divergence: As the indicator is nearly normal dist

This is addition of Effective SV squeeze momentum that add bolliger band and Keltner channel to chart window. Squeeze momentum introduced by “John Carter”, the squeeze indicator for MT5 represents a volatility-based tool. Regardless, we can also consider the squeeze indicator as a momentum indicator, as many traders use it to identify the direction and strength of price moves. In fact, the Tradingview squeeze indicator shows when a financial instrument is willing to change from a trending ma
FREE

My Pivot Pro is the Pro Version of the Indicator " My PIVOT " ( Link: https://www.mql5.com/en/market/product/90336 ) This indicator will help you a lot to decide the Market Range and Movement. This Indicator is based on Pivot Lines and Support-Resistance zones. Now we can Plot Standard/Classic; Fibonacci; Demark; Camarilla nd Woodies Pivot Levels as per our requirements.
Steps to Setup the Indicator: Install the Custom Indicator; Set the Pivot Type; Period and Time ( We recommend to use
Clean up Market Watch from unused symbols.
If you use multiple advisors and terminals on the same account your Market Watch windows may get filled with unused symbols from orders and positions opened on other terminals. Every symbol in the Market Watch consumes cpu power and bandwidth to get constantly updated and if you are on a vps you want to minimize resources consumption. Market Watch Cleaner helps you with that by periodically cleaning your Market Watch window from unused symbols.
Par
FREE

Standard PVSR is based on Pivot Points.
Steps to Setup the Indicator: Install the Custom Indicator; Set all the Lines Color, Width and Styles; Set visualization to All Timeframe; and DONE
It can be used for: All Pairs: Forex, Cryptocurrencies, Metals, Stocks, Indices etc. All Timeframe All Brokers All type of Trading Style like Scalping, Swing, Intraday, Short-Term, Long-Term etc. Multiple Chart
-->> For any Type of Support, Guidance, Setup Issue, EA Optimization, Input Setup etc.
FREE

Lets dabble a bit into Elliot Waves.
This is a simple indicator which tries to identify Wave 1 and 2 of Elliot Impulese Wave and then projects for Wave 3.
Ratios are taken from below link: https://elliottwave-forecast.com/elliott-wave-theory/ - Section 3.1 Impulse
Wave 2 is 50%, 61.8%, 76.4%, or 85.4% of wave 1 - used for identifying the pattern. Wave 3 is 161.8%, 200%, 261.8%, or 323.6% of wave 1-2 - used for setting the targets
Important input parameters
MaximumNumBars : To calc

The Accumulation / Distribution is an indicator which was essentially designed to measure underlying supply and demand. It accomplishes this by trying to determine whether traders are actually accumulating (buying) or distributing (selling). This indicator should be more accurate than other default MT5 AD indicator for measuring buy/sell pressure by volume, identifying trend change through divergence and calculating Accumulation/Distribution (A/D) level. Application: - Buy/sell pressure: above

Equal Highs and Lows Indicator
Find and Mark Equal Highs and Lows on chart of Selected Multi Time frames. Options:
set min and max bars between Equal High's / Low's bars set max points difference between High's / Low's ( Sensitivity )
Select time frames by buttons on chart Select / Filter only High's or Low's by a button Extend Equal High's / Low's line forward for chart reference
Manual
MT4 version
MT5 version
Other Indicators

Identify Engulfing candle pattern with Arrows & Alert ( built-in RSI filter). This indicator helps you to identify Engulfing candle pattern or Outside bar (OB) on the chart with arrows, along with an alert when a new Engulfing candle appears. Engulfing candle pattern is one of the most important reversal Price Action signals. You can choose between standard Engulfing (Engulfing based on candle body) or non standard Engulfing (Engulfing based on candle high - low )
Alerts can be turned on
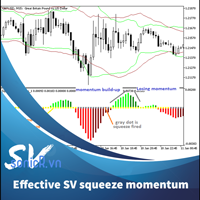
Introduced by “John Carter”, the squeeze indicator for MT5 represents a volatility-based tool. Regardless, we can also consider the squeeze indicator as a momentum indicator, as many traders use it to identify the direction and strength of price moves. In fact, this squeeze indicator shows when a financial instrument is willing to change from a trending market to another that trades in a considerably tight range, and vice versa. Moreover, it indicates promising entries as well as exit points For

GBP Portfolio EA is a Fully Automated Trading System that works on any session and trade only one pair (GBPUSD) Оnly 10 Copies available at $87! Next Price --> $199 The EA Does NOT use Grid or Martingale . Default Settings for GBPUSD H1 Only The EA has 56 Strategies with different parameters. It will automatically enter trades, take profit and stop loss using reverse signal modes. If a trade is in profit it will trail it until a reverse signal is detected. The EA works on GBPUSD on H1

Identify Pinbar Candle Pattern with Arrows & Alert (built-in RSI filter).
This indicator helps you to identify Pin bar Candlestick Pattern (or shooting star & hammer pattern) on the chart with arrows, along with an alert when a new Pin bar appears. Pin bar pattern is one of the most important reversal Price Action signals.
You can set Minimum Percent of Wick (or Tail) Length over full bar length (Recommended: 60%, 70%, 75%).
Alerts can be turned on and off: Popup Email Push Notification S
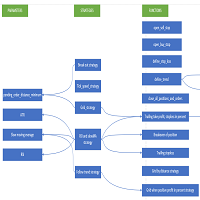
This EA can be used to automatically trade several strategies, or can be used as trade assistant. Following strategies can be used: · Break out strategy; · Tick speed strategy; · Grid strategy; · RSI and slow MA strategy; · Follow trend strategy. Explaining some parameters: orderable_spread – spread in points. If symbol’s spread is greater than the parameter EA does not open positions. Video for introduction and use as an assistant: https://www.youtub

Get the best out of your forex trading experience with our Superb Trend indicator! Our revolutionary technology helps you make smarter and more successful trades, no matter your skill level. With a simple and intuitive interface, you'll be able to analyze trends and make wiser decisions in no time. Stop gambling with your money; start leveraging our Superb Trend Indicator to outperform the market!
Trend Signals: Bullish trend will show as Green line. Bearish trend will show as Red line.
Su

UPDATE v1.0 IS OUT - PLEASE READ ALL THE DESCRIPTION BEFORE USE IT LL Pursuit EA is an advanced and smart multi-currency trading system , based on the combined and weighted use of different decision factors. The algorithm uses real-time data from 14 currency exchanges , the most liquid and weighted on the market, combined with the calculation of various indicators , including moving averages, accumulation and distribution volumes, currency strength and trend continuity, to automatically take op
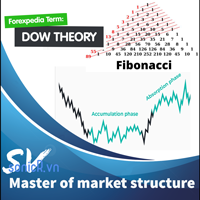
This indicator combine DOW theory with Fibonancy level to determine the structure of financial markets. It include resistance determine to provide an overview of the market. The Dow Theory is an approach to trading developed by Charles H. Dow, who, with Edward Jones and Charles Bergstresser, founded Dow Jones & Company, Inc. and developed the Dow Jones Industrial Average in 1896. In summarize, DOW theory is: + Technical framework that predicts the market is in an upward trend if one of its aver

Supply and demand zones are at the heart of supply and demand trading . These zones are areas that show liquidity at a specific price. The supply zone is also called the distribution zone, while the demand zone is called the accumulation zone. Our indicator automatically draw supply and demand zones in Metatrader 5. It give opportunity to understand trading zone and avoiding risk.

Events Timer EA allows you to place a trade at a specific time and close it at a specific. The stop loss is trailed automatically. The EA performs one trade at time until the time elapses. Since it has a Trailing Stop, it will open another trader when it gets stopped out. It is ideal for trading news events using a very short trading time. Inpits: -Trade Time -Stop Trade Time -Trade Type(buy/sell) -lot -stoploss points

Daily VWAP, continues for a period of hours (eg, 10 hours of history),
with color to indicate change of direction and bands to map good entry and exit points. The indicator was created to map the center of the market, and find good buying moments, trend analysis or market correction points are easily detected, allowing you to understand moments of exhaustion and buying and selling points Copyright (c) <year> <copyright holders> Permission is hereby granted, free of charge, to any person obtain
L'indicateur est utilisé pour le boom commercial et Crash, est un super détective de tendance. Lorsque le marché est à la hausse, utilisez le signal fort pour attraper le pic, lorsqu'il est à la baisse, utilisez le signal régulier pour attraper plus de pics.
L'indicateur est basé sur l'action des prix par nature avec certaines logiques mathématiques. Il est utilisé pour attraper les pointes uniquement.
L'indicateur possède la sortie suivante
1. Signal fort
2. Signal régulier
3. Alerte
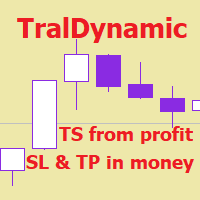
The utility for managing open positions can work with stops (take profit and stop loss) in money, percentages or points. The built-in trailing stop starts working from profit, the size of which can be set in currency or as a percentage. With the help of the built-in trading simulator, you can check how the utility works in the strategy tester. Benefits setting stop loss and take profit in the deposit currency, as a percentage of the account balance or by points; adding stop loss and take profit
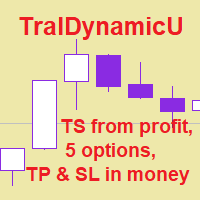
The utility for managing open positions can work with stops (take profit and stop loss) in money, percentages or points. The built-in trailing stop starts working from profit, the size of which can be set in currency or as a percentage. Trailing stop can work in three modes and for five instruments. With the help of the built-in trading simulator, you can check how the utility works in the strategy tester. Benefits setting stop loss and take profit in the deposit currency, as a percentage of the

Voici Airiam, elle n'utilise aucun système de martingale ou de grille. Les tests ont été effectués sur l'EURUSD H1, mais d'autres paires de devises pourraient également fonctionner. J'ai passé de nombreux mois sans sommeil à créer ce bot et ce n'est qu'après des tests appropriés que je me suis senti prêt à partager. Inclus sont des captures d'écran des tests effectués. Les paramètres par défaut étaient ce que j'ai utilisé. Le trading Forex comporte un risque élevé et doit toujours être testé ava
FREE
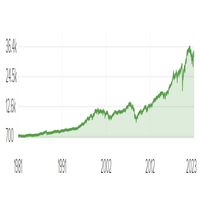
L'EA est optimisable et optimisé à partir de janvier 2022.
Dow Jones Lot Trader a été créé avec l'apprentissage automatique et négocie les contrats à terme Dow Jones sur des graphiques d'une heure en utilisant des lots fixes. L'évaluation environnementale a été faite sur de vraies données à terme sur le micro Dow Jones.
Vous devrez peut-être effectuer un test en amont si vous négociez des dérivés du Dow Jones pour voir s'ils correspondent aux données réelles des contrats à terme. Le sl et l
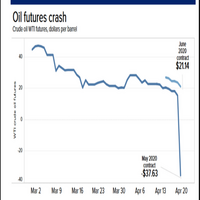
OPTIMISER EA AVANT LE TEST ET L'UTILISATION.
Les contrats à terme sur le pétrole brut ont été construits avec des données réelles du marché à terme sur des périodes d'une heure de janvier 2022 à décembre 2022. Testez ces dates pour des tests rétrospectifs et des analyses. Optimisez si nécessaire.
Négociez à partir du marché à terme réel ou si vous négociez un dérivé du pétrole, testez les paramètres pour voir comment ils correspondent aux données et au courtier que vous utilisez. Les contra
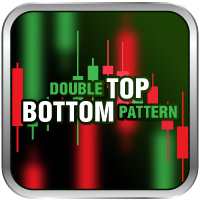
Qu'est-ce que le double haut et bas ?
Les modèles double top et bottom sont des modèles graphiques qui se produisent lorsque l'investissement sous-jacent évolue selon un modèle similaire à la lettre "W" (double bottom) ou "M" (double top). L'analyse double haut et bas est utilisée dans l'analyse technique pour expliquer les mouvements d'un titre ou d'un autre investissement, et peut être utilisée dans le cadre d'une stratégie de trading pour exploiter des modèles récurrents.
vous pouvez tr

Forex Fighter is an advanced, multicurrency system that trades following symbols: EURJPY, GBPCHF, EURGBP, USDCAD, AUDNZD, USDJPY and AUDCAD. The strategy is based on built in indicators which I developed myself. Forex Fighter follows unique patterns that are repetitive but very often human brain is not capable of catching them. The decision maker here are two Neural Networks which have to agree whether or not a particular trade will be placed. The probability of repeating a pattern has to be ab

the AK CAP toolbox free to use;
it includes the same indicators we use for our daily trading and we think the simpler the better. Lightweight indicator for use on all timeframes. that includes VWAP with vwap value indicator on top right. 3 EMA: FAST, MEDIUM, SLOW the candle timer to show how much time left in a candle.
colors and positions are fully customizable.
enjoy
FREE

Defining Range ( DR ) and Implied Defining Range ( IDR ) indicator Pro with added features from free version
Show DR and IDR ranges Sessions on the chart for RDR Regular defining range (New York Session)
ADR After defining range (Asian session) ODR Outside defining range (London Session)
Buttons on chart to enable / disable :
Show Imbalance ( IMB ) Show Volume Imbalance ( VIB ) Show Gap's between open and close
Show Standard Deviation ( SD )
Show last 3 Sessions
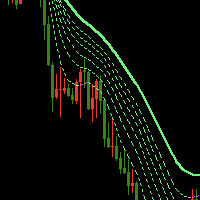
The Waterfall Trend Indicator MT5 uses line regression algorithm, using "Waterfall" in its name is in that it like waterfall when there is a strong down market trend. The indicator draws seven lines, one of which is sold line, others are dash line, the sold line is more stable. Indicator introduction The indicator can effectively filter price noise since it is calculated with line regression. It can be used to analyze market trend and design new expert that is based on trend. When the trend lin

The CashFlow EA works on the principle of the breakout strategy.
Introductory price 99 USD , future price 149 USD.
Description: Through stop orders, the breakouts of highs and lows, are traded. Through the adjustable trailing stop, profits are taken as high as possible and the losses as low as necessary.
It is strongly recommended to trade with a broker that offers a low spread and commission.
Please be responsible with your trading capital and only use money that you can afford to los

Percentile of Historical Volatility and Correlation Coefficient shows if the asset is cheap or expensive based on the volatility. It is used to determine a good entry point. It has two indicators built in: Historical Volatility is ranked percentile wise and its correlation to price action which gives an indication of the direction of a possible future move. Together the both indicators can give good entries and direction. Historical Volatility is a statistical measure of the dispersion of retu

This z-score indicator shows the correct z-score of an asset, as it uses the normalized price data for calculation, which is the only correct way. Z-score is only applicable for normal distributed data, therefore not the actual price is considered, but the normalised returns, which were assumed to follow a normal distribution. Returns are mean reverting and assumed to follow a normal distribution, therefore z-score calculation of returns is more reliable than z-score on price, as price is NOT m
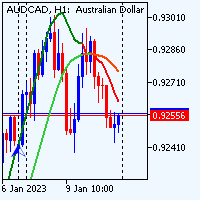
Test Before Use... In the forex market, a range refers to a period of time during which the price of a currency pair remains relatively stable, fluctuating within a narrow band. This can be contrasted with a trend, which refers to a sustained movement in the price of a currency pair in a particular direction. During a range, the price of the currency pair may move up and down within a defined range, but it is not trending strongly in any particular direction. This can be a good time for the rang
FREE

Closes all Trades with click on a button. This button will appear on the right bottom side of the chart. When you remove the utility, the button will also dissappear. It closes all trades, no matter if Sell, Buy, the Symbol, if in profit or loss. One Click - and you solve it all. Especially made for demo and testing purposes. Use it with caution on live trading accounts!
FREE

Critical Trading, Currency Strength This indicator allows for viewing true value changes in the 8 major currencies, this ability has many applications for simple and advanced forex trading. No need to switch to inaccurate 3rd party applications or websites. Trend catching: No need to watch 28 charts, pair up the strongest and weakest performing pairs. Optimize entries: Show the currencies of your current chart and enter on reliable pullbacks for further confluence on your trades. Currency perfo
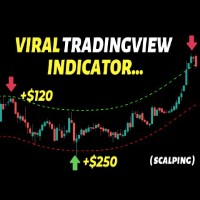
This indicator builds upon the previously posted Nadaraya-Watson Estimator. Here we have created an envelope indicator based on kernel smoothing with integrated alerts from crosses between the price and envelope extremities. Unlike the Nadaraya-Watson Estimator, this indicator follows a contrarian methodology. Settings
Window Size: Determines the number of recent price observations to be used to fit the Nadaraya-Watson Estimator.
Bandwidth: Controls the degree of smoothness of the envelop
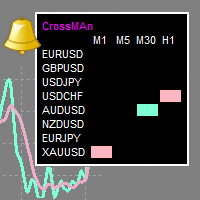
"CrossMAn" is a table indicator that gives signals about the intersection of two moving averages, on selected instruments and time periods.
The intersection of moving averages is one of the most popular signals on the stock exchange.
The signal is displayed as colored rectangles in the table. Thus, you can assess at a glance which tool should be paid attention to.
(Crossman does not add moving averages to the chart.)
The indicator table can be dragged with the mouse.
The size of the table
Trend Following Strategy Generator The following Expert Advisor helps to generate robust trend-following strategies using price action and a few parameters. the story behind the expert Advisor is to unfold market behavior for an instrument and choose how we can trade it best. After finding your favorite strategy you can save the parameters and start trading the strategy in no time. There is no limit to how many strategies you can generate. How will this EA help you? We all know trading is hard,

Sniper2 , It has points of lines, with colors that are showing you an entrance, that work as support and resistance! green dotted lines green shows entry for sale, the red dotted lines show a buy entry, pay attention to the supports that work as a break to catch long candles in a longer period of time. works for forex all pairs works for synthetic indices all pairs ! indicator on sale!

The EA Trend Pivot Point uses pivot values to choose a buy or sell trade and uses two indicators, STD and ATR, to measure market volatility and choose if market volatility is high not to trade. If the market volatility is less, then trading is allowed. Use pivot point calculations alone for probabilistic weighting of 10 AI pivot values. Based on a 20 year retrospective data backtest Resulting in the weight of this pivot value, for default it is for trading EURUSD Timeframe M15 which user can fin

Sniper rank, It has a gang programmed to hunt down perfect tickets. It has two lines that are used to hunt perfect pivots when the sails of the band come out, They work for all pairs of synthetic indices, perfect for volatility and jumps It also serves for marking forex, it operates in all pairs It is used for scalping and higher temporalities! Perfect Profit!!!!

Moving Level , Special indicator for hunting trends and scalping! programmed to use it in any temporality, It has the trend volume strategy by marking an arrow if it is long or short accompanied by the colors blue yellow and red when it marks the yellow line with the arrow pointing up and is accompanied by blue lines, it is an uptrend When it marks the down arrow with the yellow line and is accompanied by red lines, it is a downtrend. It is used in the synthetic index markets in all pairs, It is

The purpose of using Smart money index (SMI) or smart money flow index is to find out investors sentiment. The index was constructed by Don Hays and measures the market action. The indicator is based on intra-day price patterns. The beginning of the trading day is supposed to represent the trading by retail traders. The majority of retail traders overreact at the beginning of the trading day because of the overnight news and economic data. There is also a lot of buying on market orders and shor
FREE

Overview: The news bot places a buy and sell trade at the same time before economic news is released, when spreads are low. Minutes before the news, the bot places stop loss orders on both trades and adjusts them based on real-time market movements. As the news approaches, the bot stops adjusting the stop loss orders and allows them to be triggered by the market. Depending on the impact of the news, one stop loss order may be triggered and the corresponding trade closed, while the other trade re

"Recovery Drawdown" is an Expert Advisor (EA) specifically designed to address and overcome the challenge of drawdown in trading accounts. Drawdown occurs when an account experiences a series of consecutive losses, resulting in a significant decrease in available balance. This EA follows a cyclical strategy composed of several key steps. The first step is to close winning trades. This approach is implemented to secure the profits obtained up to that point and prevent them from turning into loss

This indicator labels swing highs and swing lows as well as the candle pattern that occurred at that precise point. The indicator can detect the following 6 candle patterns: hammer , inverse hammer , bullish engulfing , hanging man , shooting star and bearish engulfing .
The notations HH, HL, LH, and LL you can see on the labels are defined as follows:
HH : Higher high
HL : Higher low
LH : Lower high
LL : Lower low
Setting
Length: Sensitivity of the swing high/low de
MetaTrader Market - les robots de trading et les indicateurs techniques pour les traders sont disponibles directement dans votre terminal de trading.
Le système de paiement MQL5.community est disponible pour tous les utilisateurs enregistrés du site MQL5.com pour les transactions sur les Services MetaTrader. Vous pouvez déposer et retirer de l'argent en utilisant WebMoney, PayPal ou une carte bancaire.
Vous manquez des opportunités de trading :
- Applications de trading gratuites
- Plus de 8 000 signaux à copier
- Actualités économiques pour explorer les marchés financiers
Inscription
Se connecter
Si vous n'avez pas de compte, veuillez vous inscrire
Autorisez l'utilisation de cookies pour vous connecter au site Web MQL5.com.
Veuillez activer les paramètres nécessaires dans votre navigateur, sinon vous ne pourrez pas vous connecter.