Regardez les tutoriels vidéo de Market sur YouTube
Comment acheter un robot de trading ou un indicateur
Exécutez votre EA sur
hébergement virtuel
hébergement virtuel
Test un indicateur/robot de trading avant d'acheter
Vous voulez gagner de l'argent sur Market ?
Comment présenter un produit pour qu'il se vende bien
Indicateurs techniques pour MetaTrader 5 - 6

40% off. Original price: $50 Moving Average Trend Scanner is a multi symbol multi timeframe triple MA crossover dashboard that helps traders to monitor, and identify potential market trends from one chart. This panel scans 3 moving averages in up to 28 configurable instruments and 9 timeframes for triple moving average alignment and moving average crossover with a deep scan feature to scan all market watch symbols (up to 1000 instruments!).
Download Demo here (Scans only M1 and M6) Sett

Custom Spread Indicator *Please write a review, thanks!
Also MT4 version is available
Spread Indicator show the current spread in pips with color codes. Handle 3 levels, Low, Medium, High. You can set levels and colors for each level (eg. Low: Green, Medium: Orange, High: Red), and can choose display position on the chart.
There is two spread calculation mode: -> Server spread value -> Ask - Bid value
Can set opacity, for better customization. When spread jump bigger, then display do
FREE

Voir "Nouveautés" pour un récapitulatif des nouvelles fonctions. La version 1.4 n'était qu'un nettoyage, rien de spécial.
J'ai créé cela car j'avais besoin d'un indicateur fractal personnalisable. Il vérifie également la diminution des volumes pour obtenir une forme de confirmation. Détails ci-dessous : Vue d'ensemble Cet indicateur est conçu pour aider à identifier les points de retournement clés sur le marché en analysant l'action des prix et la dynamique des volumes. Caractéristiques La stra
FREE

This indicator converted from 5 min Buy and Sell Range Filter - guikroth version on TradingView Popularity of the Range Filter
The Range Filter is a very popular and effective indicator in its own right, with adjustments to the few simple settings it is possible to use the Range Filter for helping filter price movement, whether helping to determine trend direction or ranges, to timing breakout or even reversal entries. Its practical versatility makes it ideal for integrating it's signals into

Indicator determines the direction of price movement, calculates the possibility of entering the market using an internal formula and displays a breakout entry signal. Indicator signals appear both at the beginning of trend movements and in the opposite direction, which allows you to open and close orders as efficiently as possible in any of the market conditions. Version for МТ4: https://www.mql5.com/en/market/product/58349
Benefits: a unique signal calculation formula; high signal accuracy;
FREE

Version 1.5: manual color change added
This indicator helps to trade price action and momentum strategies like Guerrilla Trading or similar strategies.
The indicator displays: most recent highs and lows number of consecutive breaks past breaks of most recent highs and lows retest lines flag formations manual color change User can change colors. Go to Indictor Properties/Input, set "Auto Color" to false and change the colors. Set "Auto color" back to true to go back to pre-set colors. Please
FREE

Multicurrency and multitimeframe indicator of the Standard Deviation Channel. Displays the current direction of the market. On the panel, you can see breakouts and touches (by price) of the levels of the linear regression channel. In the parameters, you can specify any desired currencies and timeframes. Also, the indicator can send notifications when levels are touched. By clicking on a cell, this symbol and period will be opened. This is MTF Scanner. The key to hide the dashboard from the char

VOLUMES DIRECTION MT5
Normalement, l'indicateur de volume a un changement de couleur par défaut lorsque le volume actuel est plus élevé que le précédent, c'est important mais pas très utile.
Pour cette raison, cet indicateur a été créé pour qu'en plus du volume normal, lorsque la bougie est haussière ou baissière, il les peint d'une couleur différente, par défaut bleu pour haussier et rouge pour baissier, mais ces couleurs peuvent être personnalisées selon le Le goût du commerçant.
N'
The Higher timeframe candle tracker is used to get a glimpse of what the selected higher time frame candle is like. It plot the candle after the current price. It can come in handy for day traders and short term traders that often worry about how the current higher timeframe candle may look like. You can select the higher time frame or lower time frame from the options provided: By default the color for bears is red and for bulls is green. You are able to change the width of the candle, its wick
FREE

The indicator displays volume profiles based on the nesting principle. Profiles periods are pre-set so that each subsequent profile has a length twice as long as the length of the previous profile. In addition to profiles, the indicator displays volume clusters sorted by color, depending on the volume they contain.
Indicator operation features The indicator works on typical timeframes from M5 to MN, but for calculations uses historical data from smaller timeframes: M1 - for timeframes from M5
FREE

BEHOLD!!!
One of the best Breakout Indicator of all time is here. Multi Breakout Pattern looks at the preceding candles and timeframes to help you recognize the breakouts in real time.
The In-built function of supply and demand can help you evaluate your take profits and Stop losses
SEE THE SCREENSHOTS TO WITNESS SOME OF THE BEST BREAKOUTS
INPUTS
MaxBarsback: The max bars to look back
Slow length 1: Period lookback
Slow length 2: Period lookback
Slow length 3: Period lo
FREE

Easily get all relevant economic events of the current day right into your chart, as markers. Filter what kind of markers do you want: by country (selected individually) and by Importance (High relevance, Medium, Low or any combination of these). Configure the visual cues to your liking. If there is more than one event set to the very same time, their Names will be stacked and you will see the messages merged with the plus (+) sign on the marker. Obviously that long or too much events on the sam
FREE

Indicateur Heiken Ashi MT5 Améliorez votre analyse de marché avec l'indicateur Heiken Ashi MT5. Cet outil puissant transforme les données de prix standard en bougies plus lisses et orientées tendance, facilitant ainsi l'identification des tendances du marché et des points de retournement potentiels. Principales caractéristiques: Identification claire des tendances: Distinguez visuellement les tendances haussières et baissières grâce à différentes couleurs de bougies. Réduction du bruit: Filtrez
FREE

Bienvenue sur HiperCube Renko Candles
Cet indicateur vous fournit une véritable information sur la transformation du marché en Renko Candle Style.
Définition Les graphiques Renko sont un type de graphique financier qui mesure et trace les variations de prix, en utilisant des briques (ou des barres) pour représenter les mouvements de prix. Contrairement aux graphiques en chandeliers traditionnels, les graphiques Renko n'affichent pas d'informations temporelles, se concentrant uniquement sur
FREE

This is RSI with alarm and push notification -is a indicator based on the popular Relative Strength Index (RSI) indicator with Moving Average and you can use it in Forex, Crypto, Traditional, Indices, Commodities. You can change colors to see how it fits you. Back test it, and find what works best for you. This product is an oscillator with dynamic overbought and oversold levels, while in the standard RSI, these levels are static and do not change.
This allows RSI with alarm and push notific
FREE

I've combined two trading strategies, the Order Block Strategy and the FVG Trading Strategy, by utilizing a combination of the FVG indicators and Order Blocks. The results have been surprisingly effective.
This is a two-in-one solution that makes it easy for traders to identify critical trading zones. I've optimized the settings so that all you need to do is install and trade; it's not overly complex to explain further. No need for any usage instructions regarding the trading method. You shou
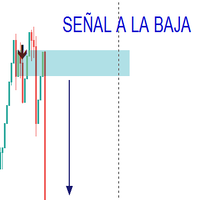
El indicador trabaja con patrones funcionales y divergentes obteniendo del mercado las mejores señales para compra y venta, ha sido testeado por 2 años mediante la estrategias personalizada. El indicador envia la señal para la compra y venta de acuerdo al analisis desarrollado en el mercado. Solo ha sido comprobado en el mercado de indice sintetico (CRASH, BOOM VOLATILITY, STEP)
FREE

Are you tired of drawing Support & Resistance levels for your Quotes? Are you learning how to spot Support & Resistances? No matter what is your case, Auto Support & Resistances will draw those levels for you! AND, it can draw them from other timeframes, right into you current chart, no matter what timeframe you are using... You can also Agglutinate regions/zones that are too much closer to each other and turning them into one single Support & Resistance Level. All configurable.
SETTINGS
Time
FREE

Chart Symbol Changer pour MT5 est un indicateur/utilitaire qui vous offre la possibilité de changer le symbole graphique actuel qui est attaché en cliquant sur un bouton de symbole sur son panneau. Chart Symbol Changer pour MT5 vous donne la possibilité de configurer les 32 boutons de symboles selon vos préférences personnelles, en ajoutant les paires que vous souhaitez surveiller et échanger le plus. De cette façon, vous ne manquerez jamais une opportunité, car vous pouvez avoir une vue
FREE

BeST_Oscillators Collection is a Composite MT5 Indicato r including the Chaikin , Chande and TRIX Oscillators from which by default Chaikin and TRIX Oscillators but not Chande Momentum Oscillator are contained in MT5 platform. It also provides for each Oscillator the option of displaying or not a Mov. Average as a Signal Line and the resulting Signals as Arrows in a Normal (all arrows) or in a Reverse Mode (without showing up any resulting successive and of same type arrows).
Analytically f
FREE

Quarterly Cycles
Quarterly Cycles is based on the Quarterly Theory developed by Daye ( traderdaye on X ). This is an aid to the user to find Cycles and it is NOT automatic detected, user can select AMDX or XAMD in each Cycle and it will be visually drawn on the chart. Quarterly Cycles: Yearly, Monthly, Weekly, Daily, 6 Hour (90 minutes)
– Yearly Cycle : The year is divided in four sections of three months each Q1 - January, February, March Q2 - April, May, June Q3 - July, August, Sept

Engulfing Candle Detector
Detectable pattern Double Candlestick Patterns Bullish Engulfing
The first candle is black candle. The second candle opens with a gap below the real body of the black candle but rallies upwards to close above the real body of the black candle. In other words, the second candle's real body completely engulfs the first candle's real body Bearish Engulfing
The first candle is white candle. The second candle opens with a gap above the real body of the white candle but
FREE

L'indicateur KPL Swing est un système de négociation mécanique simple suivant les tendances qui automatise l'entrée et la sortie. Le système travaille avec une stop-loss stricte et une stop-loss en arrière-plan pour sortir avec des transactions rentables. Aucun objectif n'est donné car personne ne sait jusqu'où (ou jusqu'où) le prix peut se déplacer. Une stop-loss en arrière-plan verrouille les gains et élimine les émotions de la négociation. Converti à partir de l'indicateur Amibroker avec modi
FREE

Graph configuration and buy and sell signals based on Stormer's (Alexandre Wolwacz, Brazilian trader) swing, position and day trade strategy, described on his youtube channel (https://www.youtube.com/watch?v= 0QZ_NjWkwl0)
The buy and sell indications are based on 2 candle patterns ( Inside Bar [Yellow] and Reversal Closing Price [Blue and Red] ), 3 Moving Averages and 1 Stochastic .
Indicators: Inside Bar - Candle pattern indicating trend continuity, or reversal Reversal Closing Price - Ca
FREE

Line Profit Indicator of the visual line of profit in the deposit currency. Works only if there are open positions in the market for the symbol on which the indicator is installed. You can move the line with the mouse or enable automatic tracking of the Bid price. Description of indicator settings: colotLine - line color WidthLine - line width colotText - text color FontSize - the height of the text Anchor - an anchor method for text FollowBid - follow the Bid price
FREE

The Pivot Point indicator automatically calculates and displays the pivot point line and support and resistance levels. Pivot can be calculated according to the Classic, Floor, Fibonacci, Woodie, Camarilla or DeMark formula. It is also possible to select the period for calculating the indicator. A trader can choose from daily, weekly, monthly, or user-defined periods.
Types of pivots Classic Floor Fibonacci Woodie Camarilla DeMark
Main features The indicator shows the current and histor
FREE

Buy Sell Signal Low TF gives buy/sell signals and alerts with up and down arrow at potential reversal of a pullback or a trend continuation pattern in low timeframe. This is an indicator which gives signals based on trend => It works best in trend market with the principle is to ride on the trend not trade against the trend.
The components of Buy Sell Signal Low TF: - The trend is determined by SMMA 13 , SMMA 21 and SMMA 35 ( can be changed manually to suit your preference). - The signal is
FREE

SUPERTREND ; C'est un indicateur de suivi de tendance basé sur l'ATR SuperTrend créé par Olivier Seban. Il peut être utilisé pour détecter les changements de direction de la tendance et localiser les arrêts. Lorsque le prix tombe en dessous de la courbe indicatrice, il devient rouge et indique une tendance à la baisse. À l'inverse, lorsque le prix se déplace au-dessus de la courbe, l'indicateur passe au vert, indiquant une tendance haussière. Comme d'autres indicateurs, il fonctionne bien sur Su
FREE

O indicador criado por Didi Aguiar, o mestre das Agulhadas!
O padrão do indicador é o cruzamento de três médias móveis simples. Média rápida, período 3. Média normalizada, período 8. Média lenta, período 20.
Quando as três médias se cruzam próximas o suficiente, acontece a agulhada! Pela posição das médias é possível identificar: Agulhada de compra, agulhada de venda, ponto falso e beijo da mulher aranha.
Quer saber mais? Procure pelo site dos robôs oficiais da Dojistar: tradesystembots.co
FREE

One of the most powerful and important ICT concepts is the Power of 3. It explains the IPDA (Interbank Price Delivery Algorithm) phases. PO3 simply means there are 3 things that the market maker's algorithm do with price:
Accumulation, Manipulation and Distribution
ICT tells us how its important to identify the weekly candle expansion and then try to enter above or below the daily open, in the direction of the weekly expansion.
This handy indicator here helps you keep track of the weekly

hello,
king binary sureshot mt5 binary indicator,
1 minute candle
1 minute expire
Alright. This indicator works on MT5 and is very easy to use. When you receive a signal from it, you wait for that candle with the signal to close and you enter your trade at the beginning of the next new candle. A red arrow means sell and a green arrow means buy. All arrows comes with a long dotted like for easy identification of trade signal. Are you okay with that?
FREE

Recevez des alertes lorsqu'une tendance éclate. Cet indicateur signale lorsque le prix effectue un mouvement important dans le sens de la tendance dominante. Ces signaux peuvent servir de points d'entrée, ou de points à ajouter à une position existante dans une tendance.
Remarque: Le suivi de tendance a un faible taux de victoire (moins de 50%), mais le rendement de la transaction gagnante moyenne est généralement 3 à 5 fois plus important que la transaction perdante moyenne.
Configuration
FREE

This is an indicator for Quasimodo or Over and Under pattern. It automatically finds the swing points and can even place virtual trades with stop loss and take profit. Press the "Optimize" button to automatically find the most effective settings. The pattern consists of four legs A,B,C,D as shown in the pictures. Open and close prices of the virtual trades are Bid price but the statistics in Display Panel take current spread into account. Its parameters are explained below. Buffer - Pips dista
FREE
MrGoldTrend is a sophisticated trend-following indicator designed exclusively for XAUUSD (Gold) traders on the MQL5 platform. With clear, easy-to-interpret visual signals, this indicator helps you quickly identify the prevailing trend and make informed trading decisions on the H1 timeframe. MrGoldTrend’s gold lines indicate an uptrend, while blue lines signify a downtrend, providing immediate visual clarity for trend direction. Key Features: Clear Trend Visualization : Gold lines for uptrends, b
FREE

HiperCube AutoTrend Lines Cet indicateur vous aide à identifier facilement les supports et les résistances, à tracer des lignes dans le graphique et à savoir où se trouve un point important sur le marché. Cet outil est le meilleur moyen d'automatiser partiellement votre trading, en faisant une partie du travail à votre place. La résistance ou le support sont des niveaux importants qui sont parfois difficiles à identifier, mais maintenant cela ne vous causera plus de confusion
HiperCube Autotr
FREE

Detailed Description: The Pivot Points Indicator is designed for traders who rely on pivot points, midpoints and support/resistance levels for their trading strategies. By automatically calculating and plotting these levels (based on the previous period's high, low, and close prices) , the indicator provides a clear, visual representation of critical price areas where the market may reverse or break out.The tool is particularly useful for day traders and swing traders looking to base the
FREE

Cybertrade Keltner Channels - MT5 Created by Chester Keltner, this is a volatility indicator used by technical analysis. It is possible to follow the trend of financial asset prices and generate support and resistance patterns. In addition, envelopes are a way of tracking volatility in order to identify opportunities to buy and sell these assets.
It works on periods longer than the period visible on the chart. All values are available in the form of buffers to simplify possible automations.
FREE

Il s'agit d'un indicateur MTF des niveaux de support et de résistance basé sur les extremums de l'indicateur Advanced ZigZag Dynamic et/ou Extended Fractals avec des étiquettes de prix (peut être désactivé). Des TF plus élevés peuvent être sélectionnés pour le mode MTF. Par défaut, les niveaux sont générés en fonction des points indicateurs ZigZag. Les points indicateurs de fractales peuvent également être utilisés avec ZigZag ou à sa place. Afin de simplifier l'utilisation et d'économis

Alligator Window Indicator : Potencialize suas análises no MetaTrader com o Alligator Window. Este indicador coloca o clássico Alligator de Bill Williams em uma janela separada, permitindo uma visualização mais clara e organizada. Ideal para traders que buscam precisão e eficiência em suas operações, o Alligator Window proporciona insights nítidos e facilita a identificação de tendências sem poluir o gráfico principal. Experimente agora e leve suas estratégias de trading a um novo patamar!
FREE

the AK CAP toolbox free to use;
it includes the same indicators we use for our daily trading and we think the simpler the better. Lightweight indicator for use on all timeframes. that includes VWAP with vwap value indicator on top right. 3 EMA: FAST, MEDIUM, SLOW the candle timer to show how much time left in a candle.
colors and positions are fully customizable.
enjoy
FREE
It is a very simple indicator to display daily loss percentage, open position loss percentage, monthly loss percentage and monthly profit percentage. MT4 version
We assure you that we welcome any suggestions to improve this indicator and make the necessary changes to improve this indicator.
You can contact us via Instagram, Telegram, WhatsApp, email or here. We are ready to answer you.

Volume Delta Candles offer a straightforward way to analyze trading activity within each candle, making it easier to see what's happening without needing an extra volume indicator. This tool uses lower timeframe or real-time data to show the percentage of buying and selling volume within a candle as a colored bar. Make sure you understand Volume and Volume Delta before jumping in. If you’re not sure, reach out to me first for a quick rundown. But if you're already familiar, you're good to go! Ke

This indicator shows the TLH and TLL and some trendlines that allow us to estimate the trend of market. It also shows the values of the angles of the lines in percentage in points (pip) , the standard deviation, and the trend of each line, and when it breaks the lines of support and resistance (TLH and TLL). And finally, it also shows the points identified as supports and resistances through the fractal algorithm in the graph. The high and low trend lines are supported by the highs and lows, th
FREE

This is a well-known ZigZag indicator. But it differs by the fact that its plot is based on values of the middle line which is set by a user. It can display Andrews’ Pitchfork and standard or Bobokus Fibo levels. NO REPAINTING.
Parameters Period МА — middle line period. Default value is 34. Minimum value is 4. Maximum value is set at your discretion. Used to calculate price — type of price used for the midline calculations. The averaging method — type of smoothing for the middle line. Turning

Introduction
The PF Maximizer is a game-changing non-repainting technical tool engineered to help traders distinguish genuine trend signals from erratic market fluctuations. By employing sophisticated algorithms and cutting-edge data analysis, this indicator efficiently filters out unwanted noise, empowering traders to identify the precise starting and ending points of substantial market moves.
Signal
Potential buy signal is generated when moving average is going up and the blue line c
FREE

A very simple indicator, but one that cannot be missed when carrying out your operations.
Fast and accurate Spreed information before entering a trade as well as the time to start another candlestick.
Spread refers to the difference between the buy (purchase) and sell (offer) price of a stock, bond or currency transaction.
Come and see our mql5 signals too. https://www.mql5.com/pt/signals/899841?source=Site +Signals+From+Author
FREE

Dessinez des points pivots Traditionnels, Fibonacci, Woodie, Classic, Demark, Camarilla pour n'importe quelle période.
Supporte tous les types de pivot : Traditionnel, Fibonacci, Woodie, Classic, Demark, Camarilla. Supporte tous les cadres temporels (M1...H1...D1...MN1...Annuel) Supporte l'heure d'été du serveur Support de la section quotidienne du forex de l'ouverture de Sydney à la fermeture des États-Unis Support Crypto trading Remplir l'écart entre le pivot et la tendance, très utile
Le
FREE

BEHOLD!!!
One of the best Breakout Indicator of all time is here. Multi Breakout Pattern looks at the preceding candles and timeframes to help you recognize the breakouts in real time.
The In-built function of supply and demand can help you evaluate your take profits and Stop losses
SEE THE SCREENSHOTS TO WITNESS SOME OF THE BEST BREAKOUTS
INPUTS
MaxBarsback: The max bars to look back
Slow length 1: Period lookback
Slow length 2: Period lookback
Slow length 3: Period lookbac
FREE

Closing Price Reversal is a very well known and traded candlestick pattern. This little indicator paints with specific (user-selected) colors the Closing Price Reveral Up and Down patterns, as well as the Inside Bars (as a bonus). Higher timeframes are more effective as with all other candlesticks patterns. Do NOT trade solely on this indicator. Search the web for "Closing Price Reversal" to learn about the several approaches that can be used with this pattern. One of them is combining short/me
FREE

Peak Trough Analysis is the great tool to detect peaks and troughs in your chart. Peak Trough Analysis tool can use three different peaks and troughs detection algorithm. The three algorithm include the orignal Fractals Indicator by Bill Williams, the Modified Fractals indicator and ZigZag indicator. You can use this peak and trough analysis tool to detect the price pattern made up from Equilibrium Fractal-Wave process. For further usage, there are good guide line on how to use this peak trough
FREE
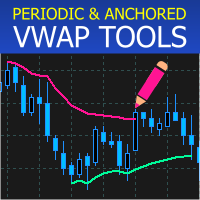
VWAP Tools features Daily VWAP , Weekly VWAP , Monthly VWAP , Anchored VWAP , VWAP by session and Drawing Panel to add, remove and change properties of multiple anchored VWAPs in a single indicator. With the panel of VWAP Tools you can: Draw VWAPs with a specific time interval or extend the VWAPs to the current bar time Change the properties of each VWAP individually Select a VWAP by clicking over it Delesect a VWAP by clicking anywhere on the chart Use any VWAP already drawn on the chart to dra
FREE

This is the forex visual orders tool & forex position size (lot) calculator with intuitive panel. Risk Reward Ratio Indicator works on all kind of symbols: currency pairs, indices, metals, commodities, cryptocurrencies, etc.
If you want to make sure that Risk Reward Ratio Indicator works on your favorite symbols contact us ( visit our profile ) and ask for 7-day free trial to test this tool without limits. If you want to place orders easier, faster and more intuitive? If you like to mark tr

The Zero-Lag MA Trend Levels indicator combines a Zero-Lag Moving Average (ZLMA) with a standard Exponential Moving Average (EMA) to provide a dynamic view of the market trend. This indicator automatically plots the EMA and ZLMA lines on the chart. The colors of the lines represent the market trend.
With EMA: ++ green (uptrend) when EMA > zlma ++ red (downtrend) when EMA < zlma With ZLMA: ++ green (uptrend) when the line is trending up ++ red (downtrend) when the line is trending down
When

This indicator draw a line on high and low levels of X number of days. It is possible to have an alert (in the software and mobile app) for when the price breaks the high or low of the current day. Configurações: Days - past days to calculate (1 = actual day only).
Alert when reach levels - activate the alert for specific levels or both.
Push notification - enable the alert to the mobile MT5 app.
Appearance
High - high level color.
Low - low level color.
Size actual day - thi
FREE

Line function - shows on the chart the lines of Opening, Stop Loss, Take Profit. With this function, it is easy to create a new order and see its additional characteristics before opening. TP and SL - sets the relationship of Take Profit to Stop Loss. This allows you to set the size of the profit relative to the loss in pips.
the opening line will appear when all conditions are met TP1, TP2, TP3, TP4 and SL are manually specified in pips. buying or selling is done at the closing price of th
FREE
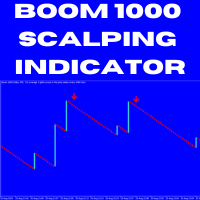
DC Boom 1000 Scalping Strategy Guide **Price**: $30 **Contact**: WhatsApp/Telegram: +27683229304 WhatsApp/Telegram: +27671192993 1. Understanding the Boom 1000 Index Boom 1000 Index: A synthetic index known for generating upward spikes. This strategy focuses on capturing the brief downward movements between spikes by selling when specific signals appear. 2. Timeframe M1 Timeframe: This strategy is exclusively designed for the 1-minute (M1) chart, allowing you to make quick trades and capture sma

Market volume profile indicator. It works on almost all instruments - currency pairs, stocks, futures, on real volumes and on ticks. It can be set as automatic determination of the range of building a profile, for example, for a week or a month, etc. and set the range manually by moving the borders (two vertical lines red and blue). Shown as a bar graph. The width of the histogram at a given level means, conventionally, the number of trades made on it. With the "Mode level line color" para

Boom and Crash Gold miner v2 Trading indicator based on market momentum works on m1 for boom and crash 1000 and M5 time frame for normal trading pairs wait for blue arrow to appear plus change of candle stick color and candlesticks must be above the 2 modified moving averages then you can buy the market. wait for orange arrow to appear plus change of candle stick color and candlesticks must be below the 2 modified moving averages then you can sell the market.

Highly configurable Stochastic indicator.
Features: Highly customizable alert functions (at levels, crosses, direction changes via email, push, sound, popup) Multi timeframe ability Color customization (at levels, crosses, direction changes) Linear interpolation and histogram mode options Works on strategy tester in multi timeframe mode (at weekend without ticks also) Adjustable Levels Parameters:
Stochastic Timeframe: You can set the lower/higher timeframes for Stochastic. Stochastic Bar
FREE

Original supertrend indicator in Tradingview platform. Indicator type: Price Action indicator Introduction: The Supertrend Indicator - Enhancing Your Trend Analysis. If you haven't yet found a Supertrend indicator with good graphics on the MQL5 platform, this is the indicator for you. Overview: The Supertrend Indicator is a powerful tool designed to provide traders with valuable insights into the current and historical trends of financial markets. It serves as a valuable addition to any t
FREE

The famous brazilian trader and analyst Didi Aguiar created years ago a study with the crossing of 3 Simple Moving Averages called "Agulhada do Didi", then later was also named Didi Index, as a separate indicator. The period of those SMAs are 3, 8 and 20. As simple as that, this approach and vision bring an easy analysis of market momentum and trend reversal to those traders looking for objective (and visual) information on their charts. Of course, as always, no indicator alone could be used wit
FREE

A Heatmap with a Volume Profile is like a thermal imager or x-ray machine. It will help you to estimate the relative distribution of volume during the price movement and to understand the relationship between volume and price. Indicator Volume Profile "Volumos Maxima" is a powerful tool for analyzing this relationship. After simple experimentation with heatmap, you can find that each trading instrument has its own “ characteristic ” way of distributing volume. And this will help you to make a b

Advanced Stochastic Scalper MT5 is a professional indicator based on the popular Stochastic Oscillator. Advanced Stochastic Scalper is an oscillator with dynamic overbought and oversold levels, while in the standard Stochastic Oscillator, these levels are static and do not change. This allows Advanced Stochastic Scalper to adapt to the ever-changing market. When a buy or a sell signal appears, an arrow is drawn on the chart and an alert is triggered allowing you to open a position in a timely ma

The indicator automatically plots significant trend lines and displays buy and sell signals. Signals are generated for reflection and breakdown from support and resistance lines. When a signal appears, the indicator displays it as an arrow of the specified color and also sends the message type specified in the input parameters. In the indicator settings, you can set the signal type, the maximum distance to the trend line, the type of notifications, as well as the settings for lines and ar
FREE
The Omega Trend Indicator is an advanced tool that has been specifically designed to detect market trends early, and follow them efficiently. The indicator draws two lines. The main (thicker) Trend Line represents the presumed lower or upper volatility limits of the current market trend. A break in the main Trend Line indicates a potential reversal or shift in the movement of the trend. The Trend Line also indicates the best point to place a stop loss order. In Omega Trend Indicator, the Trend L
FREE

T he most Flexible & Reliable Trend-Based Fibonacci indicator by Safe Trading. This indicator helps you calculate Trend-Based Fibonacci levels base on the main and retracement trends to predict future price . If you just looking for a simple Fibonacci Retracement indicator, please use this Free indicator .
### FEATURES ### Auto-calculate up to 7 Trend-Based Fibonacci levels on adjustable frame. Adjust Fibonacci levels as your need. Adjust the start and the end of calculated frame
FREE

Check my version of the moving average convergence divergence (MACD) indicator based on Heikin Ashi calculations. Here you find multi-colored histogram which corresponds to bull (green) / bear(red) trend. Dark and light colors describes weakness/strenght of price trend in time. Also you can switch calculations between normal and Heikin Ashi price type.
Note: Buffers numbers for iCustom: 0-MACD, 2-Signal line
FREE
Stochastic Alert Indicator for MetaTrader 5
The Stochastic Alert Indicator is a powerful and customizable tool designed for the MetaTrader 5 platform, perfect for traders who want to monitor overbought and oversold conditions while staying informed of potential buying and selling pressure. Key Features: Overbought/Oversold Detection: Automatically detects when the market reaches overbought (above 80) or oversold (below 20) levels, providing you with timely alerts for potential reversal points
FREE

Savoir où sont les niveaux importants comme les plus hauts et bas du jours précédent ou de la semaine permettent une meilleur prise de setup de trading.
Cet indicateur permet d'afficher Haut et bas du jour précédent Haut et bas de la semaine précédente
Congifuration High & Low for: Previous day, week Line Style, color Label position, size, color Questions, commentaires, envoyez moi un message en direct ici: https://www.mql5.com/en/users/mvonline
FREE

CPR Pivot Lines It Will Draw Pivot Point R1,R2,R3 S1,S2,S3 Tc Bc Best Part Is That You Can Even Add Values Of High,Low,Close Manually Also To Get Your All Levels On Chart.So If Your Broker Data Of High ,Low ,Close Is Incorrect Then You Don’t Have To Depend On Them Anymore. You Can Even Modify All Lines Style. It Will Show Line In Floting Style And Not Continues Mess.
FREE
Le MetaTrader Market offre un lieu pratique et sécurisé pour acheter des applications pour la plateforme MetaTrader. Téléchargez des versions démo gratuites de Expert Advisors et des indicateurs directement depuis votre terminal pour les tester dans le testeur de stratégie.
Testez les applications dans différents modes pour surveiller les performances et effectuez un paiement pour le produit que vous souhaitez en utilisant le système de paiement MQL5.community.
Vous manquez des opportunités de trading :
- Applications de trading gratuites
- Plus de 8 000 signaux à copier
- Actualités économiques pour explorer les marchés financiers
Inscription
Se connecter
Si vous n'avez pas de compte, veuillez vous inscrire
Autorisez l'utilisation de cookies pour vous connecter au site Web MQL5.com.
Veuillez activer les paramètres nécessaires dans votre navigateur, sinon vous ne pourrez pas vous connecter.