Regardez les tutoriels vidéo de Market sur YouTube
Comment acheter un robot de trading ou un indicateur
Exécutez votre EA sur
hébergement virtuel
hébergement virtuel
Test un indicateur/robot de trading avant d'acheter
Vous voulez gagner de l'argent sur Market ?
Comment présenter un produit pour qu'il se vende bien
Indicateurs techniques pour MetaTrader 5 - 5

This indicator is converted from UT Bot alerts indicator by @QuantNomad of Trading View to MT5. its considering ATR and creating new candles on chart and also is giving good entry points based on its candles. all buffers of new candles and also entry signals are included as buffer so can be used easily on any EA. there are also some different strategies on the internet that can be used or contact me to create it for you.

Easy Market makes the market easier to trade. It allows you to see an "eternally" side (no trend) market, making it extremely easy to see when the price is overbought or oversold. Both trend and consolidation traders will like Easy Market. You can use it as an auxiliary window (below chart) or in full screen mode. See the screenshots and note how it gives you accurate entries! If you have any doubt or suggestion, please, contact us! Ejoy!

Spike Catch Pro 22:03 release updates Advanced engine for searching trade entries in all Boom and Crash pairs (300,500 and 1000)
Programmed strategies improvements Mx_Spikes (to combine Mxd,Mxc and Mxe), Tx_Spikes, RegularSpikes, Litho_System, Dx_System, Md_System, MaCross, Omx_Entry(OP), Atx1_Spikes(OP), Oxc_Retracement (AT),M_PullBack(AT) we have added an arrow on strategy identification, this will help also in the visual manual backtesting of the included strategies and see h
FREE

his is a custom indicator based on double-average crossing and arrow marking.
Make multiple lists when blue arrows appear up.
Make a blank list when the red arrow appears down.
When the pink line crosses the green line upwards, the pink line is above, the green line is below, the golden fork appears, and the blue arrow appears.
When the pink line crosses down through the green line, the pink line is below, the green line is above, a dead fork appears, and a red arrow appears.
This is
FREE

Candle Time CountDown By BokaroTraderFx The Candle Timer Countdown Indicator is a versatile tool designed for the MetaTrader 5 (MT5) trading platform. It provides traders with a visual countdown of the remaining time for the current candle on a chart. The key features include:
Customizable Position: Place the countdown timer in any corner of the chart for optimal visibility. Default Text Color: Set to red for clear visibility, with options for further customization. Minimal Display: Shows onl
FREE

The Volume Weighted Average Price is similar to a moving average, except volume is included to weight the average price over a period. Volume-Weighted Average Price [VWAP] is a dynamic, weighted average designed to more accurately reflect a security’s true average price over a given period . Mathematically, VWAP is the summation of money (i.e., Volume x Price) transacted divided by the total volume over any time horizon, typically from market open to market close.
VWAP reflects the capital
FREE
Débloquez une nouvelle dimension du trading avec notre indicateur MQL5 de pointe, Range BreakOut MT5
Cet outil puissant est conçu pour identifier et capitaliser sur les mouvements de prix lorsqu'ils sortent des fourchettes établies,
vous offrant la précision et la confiance nécessaires pour prospérer dans le monde dynamique des marchés financiers.
Version MT4 : WH Range BreakOut MT4
Caractéristiques:
Détection précise de la portée. Signaux de rupture en temps réel. Paramètres personn

Enjoy the Free Candle Color indicator.
Kijun Sen is an element of Ichimoku Kinko Hyo Indicator, it's far too complicated for many traders hence they tend to be confused. We have simplified it so the Kijun Sen will change colors as it activates without the Tenkan Sen, Senkou Span, Up Kumo and Down Kumo. Customize to your period parameter and colors of your choice. Great for beginners and seasoned traders. Set your period and enjoy
GOOD LUCK and ALL THE BEST IN YOUR TRADING JOURNEY !!!!!
FREE

Fractals Dynamic Fractals Dynamic – est un indicateur fractal gratuit modifié par Bill Williams, dans lequel vous pouvez définir manuellement le nombre de barres à gauche et à droite, créant ainsi des modèles uniques sur le graphique. Désormais, toutes les stratégies de trading basées sur ou basées sur l'indicateur Fractals Dynamic auront un signal supplémentaire.
De plus, les fractales peuvent agir comme niveaux de support et de résistance. Et dans certaines stratégies de trading, affiche
FREE

With this easy to set up indicator you can display and set alerts for the following candlestick formations: Bull Breakout, Bear Breakout, Hammer, Pin, Bullish Engulfing, Bearish Engulfing. Input parameters: ShortArrowColor: The color of the Arrows, displaying a Bearish candle formation LongArrowColor: The color of the Arrows displaying a Bullish candle formation BullishEngulfing: Disabled/Enabled/EnabledwithAlert BearishEngulfing: Disabled/Enabled/EnabledwithAlert Pin: Disabled/Enabled/Enabledw
FREE

Libérez le Potentiel de vos Transactions avec l'Indicateur AlphaWave ! Apportez de la Sérénité à vos Transactions : L'Indicateur AlphaWave est conçu pour apporter du calme à vos transactions en lissant le graphique et en offrant une lecture précise de la direction de la tendance. Prendre des décisions de trading claires n'a jamais été aussi facile. Technologie de Lissage Révolutionnaire avec 10 Modes : Découvrez une présentation fluide et claire du graphique avec l'Indicateur AlphaWave. La techn

** All Symbols x All Time frames scan just by pressing scanner button ** *** Contact me to send you instruction and add you in "Swing scanner group" for sharing or seeing experiences with other users. Introduction: Swing Scanner is the indicator designed to detect swings in the direction of the trend and possible reversal swings. The indicator studies several price and time vectors to track the aggregate trend direction and detects situations in which the market is oversold or overbou

Market Profile 3 MetaTrader 5 indicator version 4.70— is a classic Market Profile implementation that can show the price density over time, outlining the most important price levels, value area, and control value of a given trading session. This indicator can be attached to timeframes between M1 and D1 and will show the Market Profile for daily, weekly, monthly, or even intraday sessions. Lower timeframes offer higher precision. Higher timeframes are recommended for better visibility. It is als
FREE

This is Heiken Ashi smoothed version, where you can choose on what type smoothness you want to make your strategy base. You can choose between EMA or MA, on the period you want. And you can choose colors.
Definition:
The Heikin-Ashi technique averages price data to create a Japanese candlestick chart that filters out market noise. Heikin-Ashi charts, developed by Munehisa Homma in the 1700s, share some characteristics with standard candlestick charts but differ based on the values used to
FREE

This is one of the most popular and highly rated volatility index (VIX) indicators on the market. It provides the same readings as the VIX does for stock indexes. However, this indicator works across all asset classes. VIX Fix Finds Market Bottoms. This indicator is not for inexperienced traders. Use it for day and swing trading. MT4 Version - https://www.mql5.com/en/market/product/112238 Bernard Baruch summed it out best: "Markets fluctuate." The Chicago Board Options Exchange (CBOE) Vo
FREE

This Indicator is based on 4 Exponential Moving Averages ie. 3 EMA-32 (applied to prices close, high & low), and EMA-200 (indicating trend direction). The EMA32-200 produces quality buy and sell entries indicated by arrows and signal alert that appears whenever the price moves above the EMA-200 and returns below the EMA-32s and returns to break above the previous swing high triggering a high probability buy entry. The Sell conditions are the opposite of the buy conditions.
FREE

Are you tired of drawing Support & Resistance levels for your Quotes? Are you learning how to spot Support & Resistances? No matter what is your case, Auto Support & Resistances will draw those levels for you! AND, it can draw them from other timeframes, right into you current chart, no matter what timeframe you are using... You can also Agglutinate regions/zones that are too much closer to each other and turning them into one single Support & Resistance Level. All configurable.
SETTINGS
Time
FREE

Free automatic Fibonacci is an indicator that automatically plots a Fibonacci retracement based on the number of bars you select on the BarsToScan setting in the indicator. The Fibonacci is automatically updated in real time as new highest and lowest values appears amongst the selected bars. You can select which level values to be displayed in the indicator settings. You can also select the color of the levels thus enabling the trader to be able to attach the indicator several times with differe
FREE

Welcome to Propsense, the best solution for new and veteran traders with a simple FREE strategy! NEW to MT5! This indicator is a unique and affordable trading tool built on the teachings of a former bank trader. With this tool, you will be able to see inefficient points with ease. Additionally, traders will have a clean Heads Up Display which will show your running and closed P/L in pips AND currency units. As a highly requested option, a candle timer has been added which will allow you to j

L'indicateur trouve les niveaux de volume de prix maximum et minimum (profil de marché) sur l'histogramme de travail pour le nombre de barres spécifié. Profil composite. La hauteur de l'histogramme est entièrement automatique et s'adapte à n'importe quel outil et période. L'algorithme de l'auteur est utilisé et ne répète pas les analogues connus. La hauteur des deux histogrammes est approximativement égale à la hauteur moyenne de la bougie. Smart alert vous permet de vous informer sur le prix
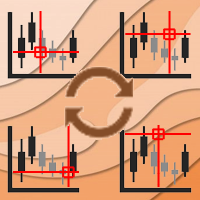
Async Charts is an indicator to synchronize charts and display a customized crosshair (cursor) on all selected charts. This is a useful utility for traders using multiple timeframes of analyzing multiple symbols for trade entry or exit.
Main Features : Real time Crosshair Synchronization on All Selected Charts
Supports Multiple Timeframes and Multiple Symbols at the same time
Auto Scroll Option
Graphical Adjustment of Color, Font, Size, ...
Locking All or Locking Specific Charts
More and

MASpeed est une moyenne mobile universelle, avec indication de vitesse de déplacement. Les points sur la ligne apparaissent lorsque la moyenne se déplace plus vite que le seuil. Le seuil peut être spécifié dans les paramètres. Sur la base de cet indicateur, vous pouvez construire une variété de stratégies de trading. L'indicateur présente d'énormes possibilités pour ajuster la moyenne mobile - 10 types de lissage. 12 options de prix pour construire. Ajout de la possibilité de discrétiser le mouv
FREE

The indicator displays the orders book, as well as increases its depth, remembering the location of orders that have gone beyond the current "window" view.
Indicator capability Display the levels of open positions. Simulation of placing/cancelling/editing pending orders directly in the displayed orders book.
Indicator features The orders book display works only on those trading symbols for which it is broadcast by the broker. To reset the information about the rows that were recorded in the
FREE
L'indicateur Candle_Timer_and_Spread affiche sur un graphique le temps jusqu'à la fin de la bougie et le pourcentage de variation de prix ainsi que le spread pour les symboles sélectionnés.
Le minuteur pour le temps jusqu'à la fin de la bougie sur la période actuelle et la variation du prix en pourcentage par rapport au prix d'ouverture du jour est situé par défaut dans le coin supérieur droit du graphique. Le panneau affiche l'écart et la variation en pourcentage du prix actuel par rapport à
FREE

Easily get all relevant economic events of the current day right into your chart, as markers. Filter what kind of markers do you want: by country (selected individually) and by Importance (High relevance, Medium, Low or any combination of these). Configure the visual cues to your liking. If there is more than one event set to the very same time, their Names will be stacked and you will see the messages merged with the plus (+) sign on the marker. Obviously that long or too much events on the sam
FREE

This indicator shows the TLH and TLL and some trendlines that allow us to estimate the trend of market. It also shows the values of the angles of the lines in percentage in points (pip) , the standard deviation, and the trend of each line, and when it breaks the lines of support and resistance (TLH and TLL). And finally, it also shows the points identified as supports and resistances through the fractal algorithm in the graph. The high and low trend lines are supported by the highs and lows, th
FREE

Fractal Levels based on Higher Timeframe est un outil puissant conçu pour construire des niveaux de support et de résistance précis basés sur les fractales de l'échelle de temps supérieure, vous fournissant des signaux d'achat et de vente avec des alertes pratiques.
Fonctionnement : L'indicateur analyse les niveaux de fractales sur l'échelle de temps supérieure et les affiche sur votre graphique actuel. Vous pouvez facilement ajuster l'échelle de temps supérieure dans les propriétés de l'indi

本指标 基于 Zigzag 基础上... 增加了: 1.增加了箭头指示,使图表更鲜明 2.增加了价格显示,使大家更清楚的看清价格. 3.增加了报警等设置,可以支持邮件发送 原指标特性: 1.基本的波段指标构型. 2.最近的2个ZIGZAG点不具有稳定性,随着行情而改变,(就是网友所说的未来函数) 3.原指标适合分析历史拐点,波段特性,对于价格波动有一定的指导性.
Zigzag的使用方法一 丈量一段行情的起点和终点 (1)用ZigZag标注的折点作为起点和终点之后,行情的走势方向就被确立了(空头趋势); (2)根据道氏理论的逻辑,行情会按照波峰浪谷的锯齿形运行,行情确立之后会走回撤行情,回撤的过程中ZigZag会再次形成折点,就是回撤点; (3)在回撤点选择机会进场,等待行情再次启动,止损可以放到回撤的高点。 一套交易系统基本的框架就建立起来了。 Zigzag的使用方法二 作为画趋势线的连接点 趋势线是很常见的技术指标,在技术分析中被广泛地使用。 但一直以来趋势线在实战中都存在一个BUG,那就是难以保证划线的一致性。 在图表上有很多的高低点,到底该连接哪一个呢?不同的书上画趋势线的方
FREE

Peak Trough Analysis is the great tool to detect peaks and troughs in your chart. Peak Trough Analysis tool can use three different peaks and troughs detection algorithm. The three algorithm include the orignal Fractals Indicator by Bill Williams, the Modified Fractals indicator and ZigZag indicator. You can use this peak and trough analysis tool to detect the price pattern made up from Equilibrium Fractal-Wave process. For further usage, there are good guide line on how to use this peak trough
FREE

The indicator plots a trend channel using the technique by Gilbert Raff. The channel axis is a first-order regression. The upper and lower lines show the maximum distance the Close line had moved away from the axis line. Therefore, the upper and lower lines can be considered as resistance and support lines, respectively. A similar version of the indicator for the MT4 terminal
As a rule, most movements of the price occur within a channel, going beyond the support or resistance line only for a s
FREE

This indicator draws trading zones based on fractals from higher periods, which simplifies trading by levels.
This indicator draws two types of trading zones on one chart.
For example, if the current period is H1, then trading zones will be searched for by fractals from H4 and D1.
In the standard settings, fractal zones from H4 will be drawn in yellow, and from D1 - in green.
When zones are superimposed, colors are mixed at the intersection of zones. I don’t know how to fix this at the
FREE

Filigrane centralisé
Ajoute un filigrane centré avec le nom de l'actif et la période choisie.
Il est possible de remplacer le type de police, la taille de police, la couleur de police et le caractère de séparation.
Le filigrane est positionné derrière les bougies, ne perturbant pas la visualisation.
Il a un recentrage automatique si la fenêtre est redimensionnée.
J'espère que cet indicateur vous aidera, bon trading ;)
FREE

SUPERTREND ; C'est un indicateur de suivi de tendance basé sur l'ATR SuperTrend créé par Olivier Seban. Il peut être utilisé pour détecter les changements de direction de la tendance et localiser les arrêts. Lorsque le prix tombe en dessous de la courbe indicatrice, il devient rouge et indique une tendance à la baisse. À l'inverse, lorsque le prix se déplace au-dessus de la courbe, l'indicateur passe au vert, indiquant une tendance haussière. Comme d'autres indicateurs, il fonctionne bien sur Su
FREE

Recevez des alertes lorsqu'une tendance éclate. Cet indicateur signale lorsque le prix effectue un mouvement important dans le sens de la tendance dominante. Ces signaux peuvent servir de points d'entrée, ou de points à ajouter à une position existante dans une tendance.
Remarque: Le suivi de tendance a un faible taux de victoire (moins de 50%), mais le rendement de la transaction gagnante moyenne est généralement 3 à 5 fois plus important que la transaction perdante moyenne.
Configuration
FREE

Chart Symbol Changer pour MT5 est un indicateur/utilitaire qui vous offre la possibilité de changer le symbole graphique actuel qui est attaché en cliquant sur un bouton de symbole sur son panneau. Chart Symbol Changer pour MT5 vous donne la possibilité de configurer les 32 boutons de symboles selon vos préférences personnelles, en ajoutant les paires que vous souhaitez surveiller et échanger le plus. De cette façon, vous ne manquerez jamais une opportunité, car vous pouvez avoir une vue
FREE

HiperCube Tornado est là !
HiperCube Tornado est un indicateur simple mais efficace qui vous aide à identifier quand un nouveau pouvoir haussier ou baissier est proche.
Facile à utiliser Couleurs personnalisées Indicateur de fenêtres séparées TEMA est utilisé pour faire des calculs Périodes personnalisées Méthode personnalisée Chat GPT et IA utilisés pour se développer Stratégie Attendez que TI+ croise le TI- Cela signifie, signal d'achat Attendez que TI- croise le TI+ Cela signifie, signal
FREE

hello,
king binary sureshot mt5 binary indicator,
1 minute candle
1 minute expire
Alright. This indicator works on MT5 and is very easy to use. When you receive a signal from it, you wait for that candle with the signal to close and you enter your trade at the beginning of the next new candle. A red arrow means sell and a green arrow means buy. All arrows comes with a long dotted like for easy identification of trade signal. Are you okay with that?
FREE
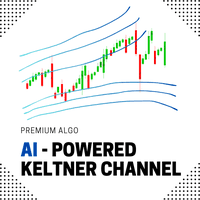
Introducing the AI Keltner Channel , a cutting-edge Forex indicator that leverages machine learning to dynamically calculate Keltner Channels in real-time. Unlike traditional Keltner Channel indicators, which rely on static inputs, the AI Keltner Channel adapts continuously to ever-changing market conditions, providing traders with a more accurate and responsive view of price trends and volatility. Powered by advanced machine learning algorithms, the AI Keltner Channel analyzes historical and re
FREE

The Inside Bar pattern is a very well known candlestick formation used widely by traders all over the world and in any marketplace. This approach is very simple and adds a little confirmation candle, so it adds a third past candlestick to the count to confirm the direction of the move (upward or downward). Obviously, there is no power on this candlestick formation if the trader has no context on what it is happening on the market he/she is operating, so this is not magic, this "radar" is only a
FREE

l'indicateur utilise plusieurs périodes pour analyser les meilleures entrées d'achat au cours du boom 1000. il est conçu pour faciliter le commerce uniquement lors des pics de boom. l'indicateur comporte deux flèches ; les rouges et les bleus. la formation de la flèche rouge indique que vous devriez être prêt pour une flèche bleue qui est un signal d'entrée d'achat. l'indicateur n'offre pas de points de sortie. collectez toujours 3 pips, c'est-à-dire que si vous avez entré une transaction à 102
FREE

Indicator determines the direction of price movement, calculates the possibility of entering the market using an internal formula and displays a breakout entry signal. Indicator signals appear both at the beginning of trend movements and in the opposite direction, which allows you to open and close orders as efficiently as possible in any of the market conditions. Version for МТ4: https://www.mql5.com/en/market/product/58349
Benefits: a unique signal calculation formula; high signal accuracy;
FREE

Bandes VWAP Style visuel 1.0 Les indicateurs des marchés financiers sont des outils essentiels utilisés par les commerçants et les investisseurs pour analyser et prendre des décisions sur les marchés financiers. Le VWAP et les bandes de Bollinger sont deux outils d'analyse technique populaires utilisés par les traders pour mesurer les tendances du marché et la volatilité des prix. Dans ce produit, nous proposons de combiner les deux indicateurs pour créer un produit unique qui fournit une analy

HiLo Activator is a technical analysis indicator developed by Robert Krausz, a renowned hungarian trader with a career in the USA.
It is a trend indicator that helps you to predict the cange of the current trend. In an uptrend it is displayed at the bottom of the candles; in a downtrend it is displayed at the top.
Its only setting is the calculation period.
It is possible to have alerts when a new trend begin. Enjoy! This is a free indicator, but it took hours to develop. If you want to pay m
FREE

The indicator displays volume profiles based on the nesting principle. Profiles periods are pre-set so that each subsequent profile has a length twice as long as the length of the previous profile. In addition to profiles, the indicator displays volume clusters sorted by color, depending on the volume they contain.
Indicator operation features The indicator works on typical timeframes from M5 to MN, but for calculations uses historical data from smaller timeframes: M1 - for timeframes from M5
FREE
The Higher timeframe candle tracker is used to get a glimpse of what the selected higher time frame candle is like. It plot the candle after the current price. It can come in handy for day traders and short term traders that often worry about how the current higher timeframe candle may look like. You can select the higher time frame or lower time frame from the options provided: By default the color for bears is red and for bulls is green. You are able to change the width of the candle, its wick
FREE

Closing Price Reversal is a very well known and traded candlestick pattern. This little indicator paints with specific (user-selected) colors the Closing Price Reveral Up and Down patterns, as well as the Inside Bars (as a bonus). Higher timeframes are more effective as with all other candlesticks patterns. Do NOT trade solely on this indicator. Search the web for "Closing Price Reversal" to learn about the several approaches that can be used with this pattern. One of them is combining short/me
FREE

Was: $69 Now: $34 Blahtech VWAP - Volume Weighted Average Price (VWAP) is the ratio of price to total volume. It provides an average price over a specified time interval. Links [ Install | Update | Documentation ] Feature Highlights
Configurable VWAP Line Sessions, intervals, anchored or continuous Previous day settlement line Standard Deviation bands Alerts at bar close or real time Automatic Broker or Tick volumes Significantly reduced CPU usage
Input Parameters
Expert Advisor

Les niveaux de la plage de pivot central se forment autour d'un point de pivot central.
Ces niveaux par rapport au pivot central peuvent être utilisés pour déterminer de nombreux comportements du marché et les résultats possibles.
La distance par rapport au pivot central et le prix que forment les nouveaux niveaux par rapport aux niveaux du jour précédent peuvent être utilisés pour déterminer la direction et la force de la tendance des jours suivants.
Les plages de pivot central peuvent
FREE

Les lignes de résistance de vitesse sont un outil puissant pour déterminer la tendance et les lignes de résistance. L'indicateur construit des lignes en utilisant des extrema graphiques et des formules Mathématiques spéciales. L'indicateur peut être utilisé pour déterminer la direction de la tendance et les points d'inversion.
<---------------------------->
Paramètres de l'indicateur:
"Depth of search" - profondeur (en barres) de la recherche extrema graphique "Back step of search" - dist
FREE

Indicateur Heiken Ashi MT5 Améliorez votre analyse de marché avec l'indicateur Heiken Ashi MT5. Cet outil puissant transforme les données de prix standard en bougies plus lisses et orientées tendance, facilitant ainsi l'identification des tendances du marché et des points de retournement potentiels. Principales caractéristiques: Identification claire des tendances: Distinguez visuellement les tendances haussières et baissières grâce à différentes couleurs de bougies. Réduction du bruit: Filtrez
FREE
Tool converted from tradingview indicator. Modified version with pivot points calculated in a more intuitive way.
This tool displays relative volatility and directional trend. Excellent way to pickup diversions and reversals. Length can be lowered to 11 or 13 in settings to show price range.
Can be used to identify patterns such as parallel channels and likely direction of price action.

The indicator determines and marks the short-term lows and highs of the market on the chart according to Larry Williams` book "Long-term secrets to short-term trading". "Any time there is a daily low with higher lows on both sides of it, that low will be a short-term low. We know this because a study of market action will show that prices descended in the low day, then failed to make a new low, and thus turned up, marking that ultimate low as a short-term point. A short-term market high is just

Version 1.5: manual color change added
This indicator helps to trade price action and momentum strategies like Guerrilla Trading or similar strategies.
The indicator displays: most recent highs and lows number of consecutive breaks past breaks of most recent highs and lows retest lines flag formations manual color change User can change colors. Go to Indictor Properties/Input, set "Auto Color" to false and change the colors. Set "Auto color" back to true to go back to pre-set colors. Please
FREE

This is a derivative of John Carter's "TTM Squeeze" volatility indicator, as discussed in his book "Mastering the Trade" (chapter 11).
Gray dot on the midline show that the market just entered a squeeze (Bollinger Bands are with in Keltner Channel). This signifies low volatility, market preparing itself for an explosive move (up or down). Blue dot signify "Squeeze release".
Mr.Carter suggests waiting till the first blue after a gray dot, and taking a position in the direction of the mo
FREE

Что такое Heiken Ashi? Heiken Ashi — это метод построения графиков, который можно использовать для прогнозирования будущего движения цены. Он похож на традиционные свечные графики. Однако в отличие от обычного свечного графика, график Heiken Ashi пытается отфильтровать часть рыночного шума для лучшего определения трендовых движений на рынке. Как рассчитать Heiken Ashi?
Heiken Ashi использует формулу COHL, которая означает «Закрытие, Открытие, Максимум, Минимум». Это четыре компонента, кото
FREE

Graph configuration and buy and sell signals based on Stormer's (Alexandre Wolwacz, Brazilian trader) swing, position and day trade strategy, described on his youtube channel (https://www.youtube.com/watch?v= 0QZ_NjWkwl0)
The buy and sell indications are based on 2 candle patterns ( Inside Bar [Yellow] and Reversal Closing Price [Blue and Red] ), 3 Moving Averages and 1 Stochastic .
Indicators: Inside Bar - Candle pattern indicating trend continuity, or reversal Reversal Closing Price - Ca
FREE

This is the forex visual orders tool & forex position size (lot) calculator with intuitive panel. Risk Reward Ratio Indicator works on all kind of symbols: currency pairs, indices, metals, commodities, cryptocurrencies, etc.
If you want to make sure that Risk Reward Ratio Indicator works on your favorite symbols contact us ( visit our profile ) and ask for 7-day free trial to test this tool without limits. If you want to place orders easier, faster and more intuitive? If you like to mark tr
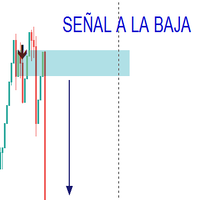
El indicador trabaja con patrones funcionales y divergentes obteniendo del mercado las mejores señales para compra y venta, ha sido testeado por 2 años mediante la estrategias personalizada. El indicador envia la señal para la compra y venta de acuerdo al analisis desarrollado en el mercado. Solo ha sido comprobado en el mercado de indice sintetico (CRASH, BOOM VOLATILITY, STEP)
FREE

The draws trend lines with adjustable trend width, with trend breakout settings and notifications of trend breakout (Alert, Sound, Email) and of a new appeared arrow. Arrows point at the direction of the order to open (BUY, SELL).
Parameters MaxHistoryBars - the number of bars in the history. Depth (0 = automatic settings) - Search area. width trend ( 0 = automatic settings) - Trend width. (true = closed bars on direction trend),(false = just closed bars for line) - true = closure of candlesti

This indicator draw a line on high and low levels of X number of days. It is possible to have an alert (in the software and mobile app) for when the price breaks the high or low of the current day. Configurações: Days - past days to calculate (1 = actual day only).
Alert when reach levels - activate the alert for specific levels or both.
Push notification - enable the alert to the mobile MT5 app.
Appearance
High - high level color.
Low - low level color.
Size actual day - thi
FREE

Engulfing Candle Detector
Detectable pattern Double Candlestick Patterns Bullish Engulfing
The first candle is black candle. The second candle opens with a gap below the real body of the black candle but rallies upwards to close above the real body of the black candle. In other words, the second candle's real body completely engulfs the first candle's real body Bearish Engulfing
The first candle is white candle. The second candle opens with a gap above the real body of the white candle but
FREE

Brick diagram-an alternative way of trading If you are a trader who is confused by the candlesticks in countless charts, or don’t know how to draw lines or how to draw support and resistance lines, you should find another trading method that suits you at this time. NS. Just like a driver will stop for a full overhaul after repeated encounters, the same is true for a transaction. The brick chart provides a simple trading method for intraday traders. In fact, this method has the same history as K-

This is an indicator for Quasimodo or Over and Under pattern. It automatically finds the swing points and can even place virtual trades with stop loss and take profit. Press the "Optimize" button to automatically find the most effective settings. The pattern consists of four legs A,B,C,D as shown in the pictures. Open and close prices of the virtual trades are Bid price but the statistics in Display Panel take current spread into account. Its parameters are explained below. Buffer - Pips dista
FREE

Introduction The "Ultimate Retest" Indicator stands as the pinnacle of technical analysis made specially for support/resistance or supply/demand traders. By utilizing advanced mathematical computations, this indicator can swiftly and accurately identify the most powerful support and resistance levels where the big players are putting their huge orders and give traders a chance to enter the on the level retest with impeccable timing, thereby enhancing their decision-making and trading outcomes.
FREE

This is a simple Candle Stick Pattern Indicator, which shows in the current time period all standardisized Patterns in the chart. All Patterns will be calculatet automatically based on standard conditions. Following Candle Stick Patterns are included: Bullish Hammer | Bearish Hammer Bullish Inverted Hammer | Bearish Inverted Hammer Bullish Engulfing | Bearish Engulfing Piercing | Dark Cloud Cover Bullish 3 Inside | Bearish 3 Inside There are only a few settings at the begining to take. Every Pat
FREE
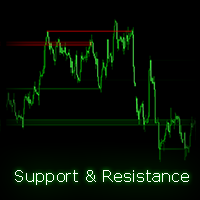
Cet indicateur trouve et trace automatiquement les canaux de support et de résistance sur votre graphique, facilitant ainsi l'identification des niveaux clés. L'indicateur prend en charge plusieurs périodes, vous permettant d'afficher les canaux de différentes périodes sur votre graphique actuel. De plus, il propose des couleurs transparentes pour une meilleure clarté visuelle et vous permet de personnaliser les couleurs des canaux selon vos préférences. Comment fonctionne cet indicateur ? L'ind

A Heatmap with a Volume Profile is like a thermal imager or x-ray machine. It will help you to estimate the relative distribution of volume during the price movement and to understand the relationship between volume and price. Indicator Volume Profile "Volumos Maxima" is a powerful tool for analyzing this relationship. After simple experimentation with heatmap, you can find that each trading instrument has its own “ characteristic ” way of distributing volume. And this will help you to make a b
The Omega Trend Indicator is an advanced tool that has been specifically designed to detect market trends early, and follow them efficiently. The indicator draws two lines. The main (thicker) Trend Line represents the presumed lower or upper volatility limits of the current market trend. A break in the main Trend Line indicates a potential reversal or shift in the movement of the trend. The Trend Line also indicates the best point to place a stop loss order. In Omega Trend Indicator, the Trend L
FREE

RSI ALARM (For Metatrader 5)
This indicator works like a normal RSI with all its settings (Periodicity, colors, levels, etc),
but additionally, alarms can be set at the upper and lower level (Example 70 and 30), with the possibility of adjusting these levels by moving the blue and red lines to establish the upper and lower levels.
You can also turn on and off an additional function that creates an arrow on the chart when the expected upper or lower RSI is met.

Buy Sell Signal Low TF gives buy/sell signals and alerts with up and down arrow at potential reversal of a pullback or a trend continuation pattern in low timeframe. This is an indicator which gives signals based on trend => It works best in trend market with the principle is to ride on the trend not trade against the trend.
The components of Buy Sell Signal Low TF: - The trend is determined by SMMA 13 , SMMA 21 and SMMA 35 ( can be changed manually to suit your preference). - The signal is
FREE
Le MetaTrader Market est un site simple et pratique où les développeurs peuvent vendre leurs applications de trading.
Nous vous aiderons à publier votre produit et vous expliquerons comment préparer la description de votre produit pour le marché. Toutes les applications de Market sont protégées par un cryptage et ne peuvent être exécutées que sur l'ordinateur de l'acheteur. La copie illégale est impossible.
Vous manquez des opportunités de trading :
- Applications de trading gratuites
- Plus de 8 000 signaux à copier
- Actualités économiques pour explorer les marchés financiers
Inscription
Se connecter
Si vous n'avez pas de compte, veuillez vous inscrire
Autorisez l'utilisation de cookies pour vous connecter au site Web MQL5.com.
Veuillez activer les paramètres nécessaires dans votre navigateur, sinon vous ne pourrez pas vous connecter.