Regardez les tutoriels vidéo de Market sur YouTube
Comment acheter un robot de trading ou un indicateur
Exécutez votre EA sur
hébergement virtuel
hébergement virtuel
Test un indicateur/robot de trading avant d'acheter
Vous voulez gagner de l'argent sur Market ?
Comment présenter un produit pour qu'il se vende bien
Nouveaux indicateurs techniques pour MetaTrader 5 - 24
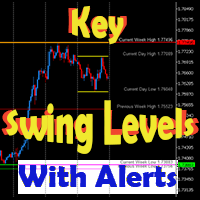
This dynamic indicator will draw the Key Swing High and Low Levels for any symbol on any timeframe!
User may Hide or Show any Level or Label and also Receive Alerts when price returns to that key level via Pop-Up, Push, Email or Sound.
Levels include Current Day High/Low, Previous Day High/Low, Current Week High/Low, Previous Week High/Low and Monthly High/Low.
The Levels are labeled with the Price Point Data Listed next to it for quick easy reference.
You can change the Style, Size an
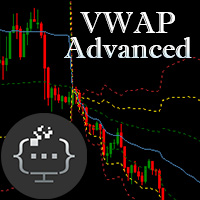
Introducing the Advanced VWAP tool - an essential technical analysis indicator that can help you identify trend directions and locate price extremas with multipliers. Designed to suit the needs of both traders and EA developers, this tool features customizable parameters that allow you to tailor it to your specific trading style. With Advanced VWAP, you have the ability to customize the colors and styles of all bands to your liking. If you don't require any bands, you can simply set their values

The Color Candles Indicator uses custom colors to highlight candles that follow the main market trend, based on the Moving Average. This simplifies the analysis of price movements, making it clearer and more direct. When the price is above the rising Moving Average, candles are highlighted indicating a BUY opportunity. When the price is below the declining Moving Average, candles are highlighted indicating a SELL opportunity.
Input Parameters : Period Method Applied Price
The moving avera
FREE

(traduction Google) Cet indicateur implémente l'original " Average True Range (ATR) " développé par John Welles Wilder Jr. , tel que décrit dans son livre— Nouveaux concepts dans les systèmes techniques de trading [1978] . Il utilise la moyenne mobile de Wilder , également connue sous le nom de moyenne mobile lissée (SMMA) , au lieu d'une moyenne mobile simple (SMA) tel qu'utilisé sur l'indicateur ATR intégré de MetaTrader . La période par défaut appliquée est de 7, au lieu de 14, selon la descr
FREE

Nouvel Indicateur d'Enthousiasme de la Tendance (TEI), l'outil ultime pour maximiser les profits sur les marchés.
Cet indicateur innovant combine la puissance de l'analyse des tendances avec l'excitation du sentiment du marché, offrant aux traders un avantage unique sur les marchés financiers en constante évolution.
Le TEI utilise des algorithmes avancés pour analyser la tendance sous-jacente d'un instrument financier et l'enthousiasme des traders pour identifier les opportunités de profit

Price DNA est un indicateur de tendance qui utilise des moyennes mobiles pondérées par le ratio composé pour réduire les décalages et permettre une détection précoce des tendances. L'indicateur ne se repeint pas et peut être appliqué à n'importe quel instrument financier dans n'importe quelle période de temps.
Comment fonctionne l'ADN des prix ? L'indicateur affiche plusieurs vagues sur le graphique, qui indiquent la direction de la transaction en cours. Cinq vagues vertes ou cinq vagues rouge

L'indicateur Crash Wizard fonctionne UNIQUEMENT sur une période de 1 minute de Crash 500 et Crash 1000. Cet indicateur tracera un rouge (x) sur la bougie Drop. il tracera les flèches vertes comme signal d'entrée ACHETER et tracera l'orange (x) comme points de sortie multiples. Vous l'indicateur est précis à 85%. vous pouvez l'utiliser avec l'action Prix.
NOTE:
Pour utiliser l'indicateur, assurez-vous d'avoir un compte chez Deriv, le seul courtier en indices synthétiques. NE PAS l'utiliser s

Signaling is a very interesting trend indicator. The Destroyer of Chaos indicator helps to identify either a new or an existing trend. One of the main definitions for monitoring the currency market is a trend, which is why this indicator was created. Its signals are based on a reliable algorithm. When used simultaneously on multiple timeframes, this indicator truly "makes the trend your friend". With it, you can follow trends on multiple timeframes in real time. One of the advantages of the indi

Provided Trend is a complex signal formation indicator. As a result of the work of internal algorithms, you can see only three types of signals on your chart. The first is a buy signal, the second is a sell signal, and the third is a market exit signal.
Options: CalcFlatSlow - The first parameter that controls the main function of splitting the price chart into waves. CalcFlatFast - The second parameter that controls the main function of splitting the price chart into waves. CalcFlatAvg - Par

We publish the indicator as a useful tool in trading and call this indicator the "Swiss Army Knife" because it provides many possibilities and combinations to help understand the material on the "Masters of Risk" trading system. The indicator itself is not part of the tools used in the "Masters of Risk" trading system.
The indicator consists of 3 separate multi-timeframe indicators, which in combination with each other help to reduce the "noise" of false signals. The first of the indicators ar

Able Turn indicator.
Currency pairs never rise or fall in a straight line. Their ups and downs are interspersed with rollbacks and reversals. Every rise and fall is reflected in your emotional state: hope is replaced by fear, and when it passes, hope appears again. The market uses your fear to prevent you from taking advantage of a strong position. At such moments you are most vulnerable.
Everything will change if you use the Able Turn indicator.
The Able Turn indicator was created to neu

The Trend A indicator is a forward-looking arrow indicator that reliably tracks the market trend, ignoring sharp market fluctuations and noise around the average price. It catches the trend and shows favorable moments of entering the market with arrows. The indicator can be used both for pipsing on short periods and for long-term trading. The indicator implements a kind of technical analysis based on the idea that the market is cyclical in nature.

Your Helper is a global trend indicator. The indicator should be used on a period not less than H1, H4 and higher is recommended. Despite the apparent simplicity of the indicator, it has complex analytical algorithms inside, with the help of which the system determines the moments of entries. The indicator gives accurate and timely signals to enter and exit a trade that appear on the current candle.
The main purpose of this indicator is to determine the moments of entries and exits from trans

Impulse Fibo indicator is used to determine price levels after some price impulse occurs. How to use it you can see in screenshots and video. In the indicator setup you can fix two different setups for two different patterns. For drawing convenience also two different rectangles can be easy put on the screen to draw support/resistance levels. .
Inputs Draw pattern 1 Line color - choose color from dropdown menu
Line style - choose style from dropdown menu
Line width - enter integer number 1,2

Perfect Sniper! is a triple indicator with support resistance detection, downtrend channel, uptrend channel Bands included! where he hunts the rebounds in the red lines for sale, in the green lines mark purchase, in the lower bands that are the breaks gives another second entry either buy or sell, perfect to take advantage of the double entrance, It is used in any temporality, It is used to scalp and long on h1 or h4 to D1. It works for Forex markets, All pairs. It is used for the synthetic inde

BandSniper! band indicator , programmed %100 to hunt rebounds on the bands both bounce for the downside and bounce for the upside,, It serves to hunt trends too! where you can see in the photo marked with arrows the buy and sell signals. can be used at any time, Ideal for scalping and long h1 or h4! works for all Forex pairs! and for all pairs of synthetic indices ! World Investor. Good profit
One of the basic needs of every trader is to have a checklist to enter every position. Of course, using pen and paper may not be convenient forever. With this indicator, you can have a small checklist next to the screen for each of your charts and use it for better use in your trades.
By pressing the r button, you can return everything to the original state.
MT4 Version
This indicator will have many updates and special settings will be added to it.
You can contact us via Instagram, Telegram

Trend Fibonacci is a unique indicator that combines a power of Fibonacci sequences and ranges. Channel Group: Click Here
How to read:
- There are three zones --> red, gold and green
- Red candlestick = downtrend
- Green candlestick = uptrend
- Gold candlestick = no established trend
Inputs: Per = number of bars used for calculations FirstRatio = first Fibonacci ratio (Or use any ratio you want) SecondRatio = second Fibonacci ratio (Or use any ratio you want)
!! IF YOU PURCHASE TH
FREE

MACD (short for M oving A verage C onvergence/ D ivergence) is a popular trading indicator used in technical analysis of securities prices. It is designed to identify changes in the strength, direction, momentum, and duration of a trend in a security's price.
History Gerald Appel created the MACD line in the late 1970s. Thomas Aspray added the histogram feature to Appel's MACD in 1986.
The three major components and their formula 1. The MACD line: First, "PM Colored MACD" employs two

Magnetic levels for MT5 is a great addition to your trading strategy if you use support and resistance levels, supply and demand zones. The price very often gives good entry points to the position exactly at the round levels and near them.
The indicator is fully customizable and easy to use: -Choose the number of levels to be displayed -Choose the distance Between The levels -Choose the color of the levels.
Can be added to your trading system for more confluence. Works very well when combin
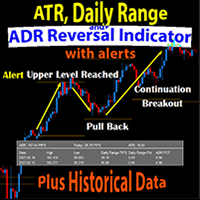
The Daily Range ATR ADR Reversal Indicator shows you where price is currently trading in relation to its normal average daily range. You will received alerts via pop-ups when price exceeds its average daily range. This will enable you to identify and trade pullbacks and reversals quickly.
The Indicator also shows you the Daily Range of Price for the current market session as well as previous market sessions. It shows you the ATR which is the average range of pips that a candle may move in that
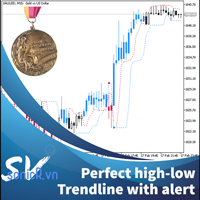
This indicator calculate trendline base on high, low of two period: fast and slow. From that, we have two line for fast signal and low signal. We tested many time on many assets, in most case, when fast signal crossup slow signal, price going up and vice verser. We also add alert function when two signal line crossed. For most effecient, user can change fast and slow period in setting. This indicator is good advice for price move. It better when combine with other trend indicator. For me, i us

Multicurrency and multi-timeframe indicator Inside Bar (IB). In the parameters, you can specify any desired currencies and timeframes. The panel displays the last found Inside Bar (and Mother Bar) pattern, the current price position and the breakout of the levels of the Mother and Inside Bars. You can set the size and color for bars and text in the cells. The indicator can also send notifications when levels are broken. By clicking on a cell with a period, the specified symbol and period will b

C'est un indicateur très simple et facile à utiliser pour tout le monde. Cependant, il est très visuel, utile et efficace. Il convient à tous les symboles Forex et à toutes les périodes. Mais d'après mes tests et mes investigations, je ne recommande pas de l'utiliser avec les délais M1, M5, M15. Paramètre. - Choisissez l'alerte On/Off (par défaut ON). - Sélectionnez le temps (secondes) entre 2 alertes. La valeur par défaut est 30 secondes Comment ça fonctionne? - Tendance haussière—Lorsque la c
FREE

Cet indicateur affiche des informations de prix filtrées sous la forme de trois histogrammes colorés et d'une ligne colorée commune. C'est un indicateur très coloré et magnifique. Idéal pour déterminer la force et la direction du mouvement des prix. Cet indicateur a des réglages très simples : 1) choix de trois options pour le calcul de l'indicateur : - original, - démarqueur, - volume d'équilibre. 2) sélection de cinq périodes différentes. 3) sélection de la couleur affichée. 4) choix de la pr
UR PulseScalp MT5 Un indicateur de trading calibré pour les scalpers à la recherche de l'avantage ultime sur des marchés en évolution rapide
UR PulseScalp MT5 est une solution de trading de pointe pour les scalpers à la recherche de l'avantage ultime sur des marchés en évolution rapide. Cet indicateur innovant est construit sur une formule scientifiquement calibrée qui combine la puissance de la volatilité, du MoneyFlow et de la force relative pour créer un signal très précis et fiable.
Ava

TILLSON MOVING AVERAGE Également appelé indicateur TMA ou T3. Il s'agit d'une moyenne mobile qui utilise EMA et DEMA dans sa formule et est calculée avec une expansion binomiale du 3e degré. ... int handle1; //Handle of the Tillson TMA T3.EX5 custom indicator double euBuff1[]; int TMAperiod= 12 ; int TMSshift= 0 ; double VolumeFactor= 0.618 ; int OnInit () { ... handle1= iCustom ( NULL , PERIOD_CURRENT , "Market\\Tillson TMA T3.EX5" ,0,TMAperiod,0,0,TM
FREE

DONCHIAN CHANNEL DC Il s'agit d'un indicateur de tendance développé par “Richard Donchian”, composé de 3 couches, le canal supérieur, le canal inférieur et le canal intermédiaire. Il est créé sur le canal Donchian en traçant les prix les plus élevés et les plus bas atteints au cours de la période précédente sur le graphique des prix. Il est également utilisé pour mesurer la volatilité du marché, car il s'agit d'un canal d'expansion/contraction en fonction de l'augmentation/diminution de la volat
FREE
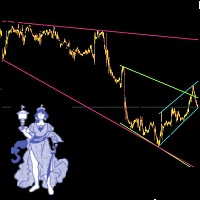
Leave a comment if you would like me to write an EA to trade these trendlines... if enough interest, will write an EA. Automatic Trendlines, updated automatically. To Set up 3 different (or mroe) Trendlines on chart, simply load the indicator as many times and name it differntly.. the example in the picture below is indicator 1 (loaded 1st time): Name: Long, StartBar: 50, BarCount: 500, Color: Pink indicator 2 (loaded 2nd time): Name: Short, StartBar: 20, BarCount: 200, Color: Green indicator 3
FREE

FRB Trader - Our mission is to provide the best support to customers through conted and tools so that they can achieve the expected results
FRB Strength - Indicator shows the current strength of the asset between buyers and sellers. - It can only be used by brokerage houses that report data on trading volumes, such as B3. In the forex market it is not possible to use.
FREE

- Times and Trades, também chamado de Time and Sales ou histórico de negócios, é uma ferramenta essencial para quem opera através do Tape Reading (Fluxo). - O Metatrader 5 não informa os dados das corretoras, sendo assim, impossível diferenciar quem enviou a ordem. - Os dados só podem ser usados por corretoras que informam os dados dos volumes de negociação, como a B3. No mercado forex não é possível usar.
FREE

FRB Times and Trades Free
- Times and Trades, também chamado de Time and Sales ou histórico de negócios, é uma ferramenta essencial para quem opera através do Tape Reading (Fluxo). - O Metatrader 5 não informa os dados das corretoras, sendo assim, impossível diferenciar quem enviou a ordem. - Os dados só podem ser usados por corretoras que informam os dados dos volumes de negociação, como a B3. No mercado forex não é possível usar. VERSÃO PRO : https://www.mql5.com/pt/market/product/93726
FREE

FRB Trader - Our mission is to provide the best support to customers through conted and tools so that they can achieve the expected results
FRB Support and Resistance
- Indicator places lines on the chart to show Support and Resistance regions. - You can choose the timeframe you want to calculate, as well as the colors of the lines. - Algorithm calculates the points where the strengths of the asset are considered and are extremely important for decision making.
FREE

To get access to MT4 version please click here . - This is the exact conversion from TradingView: "Twin Range Filter" by " colinmck ". - This is a light-load processing and non-repaint indicator. - All input options are available. - Buffers are available for processing in EAs. - You can message in private chat for further changes you need. Thanks for downloading

Pivot Point Supertrend (corresponds to Pivot Point Super Trend indicator from Trading View) Pivot Point Period: Pivot point defined as highest high and highest low... input 2 = defining highest high and highest low with 2 bars on each side which are lower (for highest high) and are higher (for lowest low calculation) ATR Length : the ATR calculation is based on 10 periods ATR Factor: ATR multiplied by 3
FREE

The idea behind this indicator is to find all currency pairs that are over-bought or over-sold according to the RSI indicator at one go.
The RSI uses the default period of 14 (this can be changed in the settings) and scans all symbols to find the RSI level you will have specified. Once currency pairs that meet the specification are found, the indicator will open those charts for you incase those charts aren't open and proceed to write the full list of currencies on the experts tab.
FREE

Sniper Zones are our best kept secret for trading the forex markets profitably and extremely simple ! After years of profitable trading we are launching it to the public !
After thousands of hours of testing, we have developed an indicator that simplifies trading to the point where anyone can become a profitable trader. There exists certain zones and areas in the market that are used by institutions to move price and cause retail traders to lose their money ! We have done the hardwork and m

Get ALERTS for break of your TRENDLINES, SUPPORT LINES, RESISTANCE LINE, ANY LINE!!
1. Draw a line on the chart (Trend, support, resistance, whatever you like) and give it a name (e.g. MY EURUSD line) 2. Load the Indicator and input the Line Name the same name in Indicator INPUT so system knows the name of your line (= MY EURUSD line) 3. Get Alerts when Price breaks the line and closes Works on All Time frames and charts LEAVE A COMMENT AND IF THERE IS ENOUGH INTEREST I WILL WRITE AN EA WHICH
FREE

Mean Reversal Heikin Ashi Indicator calculates special trade reversal points based on Heikin Ashi candlesticks patterns. This indicator can be used on all symbols, even in Forex or B3 Brazillian Markets. You can configure just the position of each arrow. Then, after include the indicator on the graphic, pay attention on each arrow that indicates a long or short trade.

To get access to MT4 version please click here . This is the exact conversion from TradingView: "Supertrend" by " KivancOzbilgic ". This is a light-load processing and non-repaint indicator. You can message in private chat for further changes you need. Here is the source code of a simple Expert Advisor operating based on signals from Supertrend . #include <Trade\Trade.mqh> CTrade trade; int handle_supertrend= 0 ; input group "EA Setting" input int magic_number= 123456 ; //magic number input dou
Multi-Timeframe Moving Average Indicator Provides you a simple edge. How? Let me explain.. Have you ever tried using Moving Average Strategy to trade but you find those entries too late? Have you ever tried to trade with moving averages on 1 Timeframe chart (example 4h) and when i try to lower the timeframe, moving averages change position? If you answered Yes to Both questions , This indicator is the solution for you! 1- You can visualize lower timeframes moving averages on higher timeframes ex
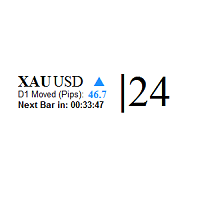
This indicator shows: The market spread Current candle time left to be closed and the pips of market movement from the beginning of the day play sound when candle is going to be closed This is an extremely useful tool for watching the spread rise and fall, allowing you to enter the market at just the right time. This indicator will help you stay out of the market when the spread begins to rise and help you get into the market as the spread begins to fall again.
very useful for day trading and
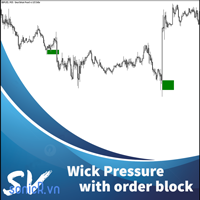
Multiple Wicks forming at OverSold & OverBought levels create Buying and Selling Pressure. This indicator tries to capture the essence of the buy and sell pressure created by those wicks. Wick pressure shows that the trend is Exhausted. Order block should display when buying or selling pressure wick. When price go inside buy order block and up to outside order block, trader should consider a buy order. If price go inside buy order block and down to outside order block, trader should consider a s
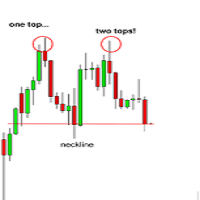
Hello all!
This is indicator 2 top and 2 bottom It will send alert to your phone when price hit top or bottom input uint InpMinHeight = 10; // Minumum Height/Depth input uint InpMaxDist = 20; // Maximum distance between the twin tops/bottoms input uint InpMinBars = 3; // Maximum number of bars after the top/bottom input string Inp_TOP_stringDOWN ="Signal Sell";// TOP: Level UP label input string Inp_BOTTOM_stringUP =
With dynamic Moving average, you can estimate the price movement, predict the next trend of price and have a better decision. Parameters setup: Period start <= Period Stop Period start >= 1
Maximum lines is 100 You can customize Moving average method: Simple averaging, Exponential averaging, Smoothed averaging, Linear-weighted averaging and price to apply: PRICE_CLOSE: Close price
PRICE_OPEN: Open price
PRICE_HIGH: The maximum price for the period
PRICE_LOW: The minimum price for the period
The Scalping Project EA follows a scalping breakout strategy. It trades the breakouts from relative highs and lows. For the entry stop orders are used for the fastest possible execution. Profits can be secured by the adjustable trailing stop. Since the strategy works with small average profits it is highly suggested to trade with a low spread and commission broker. Trading costs are crucial here! The backtests shown in the screenshots were done with the default settings. There might be better or
ONLY 3 COPIES OUT OF 10 LEFT AT $299! After that, the price will be raised to $349. IMPORTANT! Contact me immediately after the purchase to get instructions and a bonus! Advanced Fibo levels is a trading robot for the trading on forex. This is a Fibonacci system that designed to trade for most popular Fibonacci strategy that's completely automated. Warning:
I only sell EA's through MQL5.com. If someone contacts you saying it is me trying to sell you something, they are a Scammer. Block and rep

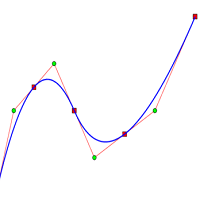
Fit line supports to extrapolation next movement of market, support for buy/sell decision. Indicator using spline algorithm to extrapolation. You can change number of spline with parameter "PointsNumber" and number of extrapolation point with "ExtrapolateBars". Eextrapolation points will be save into csv format, with prefix in parameter "PointsPrefix", and store in folder File of Data Folder.
Quantile Moving Average Channels "KNOW WHERE OTHER MARKET PARTICIPANTS ACT"
General See where zones of interest exist with quantile MA channels. It plots three lines on the main chart: two outer lines and a mid line.
Most of all commonly used moving averages are between the upper and the lower band, if the input parameters are chosen properly.
This means that if the channel is relatively small, other market participants that rely on moving averages may act if the price action is near the mi

ICT, SMC, SMART MONEY CONCEPTS, SMART MONEY, Smart Money Concept, Support and Resistance, Trend Analysis, Price Action, Market Structure, Order Blocks, BOS/CHoCH, Breaker Blocks , Momentum Shift, Supply&Demand Zone/Order Blocks , Strong Imbalance, HH/LL/HL/LH, Fair Value Gap, FVG, Premium & Discount Zones, Fibonacci Retracement, OTE, Buy Side Liquidity, Sell Side Liquidity, BSL/SSL Taken, Equal Highs & Lows, MTF Dashboard, Multiple Time Frame, BigBar, HTF OB, HTF Market Structure

** All Symbols x All Timeframes scan just by pressing scanner button ** *** Contact me after the purchase to send you instructions and add you in "Trend Reversal group" for sharing or seeing experiences with other users. Introduction: Trendlines are the most famous technical analysis in trading . Trendlines continually form on the charts of markets across all the different timeframes providing huge opportunities for traders to jump in and profit on the action. In the other hand, The tre

Version MT4 | FAQ L' indicateur Owl Smart Levels est un système de trading complet au sein d'un seul indicateur qui comprend des outils d'analyse de marché populaires tels que les fractales avancées de Bill Williams , Valable ZigZag qui construit la structure d'onde correcte du marché et les niveaux de Fibonacci qui marquent les niveaux exacts d'entrée. sur le marché et les endroits où prendre des bénéfices. Description détaillée de la stratégie Mode d'emploi de l'indicateur Conseiller-Assis

Version MT4 | Indicateur Trend Monitor VZ | Indicateur Owl Smart Levels | Stratégie Owl Smart Levels | FAQ La théorie des vagues d'Elliott est une interprétation des processus sur les marchés financiers qui s'appuie sur un modèle visuel des vagues sur les graphiques des prix. L'indicateur valable ZigZag affiche la structure des vagues du marché sur laquelle vous pouvez compter pour prendre des décisions commerciales. L'indicateur Valable ZigZag est plus stable et ne change pas souvent
FREE

MT4 version | Indicateur Owl Smart Levels | Stratégie Owl Smart Levels | FAQ
L'indicateur Fractals est l'un des éléments de la stratégie commerciale de l'auteur de Bill Williams . Il est utilisé pour rechercher des points d'inversion des prix sur le graphique des prix et, par conséquent, des niveaux de support et de résistance. L'indicateur Full Fractals est un Fractals amélioré qui est disponible dans la boîte à outils de presque tous les terminaux de trading. Sa seule différe
FREE

L'indicateur KPL Swing est un système de négociation mécanique simple suivant les tendances qui automatise l'entrée et la sortie. Le système travaille avec une stop-loss stricte et une stop-loss en arrière-plan pour sortir avec des transactions rentables. Aucun objectif n'est donné car personne ne sait jusqu'où (ou jusqu'où) le prix peut se déplacer. Une stop-loss en arrière-plan verrouille les gains et élimine les émotions de la négociation. Converti à partir de l'indicateur Amibroker avec modi
FREE

Bienvenue sur RSI Colored Candles, un indicateur innovant conçu pour améliorer votre expérience de trading en intégrant l'indice de force relative (RSI) directement dans votre graphique de prix ! Contrairement aux indicateurs RSI traditionnels, RSI Colored Candles utilise un schéma de quatre couleurs pour représenter les niveaux de RSI directement sur vos bougies, vous offrant ainsi des aperçus précieux en un coup d'œil ! Caractéristiques et avantages : Conception Économisant de l'Espace : Adieu
FREE

Bandes UR (avec une formule utilisée dans les systèmes d'apprentissage automatique)
UR Bands est un indicateur dérivé d'une formule qui intègre la volatilité du marché est similaire en principe à ceux utilisés dans les systèmes d'apprentissage automatique. Cette représentation mathématique des conditions de marché offre une analyse précise des tendances et de la dynamique des prix, en tenant compte de la volatilité inhérente aux marchés financiers. En incorporant la volatilité comme variable,

Pivot Classic, Woodie, Camarilla, Fibonacci and Demark Floor/Classic Les points pivots, ou simplement les pivots, sont utiles pour identifier les niveaux de support/résistance potentiels, les fourchettes de négociation, les inversions de tendance et le sentiment du marché en examinant les valeurs hautes, basses et de clôture d'un actif. Les points pivots Floor/Classic peuvent être calculés comme suit. Pivot Point (P) = (High + Low + Close)/3 S1 = P * 2 - High S2 = P - (High - Low) S3 = Low – 2*(
FREE

After working during many months, with the help of Neural Networks, we have perfected the ultimate tool you are going to need for identifying key price levels (Supports and Resistances) and Supply and Demand zones. Perfectly suitable to trigger your trades, set up your future actions, decide your Take Profit and Stop Loss levels, and confirm the market direction. Price will always move between those levels, bouncing or breaking; from one zone to another, all the remaining movements are just mark
Volatility Crusher Indicator is a Non-Lag MT5 indicator which detect trades on any time frame. The indicator has alerts to buy and sell once a trade has been detected. It will also send pop-up signal to your mobile phone and you can trade anywhere you are with your phone while its generating signals for you on PC connected to VPS. Its recommended on m5 to h4 time frame on any pair on Deriv MT5 Broker. Pairs recommended: Volatility Index 10, Volatility Index 25, Volatility Index 100 Volatility I

Display your Local Time on your charts
Now available for MT5 with new features! Display your local time instead of (or along with) MT5 server time.
Display crosshair to highlight current candle time.
Automatically adjusts based on chart zoom (zooming in or out).
Displays on every timeframe (M1 - Month, including all MT5 timeframes), and auto-adjusts as chart timeframe is changed.
Handles special ½ hour time zones , such as India.
Renders fast (no lag) as you scroll charts.

FRB Agression Opposite Candle
This indicator shows when the candle has opposite direction to the aggression balance of the same period. Not intended to be used in the Forex market. Only use markets that have volume and aggression information, such as B3 (Brazil)
Settings Color - Define the color that will be shown for the candle ( Color 1 - When the candle is positive and the balance of aggression is negative / Color 2 - When the candle is negative and the balance of aggression is positive )
FREE

FRB Candle Time
Indicator showing the time left for the next candle You can edit font color and size. Very important indicator for Traders. To move time, just click on it and move the mouse to where you want to leave it. After positioning the time where you want it, click again or press "ESC" and the time will stay where you left it.
Settings font color Font size Background color
FREE

FRB Trader - Time Indicator that shows the server's time of operation.
You can edit the font color and size of the timetable.
Settings
Font color
Font size
Background color
To move the Timetable, just click on it and move the mouse to where you want to leave it. After placing the Time where you want it, click again or press "ESC" and the time will stay where you left it.
FREE
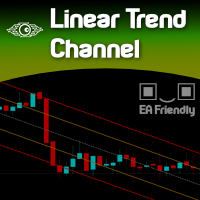
Imagine a way to automatically and clearly recognize the direction of the current market. Uptrend or Downtrend?
Forget about moving averages, there is a simple way to determine that. Welcome to the world of statistics. Welcome to the simple yet powerful world of Linear Regression. Just a complicated name for a genius and simple measurement.
Calibrating this indicator is pretty clear and obvious since the degree of freedom is total and deep.
Once calibrated to your desired Symbol/Asset,

ICT Core Content Concepts turned into indicator plus all previous tools known from the Position Smart Indicator . This makes it the Full PSI Private Version ( read more ) restricted up to now but available only after the Mentorship Core Content was made public on YouTube. You will find many price action study tools like: Central Bank Dealing Range - CBDR Asian Range FLOUT Profiles and SD targets on the CBRD, Asian Range and Flout both on the wicks and on the bodies Seek & Destroy Prof

This indicator can identify more than 60 candlestick patterns on the chart, including their bullish and bearish variants. Just choose the pattern you want in the settings.
Available Patterns 2 Crows Gravestone Doji On Neck 3 Black Crows Hammer Piercing 3 Inside Hanging Man Rick Shawman 3 Line Strike Harami Rising and Falling Three Method 3 Outside Harami Cross Separating Lines 3 Stars in South High Wave Shooting Star 3 White Soldiers Hikkake Short Line Abandoned Baby Hikkake Modified Spinning

Macd Sar! is a gcd indicator combined with the parabolic sar indicator! It has the strategy of breaks, where the gray line crosses above the pink lines, and exchange of parabolic sar points, it is marking purchase for sale is vice versa, works for all seasons! It is good for scalping, and to do lengths suitable for forex markets and synthetic indices! Good profit! World Investor.

Super Treend! It is an indicator whose strategy is based on line breaks giving a signal for sale or purchase, How well it looks when you are marking a sale, it puts a red dot on you, when you make a purchase, it marks a green dot, Accompanying with blue lines that sets the trend for sale, and the aqua line that sets the shopping trend for you, works for all seasons works for forex markets and synthetic indices! Good profit! World Investor.

Range Move It is an indicator that clearly shows you the supports, resistances and trend lines. to each candle that is running, said changing, the lines are changing accommodating the trend to have a better entrance! the indicator is for forex markets for synthetic index markets ! and for crypto too! It is used in all temporalities! Good profit! World Investor.
Le MetaTrader Market est un magasin unique de robots de trading et d'indicateurs techniques.
Lisez le mémo de l'utilisateur de MQL5.community pour en savoir plus sur les services uniques que nous offrons aux traders : copie des signaux de trading, applications personnalisées développées par des freelancers, paiements automatiques via le système de paiement et le MQL5 Cloud Network.
Vous manquez des opportunités de trading :
- Applications de trading gratuites
- Plus de 8 000 signaux à copier
- Actualités économiques pour explorer les marchés financiers
Inscription
Se connecter
Si vous n'avez pas de compte, veuillez vous inscrire
Autorisez l'utilisation de cookies pour vous connecter au site Web MQL5.com.
Veuillez activer les paramètres nécessaires dans votre navigateur, sinon vous ne pourrez pas vous connecter.