Regardez les tutoriels vidéo de Market sur YouTube
Comment acheter un robot de trading ou un indicateur
Exécutez votre EA sur
hébergement virtuel
hébergement virtuel
Test un indicateur/robot de trading avant d'acheter
Vous voulez gagner de l'argent sur Market ?
Comment présenter un produit pour qu'il se vende bien
Expert Advisors et indicateurs gratuits pour MetaTrader 5 - 8

This trading strategy uses HeikenAshi candles to smooth out market noise and 2 SMAs for more accurate market entry points. It is suitable for trading any currency pairs, commodities (e.g., gold and oil), and stocks. The strategy was tested on EURUSD with a 1-hour timeframe. Period 01.01.2024 - 27.07.2024 Recommended parameters: Lots = 1 StopLoss = 490 TakeProfit = 310 Moving averages parameters: FastMA = 66 SlowMA = 32 Before starting, make sure that the Heiken Ashi indicator, located in Indicat
FREE
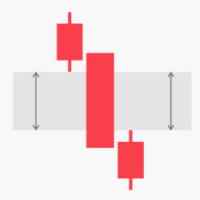
The Fair Value Gap (FVG) indicator is designed to help traders identify price imbalances in the market. It automatically identifies and visualizes areas where the price deviates significantly from its fair value, which can indicate potential trading opportunities. Automatic FVG detection: The indicator automatically finds and marks areas on the chart where price leaves “gaps” between candles, indicating possible market imbalances.
FREE
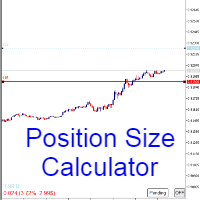
Calculating the volume of orders every time you create an order is an extremely important thing in risk management Let this tool simplify your work! ----------------------------------------------------- How to use? Attach the indicator to the chart and set its parameters: Risk size in % or money and Risk Reward Ratio. Click on the ON button and locate the horizontal line to your would-be StopLoss level. Options: Click on the Pending/Instant button to locate the horizontal line to your would-b
FREE

Trading Notes is an innovative tool designed for traders to streamline their decision-making process by allowing them to write and display important reminders or short details directly over their trading charts. This essential feature ensures that traders have quick access to their personalized checklist before opening any positions, enhancing their trading efficiency and accuracy. MT4 Version - https://www.mql5.com/en/market/product/120613 Key Features: Five Customizable Input Fields: Trad
FREE
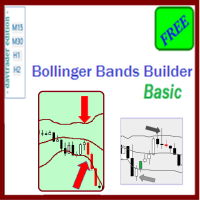
The Bollinger Bands Builder Basic expert advisor is a similar strategy with Price Action Builder Basic , using instead the Bollinger Bands indicator as its primary signal provider technique.
Technical details:
Currently, 3 distinct strategy types are supported:
1. Bollinger squeeze, conservative entry (the only one available for the basic version);
2. Bollinger squeeze, aggressive entry (available in the premium version only);
3. Bollinger bounce (available in the premium version only).
FREE

The ATR (Average True Range) Indicator is a powerful tool designed to measure market volatility. This indicator provides accurate data on price movement ranges, helping traders manage risk more effectively and make well-informed trading decisions. Based on the widely-used ATR indicator, it’s suitable for both professional and beginner traders to analyze market volatility. The ATR Indicator allows you to track the current price movement range and use this information to set stop-losses, select en
FREE

Hello, Every one
A script to close all market positions and/or pending orders.
-----------------------------------------------------------------------------------
This is Close All market positions and/or pending orders button
You can close all orders in 1 second by one click
For advanced version: Advanced: https://www.mql5.com/en/market/product/77763
https://www.mql5.com/en/market/product/89311 Key:
1 Close all button: The script will close All orders market +
FREE

The " YK Find Support And Resistance " indicator is a technical analysis tool used to identify key support and resistance levels on a price chart. Its features and functions are as follows:
1. Displays support and resistance levels using arrow lines and colored bands, with resistance in red and support in green.
2. Can be adjusted to calculate and display results from a specified timeframe using the forced_tf variable. If set to 0, it will use the current timeframe of the chart.
3. Uses
FREE

Martingale. Parabolicum est un Expert Advisor multi-devises. Il est possible de tester 10 paires de devises en même temps. Symboles de travail : EURUSD, GBPUSD, USDCAD, EURCAD, CADCHF, USDCHF, AUDCAD, AUDCHF, EURCHF, EURGBP Délai H1 Dépôt minimum : 1 000 $ (lot minimum 0,01) Dépôt minimum recommandé : 10 000 $ Étape de lot recommandée 0,01 Type de compte de couverture Important lors du test : Pour gagner du temps et des ressources, il est recommandé de sélectionner le mode de simulation "1 m
FREE
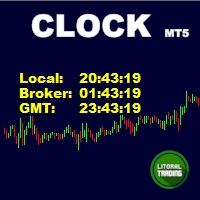
Simple indicator that draws the market hours on chart (broker, local and GMT). Functions: Horizontal distance - from border. Vertical distance - from border. Color - text color. Font - text font. Size - text size. Corner - which chart corner will be drawn. Show seconds - show or hide seconds. Draw as background - candles front or back. Label local - text before local time. Label broker - text before broker time. Label GMT - text before GMT time. Separator - separator between label and time Objec
FREE
It's a two (2) pairs correlation system to use 3 currencies to make 2 pairs to open hedge orders on those.
The expert starts opening four orders for each couple (2 plus and 2 minus) and wait to move prices in one direction to make a grid of orders.
The expert can use a maximum of 5 currencies to make 10 pairs and make 30 couples.
It is important the order of currencies is from the strongest to the weakest.
Strongest... EUR/GBP/AUD/NZD/USD/CAD/CHF/JPY ...weakest.
Canto inputs minimum o
FREE

SETTINGS Make sure to select Chart shift option in the chart.
(Right click in the chart ---> Properties (dialog box) ----> Select Chart Shift)
Kindly rate and comment about the product for upgradation & Support
When using candlestick timers, keep in mind that the timing of candlestick patterns can play a crucial role in your trading strategy. For instance, different timeframes (such as 1-minute, 5-minute, hourly, ) can provide varying insights into price movements and trends. Make sure t
FREE

Renko is a timeless chart, that is, it does not take into account the time period, but the price change, which makes the price change on the chart clearer.
Hyper Renko is the indicator that provides this.
To configure, you only have one parameter, the size of the candle in the tick * you want to use.
* tick: is the smallest possible variation of an asset.
Thank you for choosing a Hyper Trader indicator.
Wikipedia: A renko chart indicates minimal variation in the value of a variable -
FREE
This simple range breakout trading strategy is a popular approach to profit from the movement of prices in financial markets. This strategy aims to identify a price range that a particular asset has been trading within and then wait for a breakout of that range to take place. The basic idea behind this strategy is that once the price of an asset breaks out of its established range, it is likely to continue in that direction, leading to a profitable trade. Once the range has been identified, we
FREE

Stochastic indicator alerts when EA Available in comments , must have indicator installed buys stochastic main line is above signal line stochastic is below 30 rsi 5 is below 20 sell stochastic main line is below signal line stochastic is above 70 rsi 5 is above 80 ADD to chart Stochastic k 30 - d 9 - slowing 3, levels 30/70 rsi 5 lelels 20.80
Full alerts push, mobile , email ect All input settings variable feel free to contact for more information or alert sugestions
FREE

"Découvrez NakaTrend : Votre détecteur de tendances ultime pour MetaTrader 5 !
Êtes-vous prêt à révolutionner votre expérience de trading ? Faites la connaissance de NakaTrend, votre indicateur fiable pour identifier avec précision et facilité les changements de tendance.
Avec NakaTrend, ne manquez plus jamais une opportunité de tirer parti des fluctuations du marché. Lorsqu'une tendance haussière se dessine, NakaTrend le signale avec un symbole de dollar vert et vous encourage à passer un
FREE

The famous brazilian trader and analyst Didi Aguiar created years ago a study with the crossing of 3 Simple Moving Averages called "Agulhada do Didi", then later was also named Didi Index, as a separate indicator. The period of those SMAs are 3, 8 and 20. As simple as that, this approach and vision bring an easy analysis of market momentum and trend reversal to those traders looking for objective (and visual) information on their charts. Of course, as always, no indicator alone could be used wit
FREE

Dans de nombreuses stratégies, il est assez courant d'utiliser un ATR à l'échelle pour aider à définir un stop-loss, et il n'est pas rare de l'utiliser également pour des objectifs de profit. Bien qu'il soit possible d'utiliser l'indicateur ATR intégré et de calculer manuellement la valeur de décalage, ce n'est pas particulièrement intuitif ou efficace et peut entraîner des erreurs de calcul.
Caractéristiques Décalage ATR configurable Bande supérieure et inférieure. facteur de mise à l'échell
FREE

FREE Prop Firm Navigator EA - Advanced Trend-Following & Protection Developed by the EA Trading Academy team using Expert Advisor Studio , this free trading robot combines powerful trend-following indicators with a robust set of account protection features to secure your trading capital. You can find a detailed documentation about the properties and inputs on our knowledge base . Key Strategy Features: Uses ADX and Bulls Power indicators for precise entry signals Sophisticated exit strateg
FREE
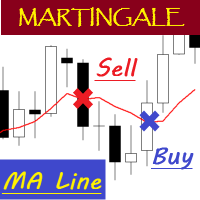
EA "MA Line" with martingale feature
To see how EA works, please watch the video below. In the video, I perform parameter optimization and do a backtest. The parameters that are optimized are: - MA Period - Stop Loss - Take Profit
For the future, I will try to optimize and test EA, especially the expert advisors in the mql5 community. hopefully it can be useful for colleagues in the mql5 community.
FREE

L'indicateur affiche des graphiques minimisés de n'importe quel symbole de n'importe quelle période. Le nombre maximum de graphiques affichés est de 28. Les graphiques peuvent être situés à la fois dans la fenêtre principale et dans la fenêtre inférieure. Deux modes d'affichage : bougies et barres. La quantité de données affichées (barres et bougies) et la taille des graphiques sont réglables. Pour travailler avec un mini chat, vous devez d'abord mettre le ou les indicateurs souhaités sur un gra
FREE

Dessinez des points pivots Traditionnels, Fibonacci, Woodie, Classic, Demark, Camarilla pour n'importe quelle période.
Supporte tous les types de pivot : Traditionnel, Fibonacci, Woodie, Classic, Demark, Camarilla. Supporte tous les cadres temporels (M1...H1...D1...MN1...Annuel) Supporte l'heure d'été du serveur Support de la section quotidienne du forex de l'ouverture de Sydney à la fermeture des États-Unis Support Crypto trading Remplir l'écart entre le pivot et la tendance, très utile
Le
FREE
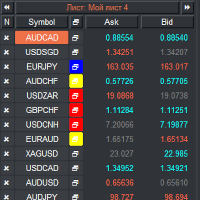
Liste de surveillance VR et Linker - application de filtrage pour le terminal MétaTrader . Facilite la recherche des instruments financiers les plus intéressants et techniques. Ce filtre est utilisé par les traders pour négocier sur des bourses telles que bybit, la Bourse de Moscou, l'American Exchange, le marché des changes et des crypto-monnaies, le marché des métaux, et est utilisé pour le trading dans des sociétés accessoires. La sélection des instruments financiers est effectuée manuellemen
FREE

!! THE FIRST FREE NEURAL NETWORK EA WITH EXCELLENT AND REALISTIC RESULTS.!! Another beautiful work of art, guys you don't know the powerful creations that are created by my developer Nardus Van Staden. Check him out guys and gals, he is the real deal, an amazing person and a professional when it comes to coding and business, if you want work done!, hit him up! you can get in contact with him HERE .
THE FOLLOWING PRODUCT IS A FREE VERSION OF A PAID VERSION THAT IS TO COME, PROFITS ARE GOING TO
FREE
A neural network Expert Advisor based on two moving averages with the training mode. Train the Expert Advisor on selected examples and make a profit in real life. The EA can work on any instrument and in any timeframe.
Trading Algorithm of the EA Two moving averages are analyzed by the neural network core, which produces commands to buy or sell. the values of two moving averages, fast (FMA) and slow (SMA), are provided to the first layer, at the second layer it calculates two neurons responsib
FREE

A combined indicator of two famous indicators: RSI , Bollinger Bands Can be used in all currency pairs Can be used in all time frames with many signals Very simple and fast to use
Description:
This indicator is made from the combination of RSI and Bollinger Bands indicators
As you can see, it shows good signals and is worth using and testing
We hope you are satisfied with this indicator
Settings: show past show candle: Displays the number of candles that the indicator calculates.
For
FREE

RSIBand Pro EA is a hybrid strategy that has been tested and optimized using 100% History Quality from 2012 to 2023. Its main signal is based on Bollinger Bands, with RSI as a confirming signal to identify trends.
Supported currency pairs: AUDCAD Recommended timeframe: M15
MT4 Version: Click Here
Backtest Modelling quality: 100% History Quality Spread: Variable Time Period: 2012 – 2023.10 Symbol: AUDCAD Timeframe: M15 Dynamic lot: Dynamically sets the lot size based on the current b
FREE
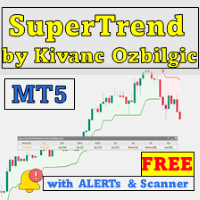
Nous vous présentons le SuperTrend ATR Multiplier with Scanner for MT5 – un outil puissant et polyvalent conçu pour vous aider à anticiper les tendances du marché, avec des fonctionnalités personnalisables et des alertes en temps réel. Basé sur la logique éprouvée du SuperTrend de Kivanc Ozbilgic , cet indicateur offre des signaux de tendance précis. Vous pouvez ajuster la méthode de calcul de l' ATR entre RMA (moyenne mobile relative) et SMA (moyenne mobile simple) pour une flexibilité maximale
FREE

COLORED TREND MA / MACD CANDLES draw MA Candles above/below Moving Average draw MACD Candles above and below 0 and Signal-Line
Your Advantage: a simple view of the trend direction a simple view over the higher trend direction a calmer chart for the eye clear rules can be defined Settings: Value Quick-Set : pre-Settings MACD 3 / 9 / 6 MACD customize MA Candles Fast EMA : 12 Slow EMA : 26 MACD SMA : 9 1. MA Period : default 14 and 20, which are my favorite for all timeframes, I believe in the 1
FREE

Utilisez cet indicateur pour recevoir des alertes sur les tendances qui se développent sur le marché.
En utilisant cet indicateur, vous pourrez recevoir des alertes sur les tendances qui se développent sur le marché au fur et à mesure de leur évolution. Cet indicateur peut être utilisé pour identifier les entrées ou les sorties au sein d'une tendance. L'indicateur combine des informations provenant de périodes plus longues, avec des mouvements de prix de la période actuelle pour générer un si
FREE

Prosperous BOOM MT5 EA is coded based on an advanced strategy primarily for scalping the Boom and Crash in the prices. Complex algorithms were implanted to trade high probability trades in Booms and crash in the prices .
Key Features
Shows trades taken with sl and tp Pop up and sound alerts on computer or laptop For boom only check my page for crash Working with all pairs.
Recommendation
Timeframe : M1 and M4 Recommend pairs :BOOM1000, BOOM500,BOOM300.
FREE

Niveaux institutionnels / Niveaux bancaires ... Niveaux psychologiques / Théorie des trimestres.
Cet indicateur dessinera automatiquement les niveaux « 000, 200, 500 et 800 », ce que je connais sous le nom de « niveaux institutionnels », OU, peut également dessiner les niveaux « 000, 250, 500 et 750 », sur le graphique.
Selon l'endroit où vous avez appris le trading de niveau institutionnel / la théorie des trimestres, vous les connaissez peut-être sous des noms différents, l'idée fondamen
FREE

Trade easily from the chart with CAP Trade Pad EA . It handles risk management for you and can perform several useful tasks with your existing trades. Trade easily from the chart Trade with precise risk management hassle free Set your desired stop loss and take profit levels Close all existing trades with a single click Delete all pending orders with a single click Reap partial profits with a single click It has no input parameters
How to Use Please Read this blog - Details Information in o
FREE
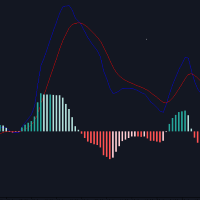
Overview : Introducing the Custom MACD Indicator for MetaTrader 5, inspired by the popular TradingView MACD but enhanced with additional features. This indicator provides traders with more flexibility and better visual cues for decision-making. Key Features : Custom Histogram Colors : Set your preferred color scheme for the MACD histogram to improve visibility and match your trading chart style. Recalculated Histogram Values : Get more accurate signals with our recalculated histogram values, des
FREE

Best Pivot Point Indicator display pivot points and support and resistance lines for the intraday trading. It calculates them using its own formula based on the previous trading session The indicator can display the following levels in addition to plain pivot points: Previous session's High and Low, today's Open. Sweet spots. Fibonacci levels. Camarilla pivots. Midpoint pivots.
FREE

The MACD 2 Line Indicator is a powerful, upgraded version of the classic Moving Average Convergence Divergence (MACD) indicator.
This tool is the embodiment of versatility and functionality, capable of delivering comprehensive market insights to both beginner and advanced traders. The MACD 2 Line Indicator for MQL4 offers a dynamic perspective of market momentum and direction, through clear, visually compelling charts and real-time analysis.
Metatrader4 Version | How-to Install Product | How
FREE

It is the MQL5 version of zero lag MACD that was available for MT4 here: https://www.mql5.com/en/code/9993 Also there was a colored version of it here but it had some problems: https://www.mql5.com/en/code/8703 I fixed the MT4 version which has 95 lines of code. It took me 5 days to write the MT5 version.(reading the logs and testing multiple times and finding out the difference of MT5 and MT4!) My first MQL5 version of this indicator had 400 lines of code but I optimized my own code again and n
FREE

The RSI Divergence Indicator is a powerful tool designed to identify potential reversals in the market by spotting discrepancies between the Relative Strength Index (RSI) and price movement. Divergences can be a significant indication of an impending trend change, either from bullish to bearish or vice versa. This indicator is built for making the task of identifying potential trade opportunities more straightforward and efficient.
Features: Automatic Detection: The indicator scans the cha
FREE

This indicator can send alerts when a Heiken Ashi Smoothed color change occurs. Combined with your own rules and techniques, this indicator will allow you to create (or enhance) your own powerful system. Features Can send all types of alerts. Option to delay the alert one or more bars in order to confirm the color (trend) change. Input parameters Candle shift for alert: Default is 1. Setting it to 0 will alert you on color change on the current candle. This should be regarded as a pending (uncon
FREE
The Expert Advisor (EA) is based on the Dynamic Linear Regression indicator ( https://www.mql5.com/en/market/product/49702 ).
User inputs: Number of candles is considered when calculating linear regression; Distance to the top line; Distance to the bottom line; Stop the loss of. The EA executes purchase and sale orders in the market when the value of a line, higher or lower, is reached at the current price, when the lower line is reached, a buy order at market is executed and when the upper l
FREE

Setup Tabajara was created by a Brazilian trader known as "The OGRO of Wall Street" .
The idea of this setup is to indicate to the trader the current trend of prices and the type of operation should be looked for in the graph.
Operation
It does this through the relation of the closing price position and the of 20 periods, by painting the candles in 4 possible colors : Green -> Price rising in upward trend (Search entry points for PURCHASE) Black -> Price correcting in Bullish Trend
FREE

The original author is David Weis, an expert in the Wyckoff Method. The Weis Wave is a modern adaptation of the 1930's Wyckoff Method, another expert in Tape Reading techniques and Chart Analysis. Weis Waves takes market volume and stacks it into waves according to price conditions giving the trader valuable insights about the market conditions. If you want to learn more about this subject you can find tons of videos in YouTube. Just look for "The Wickoff Method", "Weis Wave" and "Volume Spread
FREE

Display Order box list from Trading box Order Management tool. Find contacts and manual links on my profile . This dashboard gives you an edge in forex trading because in few seconds you can decide which pair and timeframe is worth to watch more closely. This is how you will not be distracted by all other forex pairs that you trade, and you will not miss great opportunities to trade the best price.
Trading Dashboard (order box overview panel and Trading box Order management extension) Tr
FREE

Cet indicateur est basé sur la stratégie proposée par la chaîne YouTube 'The Secret Mindset', sur la vidéo "A Reliable Scalping Strategy I Discovered After 1 Month of Price Action Trading" Une explication complète et détaillée de la stratégie et des conditions pour filtrer les signaux est exposée sur la vidéo. * Le créateur de la chaîne YouTube n'est pas lié au développement de cet indicateur Les signaux doivent être combinés avec d'autres indicateurs et être filtrés par le jugement de chaque t
FREE

This indicator is designed to detect high probability reversal patterns: Double Tops/Bottoms with fake breakouts . This is the FREE version of the indicator: https://www.mql5.com/en/market/product/29957 The free version works only on EURUSD and GBPUSD! Double top and bottom patterns are chart patterns that occur when the trading instrument moves in a similar pattern to the letter "W" (double bottom) or "M" (double top). The patterns usually occur at the end of a trend and are used to signal tren
FREE
Indicator that synchronizes the charts, that is, when the symbol is replaced in one of the charts, all those that appear with the synchronized indicator are changed, with the same timeframe (Same_Timeframe = true) or with different timeframes (Same_Timeframe = false). The graphics to be synchronized are identified by color (Label).
To synchronize the indicators, the indicator must be inserted in all the charts to be synchronized, using the same color (Label).
A box with the chosen color (La
FREE

The Super Boom and Crash Robot operates based on two key indicators: the Relative Strength Index (RSI) and the 200-period Moving Average (MA). It buys when the RSI is above 30, signaling potential for upward momentum, and the 200-period MA is positioned above the current price, indicating a bullish trend. Conversely, it sells when the RSI falls below 70, suggesting overbought conditions, and the 200-period MA is below the price, signaling a bearish trend. This strategy aims to capitalize on pric
FREE

High Low Swing (HLS) Indicator
The HLS indicator is a technical analysis tool designed to identify swing highs and lows in the market, aiding swing traders in making informed decisions. It offers an adjustable "degree" parameter, allowing you to customize the sensitivity to strong price movements based on current market conditions.
Features:
• Clear Buy/Sell Signals: The indicator plots signals directly on the chart, simplifying trade identification.
• Adjustable Swing Strength: The "
FREE

Babel assistant 1
The MT5 netting “Babel_assistant_1” robot uses the ZigZag indicator to generate Fibonacci levels on M1, M5, M15, H1, H4, D1, W1 periods of the charts , calculates the strength of trends for buying and selling. It opens a position with "Lot for open a position" if the specified trend level 4.925 is exceeded. Then Babel places pending orders at the some Fibonacci levels and places specified Stop Loss , Take Profit. The screen displays current results of work on the positio
FREE

If you heard about The Wyckoff Method, Volume Spread Analysis, etc... You are probably searching for the candlestick indicator that shows you the Volume spread all over the current bar, signaling every types of market status... You can control the several Market Levels with custom colors...
It is up to you to decide how to use it. Our job is provide you with the indicator...
If you like this indicator, all I am asking is a little Review (not a Comment, but a REVIEW! )... This will mean A
FREE

Journal des traders : Il s'agit d'un panneau de statistiques fournissant une analyse de votre compte de trading pour MetaTrader 5. Les résultats de l'analyse sont affichés sur le graphique en temps réel. Le trading multidevises est très populaire. Version MT4
Description complète +PDF Comment acheter
Comment installer
Comment obtenir des fichiers journaux Comment tester et optimiser Tous les produits de Expforex Cependant, plus le nombre de transactions est élevé, plus il est
FREE

Découvrez la puissance de l'indicateur Demark Trends pour une analyse complète des tendances et des perspectives de trading. Les indicateurs Demark sont réputés pour leur efficacité dans l'évaluation des tendances du marché et des points d'épuisement. Notre indicateur Demark Trends élève cette expertise à un niveau supérieur en traçant automatiquement des lignes de tendance précises sur vos graphiques. Avec des paramètres personnalisables, tels que le nombre de bougies dans les calculs, les régl
FREE
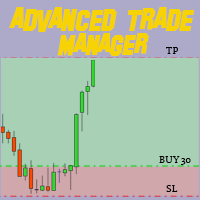
Révolutionnez votre trading avec notre Gestionnaire de Trades Avancé pour MT4 et MT5 Mt4 Version : https://www.mql5.com/en/market/product/107249
Dynamisez votre stratégie de trading avec l'outil ultime de précision et de contrôle – notre Gestionnaire de Trades Avancé pour MT4 et MT5. Contrairement aux gestionnaires de trades classiques, le nôtre s’adapte dynamiquement aux conditions de marché et définit automatiquement des niveaux de stop-loss et take-profit dès l’entrée en position. Caractér
FREE

VWAP Fibo Bands RSJ is an indicator that traces the lines of the daily VWAP and from it creates bands using Fibonacci proportions. This spectacular indicator creates 10 band levels through the selected VWAP period using Fibonacci ratios.
It is fantastic how the prices respect each level of the bands, where it is possible to realize that almost every time the price closes above / below a level of the bands he will seek the next one. If close above will seek to reach the level above and if close
FREE

ขอบคุณ แรงบันดาลใจ จากโค้ชแพม ที่ทำให้เริ่มทำ Close all ตัวนี้ และขอขอบคุณทุกคนที่ให้ความรู็มาโดยตลอด ไม่ว่าจะทางตรงทางอ้อม ขอบคุณทุกคนที่ให้ความรู้เพื่อนร่วมเทรด ทั้งนี้เพื่อให้นักเทรดทุกคนได้มีเครื่องมือในการควบคุมการปิดการซื้อขาย จึงขอพัฒนาโปรแกรม close all version 5 ได้ใช้ทุกคน Close all and update profit Version 1.00 (MT5) Full version Give you free
For MT4 Click https://www.mql5.com/en/market/product/79252
Fix TPSL calculate
Program function
Tab 1 Close order function and sh
FREE

If you have the opportunity to read the book " Trend Trading - A Seven-Step Approach to success " by Daryl Guppy, you will have a great deal of information about how to "read" the market. In his book Daryl show, among other things, how can we use a visual tool to measure the volatility and trend between Long and Short-term periods: The GMMA - Guppy Multiple Moving Averages .
Instead of using his original idea of having 12 Exponential Moving Averages in your chart - which could be very CPU-dem
FREE

Algo Edge EA DE40/Tec100 Lien vers Algo Edge Trail EA et Mega Boost Version ACHAT/VENTE : Téléchargez le robot manuel (conseiller expert) 'Algo Edge' pour le MetaTrader 5 sur le marché MetaTrader (mql5.com) EA auto-apprenant définit simplement l’EA sur le graphique et ne démarre aucune optimisation des paramètres. DE40, US30, Tec100, US500 et bien plus encore. Le conseiller expert multifonctionnel peut échanger avec chaque Indize sans aucune modification. Recomment M1 EA peut négocier avec tous
FREE

The indicator displays a renko chart and a supertrend indicator in real time. After installing the indicator, the window will display the Renko chart and the supertrend indicator in the same window. This allows you to more clearly and visually see the entry and exit points when a trend reversal occurs. The signal to open a position is the intersection of the Renko candlestick of the supertrend indicator point and the appearance of the opposite signal of the supertrend indicator.
The indicator
FREE

The Donchian Channel Channels are among the most popular tools of technical analysis, as they visually convey to the analyst the limits within which most price movement tends to occur. Channel users know that valuable information can be obtained at any time, whether prices are in the central region of a band or close to one of the border lines.
One of the best known techniques to explore these concepts is Bollinger Bands. However, John Bollinger was not the only one to research the applicatio
FREE

GoldGrip GoldGrip is a sophisticated trading robot designed specifically for the XAU/USD currency pair on the 4-hour (H4) timeframe. It offers a strategic approach for traders seeking to capture significant market trends while minimizing the noise and volatility often present in shorter timeframes. Technical Indicators Utilized: Relative Strength Index (RSI) : GoldGrip leverages the RSI to assess the momentum of price movements, helping to identify overbought or oversold conditions. This allows
FREE
Three Sixty Dollar EA
M1 FTMO Strategy: over/under actual Price inp_1:Worktime inp_4/9:Lot Settings Real Account with 200$. Only Pair DE40, US100, US30. Automatic added London Session. This Version works with fixed Lot buy/ sell. Write me privat Message of Questions when undecided. Gratis ex5 Code by Request. Mq5 Source Code for 30$ for Payment of a EA on my Page.
FREE

This indicator uses the Zigzag indicator to identify swing highs and swing lows in the price chart. Once it has identified the swing highs and swing lows, it can use them to determine potential support and resistance levels. A support level is formed when the price drops and bounces back up from a swing low, indicating that there is buying pressure at that level. A resistance level is formed when the price rises and reverses downward from a swing high, suggesting selling pressure at that level.
FREE
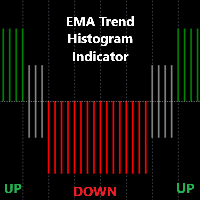
Detailed Description: The EMA Trend Histogram Indicator is a powerful tool for traders seeking clear trend identification based on the widely-used Exponential Moving Averages (EMAs).This indicator provides an easy-to-interpret histogram and helps you simplify trend identification by using the 50 EMA and 200 EMA on two crucial timeframes: H1 and H4. By observing the relationship between short-term and long-term EMAs on multiple timeframes, this indicator provides a quick and clear view of mark
FREE

This indicator was created based on posts from forex factory thread titled There is no Magic Moving Average - You need only one - by @andose2 a.k.a Andrei Florin. If you want to know about how to use this trading strategy please go and read https://www.forexfactory.com/thread/691864-there-is-no-magic-moving-average-you.
Note: Below are extracts some of the posts .
Estabilish a trend, based on Market Cycles, then go only long in the Markup Phase and only short in the Decline phase ,
FREE

This indicator calculates gann support and resistance prices with use gann pyramid formulation and draw them on the chart. And If you want, Indicator can alert you when the current price arrive these pivot levels. Alert Options: Send Mobil Message, Send E-mail, Show Message and Sound Alert Levels: S1, S2, S3, S4, S5, R1, R2, R3, R4, R5 Inputs: GannInputPrice: Input price for gann pyramid formulation. GannInputDigit: How many digit do you want to use for calculation formula. (The number and the
FREE

This indicator calculates fibonacci levels via moving averages trend and draw these lines. You can change fast and slow Moving Averages settings for customization. Inputs:
Fast MA Time Period : 64 Fast MA Shift: 0 Fast MA Method: Smoothed Fast MA Apply To: Median Price Slow MA Time Period: 32 Slow MA Shift: 0 Slow MA Method: Smoothed Slow MA Apply To: Median Price ZigZag: False ZigZag Color: Red ZigZag Type: DashDot ZigZag Width: VeryThin Fibo Settings TrendFibonacci: True FiboTrendColor: Blac
FREE

FVG Fair Value Gap is an indicator that plot rectangle for last found fair value gap. There will be a total of eight fair value gaps. Four is bullish fair value gaps and another four is bearish fair value gaps. Bullish Fair Value Gaps Top Bullish/Bearish Fair Value Gap is the gap that will obey the "Recent candles" and "Nearby Size In Pips" parameters. This fair value gap will be above current price. Bottom Bullish/Bearish Fair Value Gap is the gap that will obey the "Recent candles" and "Nearb
FREE

Highly configurable Trader Dynamic Index (TDI) indicator.
Features: Highly customizable alert functions (at levels, crosses, direction changes via email, push, sound, popup) Multi timeframe ability (higher and lower timeframes also) Color customization (at levels, crosses, direction changes) Linear interpolation and histogram mode options Works on strategy tester in multi timeframe mode (at weekend without ticks also) Adjustable Levels Parameters:
TDI Timeframe: You can set the lower/higher
FREE

Si vous aimez ce projet, laissez un examen 5 étoiles. Suivre l'instagram: borelatech
Comme les institutions échangent de gros volumes, il n'est pas rare pour eux
d'essayer de
défendre leur position à des niveaux de pourcentage spécifiques. Ces niveaux serviront de support naturel et de résistance que vous pouvez
utiliser
soit pour entrer dans un commerce ou être conscient des dangers possibles contre
votre position. Un exemple de pourcentages usuels est de 0,25% et de 0,50% sur EURUSD
FREE

MT4 Version Fibonacci Bollinger Bands MT5 Fibonacci Bollinger Bands is a highly customizable indicator that shows areas of support and resistance. This indicator combines the logic for the Bollinger Bands with the Fibonacci level. Fibonacci Bollinger Bands is the first indicator in the market that allows the user to 100% customize up to 12 Fibonacci levels, the Moving Average type and the price data source to use for the calculations. This flexibility makes the Fibonacci Bollinger Bands easily
FREE
Découvrez comment acheter un robot de trading sur le MetaTrader Market, le magasin d'applications de la plateforme MetaTrader.
e système de paiement de MQL5.community prend en charge les transactions via PayPal, les cartes bancaires et les systèmes de paiement populaires. Nous vous recommandons vivement de tester le robot de trading avant de l'acheter, pour une meilleure expérience client.
Vous manquez des opportunités de trading :
- Applications de trading gratuites
- Plus de 8 000 signaux à copier
- Actualités économiques pour explorer les marchés financiers
Inscription
Se connecter
Si vous n'avez pas de compte, veuillez vous inscrire
Autorisez l'utilisation de cookies pour vous connecter au site Web MQL5.com.
Veuillez activer les paramètres nécessaires dans votre navigateur, sinon vous ne pourrez pas vous connecter.