Regardez les tutoriels vidéo de Market sur YouTube
Comment acheter un robot de trading ou un indicateur
Exécutez votre EA sur
hébergement virtuel
hébergement virtuel
Test un indicateur/robot de trading avant d'acheter
Vous voulez gagner de l'argent sur Market ?
Comment présenter un produit pour qu'il se vende bien
Expert Advisors et indicateurs payants pour MetaTrader 4 - 9

**** PLEASE READ ALL BELOW COMMENTS CAREFULLY !!! PRESET FILES ATTACHED FOR FEW PAIRS IN COMMENT-2 (BASED ON BACKTEST FOR LAST 3 MONTHS ON 99.9% TICK DATA) 1) Time Frame : M15 suggested 2) First Entry : Based on Trend Indicator(s) 3) If Above entry goes in profit, EA books the trade at predefined profit, which may be different for different pairs. This has been found out based on latest 99.9% back tests for all pairs 4) If above entry goes in loss, then the EA starts averaging the trade at pred
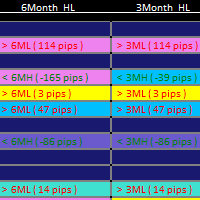
1. Updated usage instructions in blog below: Smart Market Structure Trading System and Automatic Scanner - Trading Systems - 13 October 2023 - Traders' Blogs (mql5.com) https://www.mql5.com/en/blogs/post/754495 2. YouTube video link for introduction: https://youtu.be/tMU04wo0bc8 3. The Smart Market Structure Opportunity Scanner is a great tool to find trading entries and exits based on Smart Money Concepts. It has a build-in custom choice of Forex pair lists to choose from for the scan, and

The market price usually falls between the borders of the channel .
If the price is out of range, it is a trading signal or trading opportunity .
Basically, Fit Channel can be used to help determine overbought and oversold conditions in the market. When the market price is close to the upper limit, the market is considered overbought (sell zone). Conversely, when the market price is close to the bottom range, the market is considered oversold (buy zone).
However, the research can be used

We Trade Live Trend Entry & Exit is another fantastic addition to the the We trade Live trend Indicator collection This Indicator works fantastically well with our other Indicators. This Indicator is primarily used to enter a trade & Exit a Trade , and to alert you when you could possibly take a short or long on a current trend , it provides alerts on when there is a change in direction on the trend you are trading but please make sure you take into account all variables, before entering a trade
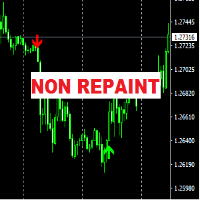
The "FCK Trend Arrow No Repaint" indicator is designed for analyzing market dynamics and determining potential trading signal moments. The main feature of this indicator is the absence of signal repainting, which contributes to more accurate and reliable forecasting of price movements in the market.
Mechanism of Operation: The "FCK Trend Arrow No Repaint" indicator uses several types of graphical elements to indicate trading signals: Up and Down Arrows: The indicator marks possible market ent
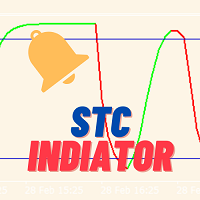
STC Indicator - Boost Your Trading Strategy with Smart Trend Confirmation Description: Enhance your trading strategies and maximize profitability with the STC Indicator for TradingView. Developed by industry experts, the STC Indicator (Schaff Trend Cycle) is a powerful technical analysis tool that combines the best of both trend-following and oscillator indicators to provide reliable buy/sell signals. With its unique algorithm, the STC Indicator effectively identifies trend cycles and confirms

The GGP Chandelier Exit Alert MT4 Indicator is a volatility-based indicator that identifies stop loss exit points for long and short trading positions. Chandelier Exit is based on the Average True Range (ATR) indicator. It is designed to keep traders in the trend until a defined trend reversal happens. Traders use CE to maximize their returns in a trade and make stop loss exit decisions. It is based on the principle that a trend reversal is highly probable when the price of an asset moves ag

Doctor Gold is a multi-functional expert advisor for the MetaTrader 4 terminals. The algorithm of the expert advisor allows you to trade both with the trend and against the trend. Trading with the trend is structured in such a way that each new order is opened only if the previous order has a Stop Loss in the profit zone. Trading against the trend is conducted in order to close unprofitable positions with a profit. The advisor has a large number of settings that allow you to conduct conservati

Hi traders, I'm glad to bring to you the market analysis tool called "Infinity Trend Indicator". The main goal of this indicator is to help you figure-out the beginning of a new trend and the end of the trend current trend. NOTE: THIS INDICATOR DOESN'T REPAINT!! How to use this Indicator 1. Based on the Infinity trend indicator only We look to buy when the yellow line is pointing or curving up after a strong bearish move We look to sell when the yellow line is pointing or curving downward aft

Advanced Rsi Grid Hedge is an expert advisor created to enter the market at times of high probability of a short-term market reversal into overbought or oversold zones, but in the direction of a major trend. The robot uses a grid hedging system. This bot does not use martingale. The Bot is very simple, it uses two RSI indicators to define the entry signals. This also has a trend filter that looks for the best conditions to trade. MT5 Version Here: https://www.mql5.com/es/market/product/99073

Great news from today you can test indicator within1 week absolutley for free! FREE version of indicator https://www.mql5.com/en/market/product/41465 We present you an indicator - Insider Scalper by LATAlab developed by the LATAlab team, that allows you to bring scalping trading to a whole new level of quality! With our strategy you can: Insider Scalper by LATAlab displays a hidden tick chart that is not available in the basic tools of the terminal. Automatically detects and draws strong level

Liquidity Pro The Liquidity Pro pin points liquidity zones in any financial instrument, including currency pairs, cryptocurrencies, commodities, equities and indices. The Liquidity Pro shows previous and current liquidity zones, down to the present minute, providing essential information about your chosen trading pair, when conducting chart analysis or initiating trades. Remember each trading pair requires a different price separation value for M5, M15 and M30 Tally, to provide accurate data. Y
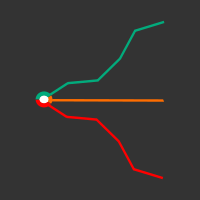
The Spread Ratio indicator allows you to view the ratio between the value of one instrument and another in order to operate with spread trading techniques.
In the image we can see an example of the Spread Ratio indicator on the Brent Oil and Crude Oil instruments. As we see from the image, the Spread Ratio indicator shows the trend of the ratio between these two instruments, allowing us to grasp the misalignments and realignments of the prices.
It is also possible to combine the Spread Rati
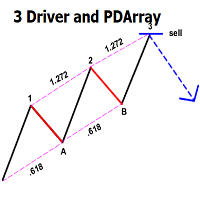
This indicator automatically identifies the SMC 3-Drive pattern and sends notifications to users when the pattern is detected. Additionally, the indicator identifies PDArray (including FVG and OB) and offers an option to combine the 3-Drive pattern with PDArray. This combination provides users with more reliable signals. What is the 3-Drive Pattern? This pattern is formed by three price pushes in one direction, providing a strong reversal signal (Figure 3). The key to identifying this pattern is
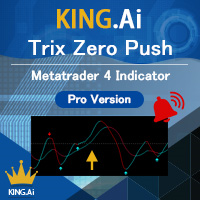
The brand new trading indicator using TRIX strategy is exclusive presented by KING.Ai. Exclusive Functions including Mobile Push Notification . This indicator with Three-mode alerts is developed by KING.Ai ONLY. It is probably impossible that you could find a TRIX indicator like this one. It is very difficult for you to trade with the Trix strategy as there is limited time for traders to monitor every currency. However, the Trix strategy is very profitable especially using in DAY CHAT. It
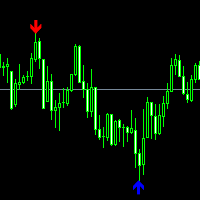
AMS Scalper
An excellent indicator for the entry point into the market; we use indicator signals only according to the trend.
Settings:
Range - 50 (range size for signal search.)
Maximum candles Back - 3 (after how many candles to set a signal)
P.S. For the signal to appear on the zero candle, set 0.
We recommend a trend indicator - Trend Arrow Super
Still have questions? do you need help?, I'm always happy to help, write to me in private messages or
In telegram

Advisor uses 6 trading strategies you can customize each strategy separately. Powered by 7 pairs and 1 timeframe M1 and uses a variety of trading systems. This increases the chances of stable growth and reduces the influence of one pair. The robot uses intelligent averaging system. Advisor is able to self-adjust their work. Instead of searching for values satisfying historical prices for each pair, the adviser uses the values effective on all cylinders, which increases the likelihood of good
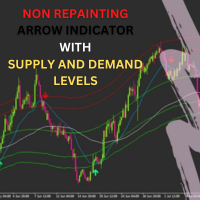
*****ARROWS NON REPAINT ***** Trade With Sam Simple Strategy Guide : https://www.mql5.com/en/blogs/post/740855
MT5 version of the indicator
Try Out and see the Difference
The Sam's Trend Blaster indicator tracks the market trend with an unmatched reliability, by ignoring sudden fluctuations and market noise. It has been designed to trend-trade intraday charts and small timeframes. Its winning ratio is around 85%. This is an arrow indicator that shows precise price reversals. A great ar
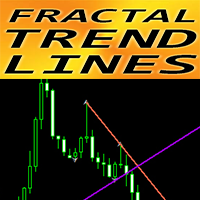
Forex Indicator "Fractal Trend Lines" for MT4 This indicator is excellent for traders who use Graphical Analysis with breakouts!!! "Fractal Trend Lines" shows graphical Up Trend (violet) & Down Trend (tomato color) lines. Up Trend & Down Trend lines are built on 2 nearest corresponding fractals Indicator has few parameters responsible for trend lines color and width I ndicator has built-in Mobile and PC alert of breakout // More great Expert Advisors and Indicators are available here: https:
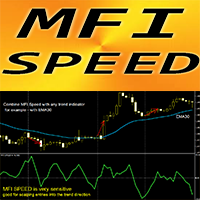
Forex Indicator "MFI Speed" for MT4 The calculation of this indicator is based on equations from physics . MFI Speed is the 1st derivative of MFI itself Money Flow Index (MFI) is a technical oscillator which uses price and volume data for identifying oversold and overbought zones
MFI Speed is good for scalping momentum entries into the direction of main trend Use it in combination with suitable trend indicator , for example standard EMA (as on pictures) MFI Speed indicator

This scanner is monitoring the entire market for trade opportunities for all symbols and for all time frames. You don't have to look to all the charts, for all symbols and for all time frames. This scanner will alert you on your computer, or on your mobile, when a trade opportunity has been found. You never have to miss a trade opportunity! This indicator is designed to scan all pairs and symbols, for all time frames, to find a cross of the MACD main and signal line. MACD Definition
The
Attention!!! Do not try to test the EA in the Tester - it is simply impossible, because the EA opens positions on different 28 instruments. The tester is able to test only one pair.
The EA uses 4 strategies, each strategy uses joint work on several currencies at the same time.
The EA uses 4 stages of control and order tracking for a step-by-step profit capture. Trading is carried out in a pair for several currencies at the same time, trading is also carried out in a group of several str

It predicts the most likely short-term price movement based on advanced mathematical calculations.
Features Estimation of immediate price movement; Calculation of the real market trend; Calculation of the most important support and resistance levels; Algorithms optimized for making complex mathematical calculations with a minimal drain of system resources; Self-adjusting for better performance, so it’s able to work properly at any symbol (no matter how exotic it is) and any timeframe; Compatib
The presented product is an effective trend indicator which, depending on the settings, can be used for both short-term trading (scalping) and medium/long-term trading strategies. The ease of use of the indicator makes it a good choice for both beginners and experienced traders. The essence of the NRTR (Nick Rypock Trailing Reverse) indicator is that it is always located at a constant distance from the reached price extremes - below the chart on uptrends and above the chart on downtrends. The fo

Gold Ratio EA is a fully automated trading system that trades on the pairs XAUUSD on M5 Time Frame. It’s pure Price Action trading, mean reversal system that utilizes peakedness of market distribution to identify trend reversals safely. This Scalping EA uses a unique trading system that combines sophisticated automated trading with user discretion. Gold Ratio is one most advanced scalping systems. Recommend broker Tickmill, Exness.
Benefits Automatic market analysis by author's ind
The leading indicator calculates the most likely places for a trend reversal or stop.
An example of use is shown on the screenshot using the ChainVector trading panel ( https://www.mql5.com/en/market/product/49155 ).
Support: https://www.mql5.com/en/channels/TrendHunter This indicator can be used as a stand-alone trading system or as an additional part of another trading system. Support : https://www.mql5.com/en/channels/TrendHunter
More products are available here: https://www.mql5.com

The Trend PA indicator uses Price Action and its own filtering algorithm to determine the trend. This approach helps to accurately determine entry points and the current trend on any timeframe. The indicator uses its own algorithm for analyzing price changes and Price Action. Which gives you the advantage of recognizing, without delay, a new nascent trend with fewer false positives. Trend filtering conditions can be selected in the settings individually for your trading style. The indicator

The ICT Silver Bullet indicator is inspired from the lectures of "The Inner Circle Trader" (ICT) and highlights the Silver Bullet (SB) window which is a specific 1-hour interval where a Fair Value Gap (FVG) pattern can be formed. A detail document about ICT Silver Bullet here . There are 3 different Silver Bullet windows (New York local time):
The London Open Silver Bullet (3 AM — 4 AM ~ 03:00 — 04:00)
The AM Session Silver Bullet (10 AM — 11 AM ~ 10:00 — 11:00)
The PM Session Silver Bullet

The Nihilist 5.0 Indicator includes Forexalien and Nihilist Easy Trend trading strategies and systems. It is composed of an MTF Dashboard where you can analyze the different input possibilities of each strategy at a glance. It has an alert system with different types of configurable filters. You can also configure which TF you want to be notified on your Metatrader 4 platform and Mobile application
The indicator has the option to view how could be a TP and SL by using ATR or fixed points, even
Keltner MTF (Not repaint!!!) is a channel indicator that can display price channels from different timeframes on a single chart of quotes. For example, on the H1 chart, you can see at the same time the Keltner price channel from the M15 and H4 timeframe. This tactic makes it possible to more clearly understand the tendency of price movements, to determine trading goals and points for making deals. How the Keltner MTF Indicator Works The Keltner MTF indicator can be used both - for trading in

In the "Masters of Risk" trading system, one of the main concepts is related to places where markets change direction. In fact, this is a change in priority and a violation of the trend structure at the extremes of the market, where supposedly there are or would be stop-losses of "smart" participants who are outside the boundaries of the accumulation of volume. For this reason, we call them "Reversal Patterns" - places with a lot of weight for the start of a new and strong trend. Some of the imp

Smart Invest Basic (EA) employs an averaging strategy designed for long-term profitability with low risk. It operates by initiating trades and setting take profit levels. If the market quickly reaches the take profit point, it opens another trade upon the next candle's opening. Conversely, if the market moves against the trade, it employs an averaging technique to secure more favorable prices. The EA's primary approach involves using smaller lots to prevent significant drawdown during

MACD Scanner provides the multi symbols and multi-timeframes of MACD signals. It is useful for trader to find the trading idea quickly and easily. User-friendly, visually clean, colorful, and readable. Dynamic dashboard display that can be adjusted thru the external input settings. Total Timeframes and Total symbols as well as the desired total rows/panel, so it can maximize the efficiency of using the chart space. The Highlight Stars on the certain matrix boxes line based on the selected Scan M

Overview
The Volume SuperTrend AI is an advanced technical indicator used to predict trends in price movements by utilizing a combination of traditional SuperTrend calculation and AI techniques, particularly the k-nearest neighbors (KNN) algorithm.
The Volume SuperTrend AI is designed to provide traders with insights into potential market trends, using both volume-weighted moving averages (VWMA) and the k-nearest neighbors (KNN) algorithm. By combining these approaches, the indicat

FCK Gold Killer Ea is a fully automated trading system that trades on the pairs XAUUSD, US500 on M1 Time Frame. FCK Gold Killer Ea uses an Advanced-Smart Breakout System for Scalping analyses the market conditions. This unique feature allows It’s pure Price Action trading, mean reversal system that utilizes peakedness of market distribution to identify trend reversals safely. This Scalping EA uses a unique trading system that combines sophisticated automated trading with user dis

---------- A TrendTrading Robot ----------
Hello everyone! I am a professional MQL programmer , Making EAs, Indicators and Trading Tools for my clients all over the world. I build 3-7 programs every week but I seldomly sell any ready-made Robots. Because I am fastidious and good strategy is so few... this EA is the only one so far I think its good enough to be published here.
As we all know, the Ichimoku indicator has become world popular for decades, but still, only few people knows the

The EasyFX Trader is a very unique and customizable dashboard for manual trading. It is placed in the Expert folder but is not an auto trading robot. You input all the parameter and the dashboard will monitor and let you know when there is a good trading opportunity. The tool is simple to use whether you're experienced or just a beginner. It was designed for all types of trading styles including price action, day, swing, trend trader, or scalper. Each column is described below. When you load the

## My Dream: Creating a Stable Hedge Robot
"This EA is based on a logic that suddenly came to me before going to bed yesterday. I hurriedly took out my PC and created it so I wouldn't forget it."
It has long been my dream to develop a stable hedge robot. However, despite years of effort, I have struggled to achieve consistent success. Hedge logic is inherently complex, and increasing the number of open positions often leads to larger drawdowns.
To address this challenge, I devised a ne

The "Chart synchronization" utility (the SynchronizeCharts indicator) can help traders in simultaneous trading on multiple financial instruments, as it automatically scrolls all or selected charts of the terminal according to the position of the master chart. Four charts are shown in the screenshot 1. The EURUSD chart is the master chart, as the SynchronizeCharts indicator is attached to it. As a result, the other three charts are displayed on the timeline starting from 2017.02.17 23:15. Any fu

The indicator returning pivot point based trendlines with highlighted breakouts . Trendline caculated by pivot point and other clue are ATR, Stdev. The indicator also includes integrated alerts for trendlines breakouts and foward message to Telegram channel or group if you want. Settings · Lookback bar: Default 200 is number of bar caculate when init indicator. · Length: Pivot points period · Slope Calculation Method: Determines how this lope is calcula

This Indicator uses Center of Gravity (COG) Indicator to find you the best trades.
It is a reversal based Swing Indicator which contains an Arrows Indicator. That you can buy here from Metatrader Market.
Check out this blog post for detailed How to Use Guide and links to free scanner: https://www.mql5.com/en/blogs/post/758262
Scanner needs this arrows indicator in same directory to run
Copy scanner ex4 in same folder as your Arrows Indicator: MQL4/Indicators/Market/ All extra indicators

This strategy is best used for Trend based trading. While market is trending, price still makes smaller ranges. Darvas boxes show breakouts from these small ranges, while still following the original market trend. Detailed Description: https://www.mql5.com/en/blogs/post/747919
Features:
Darvas - Check Darvas Box Breakout
- Check Price Above/Below MA or Darvas Box has crossed MA
- Min, Max Box Height
- Max Distance Between Entry Price and Darvas Box
Other Indicators:
- NRTR Tren
30% discounted ONLY 10 COPIES HURRY UP! 5 LEFT COPIES All Features now have in current version. Very precise patterns to detect High Accurate Order Blocks: It Draw zone after market Structure Breakout with a high Accuracy, institutional orders with the potential to change the price’s direction and keep moving towards it, have been placed. Features Auto Order Blocks Draw Market Structure BOS LINE Auto Imbalance Detect Auto Trend Detect MTF Order Blocks Double Signal One Alert Signal Second Lo

Must be owned and used by Fibonacci traders who like to open position by pending order (limit order). The strategy is that you just have to wait for the automatic custom fibonacci appear then manual place your pending order, stop loss and take profit at the level of Fibonacci. The position will be opened when the price make a successful retest. Fibo Heart Indi come with pop-up alert, email and mobile push notification. Suitable for all instruments and all time frames. Don't miss the trading set

Was 4 EAs in one, now it's 9 in 1!
This is the most powerful EA we have ever made that are up for sale! It contains 9 EAs with different approach on the market. All of them secures your position with takeprofit, stoploss and trailing stop. With an integrated graphic function, you will have a good understanding of how the strategy is performing.
(It may be that they work on forex, but we have not tested them for that)
Please visit my blog section for detailed information how to set this

The purpose of the Combo OnOff indicator is combine differerent tecniques and approachs to the market in order to spot signals that occur simultaneosly. A signal is more accurate if it is validate from more indicators as the adaptive expectations can be used to predict prices.The On-Off feature and alarms help to look for the better prices to enter/exit in the markets
Moving Averages are statistics that captures the average change in a data series over time
Bollinger Bands is formed by upp
CONGESTION BREAKOUT INDICATOR: When you see a sideways price movement in a meaningless market, what goes through your mind? Is it a danger, an opportunity or completely a vacuum? Let's see if we can avoid the latter and focus on using it to our advantage. The ability to read price action through the display of rectangles on the chart could be the boost you need to achieve your trading goals. What is congestion? Congestion is a market situation where the price is trading around a particular leve

The Elder Impulse System was designed by Alexander Elder and featured in his book. According to Elder, “the system identifies inflection points where a trend speeds up or slows down”. The Impulse System is based on two indicators, a exponential moving average and the MACD-Histogram. The moving average identifies the trend, while the MACD-Histogram measures momentum. As a result, the Impulse System combines trend following and momentum to identify tradable impulses. This unique indicator combina

Firstly , the script estimates how many Mx bars of the chart (on which this script is applied) the future trend will most likely continue and what is its quality. Secondly (and most importantly), the script is an auxiliary tool for the extremely mathematically advanced and extremely effective ScientificTrade indicator in trading. The script calculates the optimal averaging period, which is also equal to Mx, of the ScientificTrade indicator, which gives the maximum profit according to the strate
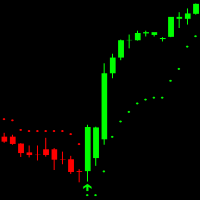
Easy Trend Indicator can be used for all forex pairs, indices and cryptocurrencies. It´s a non rapainting Trend trading indicator and works on all timeframes. GREEN candles show an uptrend and RED candles show a Downtrend. Arrows show when to enter the Market. Indicator has 7 Inputs: Max History Bars = On how many Bars in the Chart the indicator is drawn ATR Period = How many Bars are used for Average True Range calculation ATR Multiplier = Is used for Indicator sensitivity (Higher multiplier =

This indicator is designed to detect the best of all candlestick reversal patterns: Three Line Strike . According to the bestselling author and candlestick guru Thomas Bullkowski, this pattern has a winning percentage between 65% and 84% . This indicator scans for you up to 30 instruments (forex, indices or commodities) on up to 8 timeframes. You can get alerts via MetaTrader 4 and email if a Three Line Strike pattern occurs. Please note: Higher timeframes bring the most reliable signals. This i

Forex Gump is a fully finished semi-automatic trading system. In the form of arrows, signals are displayed on the screen for opening and closing deals. All you need is to follow the instructions of the indicator. When the indicator shows a blue arrow, you need to open a buy order. When the indicator shows a red arrow, you need to open a sell order. Close orders when the indicator draws a yellow cross. In order to get the most effective result, we recommend using the timeframes H1, H4, D1. There

Signal Bands is a sensitive and convenient indicator, which performs deep statistical processing of information. It allows to see on one chart (1) the price trend, (2) the clear price channel and (3) latent signs of trend change. The indicator can be used on charts of any periods, but it is especially useful for scalping due to its high sensitivity to the current market state.
The functions of the indicator : First, the Signal Bands indicator draws channels into which all price fluctuations ex

WaveTrend Momentum Oscillator is an upgrade to the popular and easy-to-use WaveTrend Oscillator. The WaveTrend Momentum Oscillator adds a momentum component to the original WaveTrend calculation, in order to provide faster and more accurate entry points during trendy market conditions. Do you prefer the original WaveTrend Oscillator? The WaveTrend Momentum Oscillator allows you to switch between momentum and original WT versions. Both provide valuable information depending on the market conditio
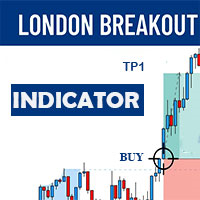
The London Breakout indicator is a technical analysis tool used in the forex market to help traders identify potential breakouts during the opening of the London trading session. This indicator is designed to help traders take advantage of the volatility and momentum that occurs during this time period, which can lead to significant price movements.
The London Breakout indicator works by identifying the range of price movement during the Asian trading session that precedes the London open, an

In statistics, Regression Channel is a approach for modelling the relationship between a scalar response (or dependent variable) and one or more explanatory variables (or independent variables).We Applied relative strength index(rsi) values to develop regression models of various degrees in order to understand relationship between Rsi and price movement. Our goal is range prediction and error reduction of Price divergence , thus we use Rsi Regression
It may be true that “Time waits for no one [human],” but at least now you can control the marching time of all your robots. EA Schedule Launcher (ESL) can launch and close any number of your EAs and/or indicators at custom beginning and ending times. You save your EA and/or indicator to a template and input when to open and close them. The power to control your EAs trading time window can improve both strategy performance and terminal/computer performance.
Note: EA cannot be run with the visu

This unique multi-currency strategy simultaneously determines the end of the trend, entry points and the expected take profit levels for each trade. The indicator can determine entry points on any trading period from M1 to D1. For the convenience of users, the indicator renders the entry point (in the form of an arrow), recommended take profit levels (Fast Take Profit, Middle Take Profit, Main Take Profit, Global Take Profit) and the Stop Loss level. The detailed guide on how to use the indicato

A ready-made trading system based on automatic construction and maintenance of Fibonacci levels for selling and buying for use on any instrument (symbol) and on any period of the chart. Features Detection of trend direction (14 indicators) Construction of horizontal levels, support and resistance lines, channels Selection of a variant for calculating Fibonacci levels (six different methods) Alert system (on screen, E-Mail, Push notifications) Buttons Color scheme switching button. Arrow buttons.
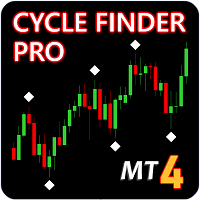
Update - Version 4.0 now includes trend change signal. Indicator will tell you the current trend on all charts. Cycle Finder Pro is a chart reading indicator and is designed for trend and pattern traders . Chart reading is time consuming and complex and requires knowledge of price action , cyclicity, and time frame correlation . Cycle Finder Pro reads all this in one simple indicator so you can spot trend and chart patterns much easier and much faster. To know if a trend exists on a chart you

The EasyTrend is a seemingly simple but quite powerful trend indicator. Everyone has probably come across indicators or Expert Advisors that contain numerous input parameters that are difficult to understand. Here you will not see dozens of input parameters, the purpose of which is only clear to the developer. Instead, an artificial neural network handles the configuration of the parameters.
Input Parameters The indicator is as simple as possible, so there are only 2 input parameters: Alert -

"The trend is your friend" is one of the best known sayings in investing, because capturing large trendy price movements can be extremely profitable. However, trading with the trend is often easier said than done, because many indicators are based on price reversals not trends. These aren't very effective at identifying trendy periods, or predicting whether trends will continue. We developed the Trendiness Index to help address this problem by indicating the strength and direction of price trend

Advanced Currency Strength Indicator
The Advanced Divergence Currency Strength Indicator. Not only it breaks down all 28 forex currency pairs and calculates the strength of individual currencies across all timeframes , but, You'll be analyzing the WHOLE forex market in 1 window (In just 1 minute) . This indicator is very powerful because it reveals the true movements of the market. It is highly recommended to analyze charts knowing the performance of individual currencies or

VR Sync Charts is a tool for synchronizing layout between windows. INDICATOR DOES NOT WORK IN STRATEGY TESTER!!! How to get a trial version with a test period, instructions, training, read the blog https://www.mql5.com/ru/blogs/post/726504 . VR Sync Charts allow you to synchronize trend levels, horizontal levels and Fibonacci layout with all charts. With this you can synchronize all standard graphic objects in the MetaTrader terminal. All your trends, Gann lines and other objects are exactly cop

1. Compound Drawings (1) Line segment with arrow (2) Continuous line segment (broken line) (3) Parallelogram (4) Polygon (5) Profit and loss ratio measurement tools
2. Backtracking By the Z key in the process of drawing the line Line types that support Z-key backtracking: continuous line segments (broken line) ,channels,parallelograms,polygons, and fibo extensions.
3.Automatic Adsorption (1) Click the "Lock-Button" to switch the automatic adsorption switch before drawing the line (2)

Get all benefits of a grid strategy and none of its disadvantage | Built by a grid trader >> for grid traders.
This is MT4 version, click here for Blue Sonic Donchian MT5 (settings and logics are same in both versions) Real monitoring signal --> Sonic Gold | Sonic Fx Intro BlueSonic Donchian EA ('Sonic') is a next-gen multi-currency multi-timeframe EA base on Donchian indicator. Other than normal one-off entry, users would have option to activate grid series to max

This indicator presents an alternative approach to identify Market Structure. The logic used is derived from learning material created by DaveTeaches (on X)
When quantifying Market Structure, it is common to use fractal highs and lows to identify "significant" swing pivots. When price closes through these pivots, we may identify a Market Structure Shift (MSS) for reversals or a Break of Structure (BOS) for continuations. The main difference with this "protected" logic is in how we determine

Waddah Explosion Scanner Features : - Waddah Trend, Explosion Increase/Decrease
- Trend Percentage with Threshold
- DeadZone
- Trend Direction Aligned Checks
- Highlight and Alerts
- Multi-Timeframe & Multi-Currency
Check out the blog post for more info: https://www.mql5.com/en/blogs/post/758020
Customizable Threshold: With customizable threshold, you can identify best trading opportunities in volume-based trading. Use Trend Height (x times Explosion) : Trend height in relat

BeST_Darvas Boxes EA is an MT4 Expert Advisor that is based on the most classic trading method developed in the 50's by Nicolas Darvas commonly known as The Darvas Boxes Trading System. The Original Darvas Boxes System can be found in details in his book "How I Made $2,000,000 In The Stock Market" (Copyright 1960, by Nicolas Darvas).
Although the original system was designed to trade only Stocks and to open only Long trades its trading principles can also be applied to many other Markets
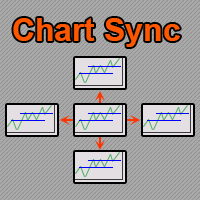
Indicateur Chart Sync - conçu pour synchroniser les objets graphiques dans les fenêtres de terminal. Pour travailler, installez l'indicateur sur le graphique à partir duquel vous souhaitez copier les objets. Les objets graphiques créés sur ce graphique seront automatiquement copiés par l'indicateur sur tous les graphiques portant le même symbole. L'indicateur copiera également toutes les modifications apportées aux objets graphiques. Paramètres d'entrée: exception - préfixe du nom d'un objet gra
Le MetaTrader Market est la seule boutique où vous pouvez télécharger un robot de trading de démonstration gratuit pour le tester et l'optimiser à l'aide de données historiques.
Lisez l’aperçu de l'application et les avis d'autres clients, téléchargez-la directement sur votre terminal et testez un robot de trading avant de l'acheter. Seul MetaTrader Market vous permet de tester gratuitement une application.
Vous manquez des opportunités de trading :
- Applications de trading gratuites
- Plus de 8 000 signaux à copier
- Actualités économiques pour explorer les marchés financiers
Inscription
Se connecter
Si vous n'avez pas de compte, veuillez vous inscrire
Autorisez l'utilisation de cookies pour vous connecter au site Web MQL5.com.
Veuillez activer les paramètres nécessaires dans votre navigateur, sinon vous ne pourrez pas vous connecter.