Regardez les tutoriels vidéo de Market sur YouTube
Comment acheter un robot de trading ou un indicateur
Exécutez votre EA sur
hébergement virtuel
hébergement virtuel
Test un indicateur/robot de trading avant d'acheter
Vous voulez gagner de l'argent sur Market ?
Comment présenter un produit pour qu'il se vende bien
Expert Advisors et indicateurs payants pour MetaTrader 4 - 61

The basis of the work of the Patterson Expert Advisor is based on trend trading, the direction of which is determined by indicators. In the input parameters of this trading robot, the minimum number of settings for the user, which on the one hand fetters experienced users who like experiments, and on the other hand, simplifies the work for a beginner and protects him from possible errors in using the settings.
The expert works using sharp ticks. The uniqueness of the expert is that it can be

The Alive Trend arrow indicator shows potential entry points into the market in the form of arrows of the corresponding color: up arrows (blue) offer to open a purchase, down arrows (red) - to sell. Alive Trend visually “unloads” the price chart and saves analysis time: there is no signal - there is no deal, if a return signal appears, then the current deal should be closed. It is supposed to enter the next bar after the pointer, but there may be non-standard recommendations for each strategy.

PROFITABLE HIGHER AND SAFER - Kakarot EA uses indicators combined with AI algorithm according to the principle of trend detection and trend matching. - The principle of order balancing, low DD protects accounts better for high profits. - Flexible command entry and exit - Works on all pairs, preferable to major USD pairs. - Support trade manual methods. - Provide effective bot management parameters at your own discretion to be able to bring a much higher profit. Help Manual Bot config

The principle of this indicator is very simple: detecting the trend with Moving Average, then monitoring the return point of graph by using the crossing of Stochastic Oscillator and finally predicting BUY and SELL signal with arrows, alerts and notifications. The parameters are fixed and automatically calculated on each time frame. Example: If you install indicator on EURUSD, timeframe M5: the indicator will detect the main trend with the Moving Average on this timeframe (for example the Moving
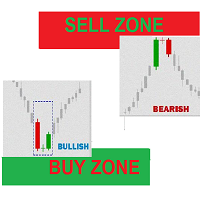
Buy Sell Zones Simple indicator for moving BUY / Sell Zones and Buy / Sell Signals generated with indicator moving Buy and Sell zones : Closest zone is wide and clear : Red for Sell zone , Green for Buy zone >>> old far zones are in bold lines :::BUY Zones (GREEN) appear only in UP Trend and disappear in DOWN Trend :::SELL Zones (RED) appear only in DOWN Trend and disappear in UP Trend input parameters ::: index bars : bars range for zone calculation levels : number of zones Up move/Down mov
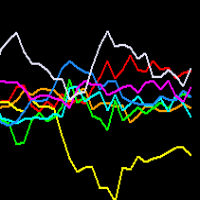
Select the strongest and weakest combination of 28 currencies. You can enter the market before the trend starts or wait for the price to reverse. The specific operation depends on yourself. Can be used in combination with other strategies and indicators. For example, my other indicator of reverse trend line. https://www.mql5.com/en/market/product/51046 Wish you make money in the market. If you have any questions in use, please contact me.

General information The indicator determines the areas of flat and trending market states by comparing the average and current volatilities. Flat areas are rectangles of a user-defined color. It is easy to determine the maximum and minimum of the flat area, as well as its height in points. The beginning of each trend area is marked with an arrow indicating the direction of the trend.
Tuning parameters
1. Averaging period - period for calculating average volatility
2. Color of flat regio

Qiwi EA is a fully automatic Forex trading system. The system monitors the trend, tracks the actions of large traders in the Asian session and trades with them. The expert does not use dangerous trading methods, does not use a high frequency of transactions, and most importantly, is not sensitive to the spread. An expert is also suitable for dispersal of a deposit. Several trading modes: aggressive, calm. It all depends on your preference.
I am ready to help you set up an expert for
The brand new trading indicator Trendline Tunnel is presented by KING.Ai. This indicator were built base on the the theory of Latest Up and Down Trend line . Latest Trend are difficult can by seen by human eye. Indicator can help to identical the Trend . KING.Ai Forex trader mainly use this strategy to "See Through" market . We do believe that it is a powerful method to show the latest trend and do the breakout trade strategy . General speaking, Trendline Tunnel have following using: Method
Ultimate Daily Breakout Expert Advisor
Many trading stratergies look to trade daily trend swings by defining levels based on the previous day's high and low on the daily chart. When these levels are broken, price tends to trend in that direction sometimes for 100s of pips. This EA is a tool to both look for these patterns though backtesting and then after being found to trade them live. The Ultimate Daily Breakout EA can be optimised for and used on any currency pair, commodity, stocks or sha

This indicator is to follow the trend. When the closing price breaks the trend line, it may mean that the trend has to be reversed. It is cashing well in the trend. It has only two parameter settings. Parameter setting: deviation:15 "deviation" is Follow the distance between the current high and low points. depth:24 "depth" is Depth of high and low points. This is just the default parameter, you can optimize it in use.

The Expert Advisor advantages: Opening the first order is designed to close by Take Profit, that is, the strategy uses the grid only to increase profit and reduce loss! Hurry to buy an adviser Net Spider in the first 2 days, super price only 199$ Watch a detailed video working with our expert Revised loss behavior strategy. Now the client limits the loss himself. Exactly the amount he wants, we recommend setting not bigger half the deposit, That is the maximum that we recommend. Principle o

I will support only my client. สำหรับลูกค้า Parameters
General Trade Settings Money Management
Lot : Fixed (can change) Strategies - M1-D1 Strategies it is fixed with MA, Bollinger band, Candlestick Levels Close Functions - M1-D1 Strategies Close by Money Profit - Close Total Open Profit, Close Total Open Profit Short, Close Total Open Profit Long, Close Profit/Loss Today MagicNumber - individual magic number. The EA will only manage position of the chart symbol with this magic number.

BPS Panel
Breakout Pro Scalper Solution Panel
This indicator is part of the RPTrade Pro Solutions systems. BPS Panel is a daily trend indicator using Price Action, Dynamic Support and Resistances. It's designed to be used by anyone, even the absolute beginner in trading can use it. NEVER repaints . Indications are given from close to close . Designed to be used alone , no other indicators are required. Gives you the trend and potential Take Profit at the beginning of the day.
How

The principle of this indicator is very simple: detecting the trend with Moving Average, then monitoring the return point of graph by using the crossing of Stochastic Oscillator and finally predicting BUY and SELL signal with arrows, alerts and notifications. The parameters are fixed and automatically calculated on each time frame. Example: If you install indicator on EURUSD, timeframe M5: the indicator will detect the main trend with the Moving Average on this timeframe (for example the Moving
Mean Reversion Probability indicator is a tool based on a mathematical theory of mean reversion . As the markets very often shows the behavior of diverging from its mean, up to a certain distance, and then start to converge its mean again. This is a very well known phenomenon in stochastic processes and the price series is also a stochastic variable so we apply certain mathematical and statistical procedures to estimate the turning point .
Using Mean Reversion indicator, traders could potential
Trend Direction Estimation * Please use the free demo before renting or buying. This indicator works in all kinds of frames and presents you the trend in the time period you choose. This trial period (Rental for 1 month) offered for promotion is valid for a limited number of copies. At the end of the trial period, longer term rental and unlimited purchase options will also be opened in it's new prices. My expert advisor work is continuing for the strategies I have been developing for the Trend

A new trend determination algorithm has been developed for this indicator. The algorithm with acceptable accuracy generates input signals and output levels. Strategy for trend trading, filtering and all the necessary functions built into one tool! The principle of the indicator’s operation is to automatically determine the current state of the market when placing it on a chart, analyze historical data based on historical data and display instructions for further actions on the screen to the trad

The Unexpected indicator is surprisingly easy to use. You will appreciate the simplicity of the indicator in the very first days of trading. If you correctly determine the beginning of the trend, the result of the transaction will be appropriate. Trading based on trend indicators is the simplest and often the most effective. If you use a live binary options chart as a base, the chances of success are even higher.
This indicator can track the steady price movement in a certain direction. In th

An indicator that determines the point levels of price resistance. The arrows indicate price bounces in the indicated directions.
Arrows are not redrawn formed on the current candle, shown on the previous candle for convenience.
It has one setting - the formation intensity:
If the parameter is smaller, most of the signals are formed in a wide trend. If the parameter is larger, signals are formed in a narrower trend.
Input parameters
Formation Intensity - Arrow Formation Intensity Num
Description
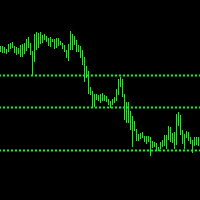
ABC Trend Levels Pro is an indicator that identifies market trends and important trend support and resistance levels.
Recommendations
You can use this indicator to determine the trend and, accordingly, to determine the direction of opening a position or closing an opposite position.
Parameters
===== _INDICATOR_SETTINGS_ ===== - indicator settings Maximum History Bars - maximum number of history bars for calculating the indicator. Average True Range Period - ATR indicator

Description
ABC Trend Levels is an indicator that identifies market trends and important trend support and resistance levels.
Recommendations
You can use this indicator to determine the trend and, accordingly, to determine the direction of opening a position or closing an opposite position.
Parameters
===== _INDICATOR_SETTINGS_ ===== - indicator settings Maximum History Bars - maximum number of history bars for calculating the indicator. Average True Range Period - ATR indicator perio
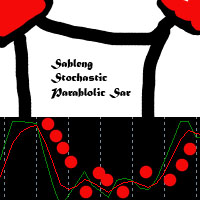
Trade signals of advanced parabolic sar, and stochastic indicator Best used 1-2 hours after high impact news after the robot makes an order and get a profit or loss, the robot will automatically stop , so your capital is maintained, you can set how many points you want, but you cannot change the loss you want , you can change the amount of loss you want if the order already occurred tips take profit 50 to 150 points You can set the robot active at a certain time if the robot has gain

Trend Direction Arrows * Please use the free demo before renting or buying. This indicator works in all kinds of frames and presents you the trend in the time period you choose. You can try to enter the bars in the bars where the arrows are formed or it helps you to understand the trend direction in the time period you look at. This trial period (Rental for 1 month) offered for promotion is valid for a limited number of copies. At the end of the trial period, longer term rental and unlimited pu

Scalping Line is an advanced average that we created for use in our trading strategy. The essence of our trading strategy is to open a buy deal when the line is blue and the price drops below the line. Or open a sell deal when the price rises above the line, and the color of the line is red. Thus, we open deals when the price for a short distance goes in the opposite direction from the general trend. We close the deal when we get the minimum profit. We trade on the timeframe M30 or H1. Better to
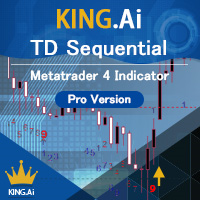
The brand new trading indicator using the TD Sequential strategy is presented by KING.Ai. This indicator were built base on the the theory of TD Sequential . TD Sequential difficult can by seen by human eye. Indicator can help to identical the pattern . KING.Ai Forex trader mainly use this strategy to "See Through" market . We do believe that it is a powerful method to predict reversal time of trend . Ross Hook were developed by Tom Demark, In the late 1970s he devised some indicators called

Signal Tester and Trader is an Expert Advisor that is capable to reading most indicators (except for indicator that has string as an input). Custom backtest the signal on a live chart and trade the signal on live account.
The expert has 2 modes: Backtest mode (custom backtest on current indicator and strategy settings) Trading mode (trade based on current indicator and strategy settings) Available Indicator types: Two cross indicator: indicator that generates a signal when 2 lines crossed each

The indicator shows the regression channel, in the calculation of which the gold Fibonacci section is used Levels are not built as graphical objects, but use indicator buffers - this allows using this indicator in Expert Advisors Near the channel borders price corrections and reversals are most probable Allows trend and counter trend trading within the channel The slope of the channel shows the direction of the market, and its width - the current volatility. Works on all timeframes, all currency
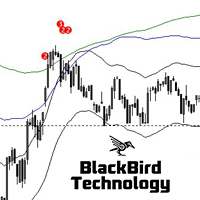
Multi MA Band Signal Indicator is a no-nonsense, no delay, no repaint indicator !
Moving Average bands together with a RSI filter is a 'simple', but very powerful and reliable signal.
Five "moving average bands" generate the signals. By default : MA25, 50, 100, 200 and 400. This can be changed in the parameters as well as the MA mode and the MA band deviation. The signal indicates the number of moving average bands that are crossed. The higher the value the stronger the signal. Two signal l

The principle of this indicator is very simple: detecting the trend with Moving Average, then monitoring the return point of graph by using the crossing of Stochastic Oscillator and finally predicting BUY and SELL signal with arrows, alerts and notifications. The parameters are fixed and automatically calculated on each time frame. Example: If you install indicator on EURUSD, timeframe M5: the indicator will detect the main trend with the Moving Average on this timeframe (for example the Moving
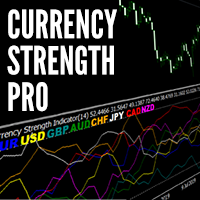
The Currency Strength Meter is the easiest way to identify the strongest and weakest currencies in the market. It works by applying clever calculations to 28 Forex pairs to establish which currencies are the driving force behind price action. By trading strength against weakness, we can greatly increase our chances of success and find some of the highest probability trends to trade. Technical Information
The strength meter uses the relative strength meter which is applied to all 8 major curren

本EA采用两个MACD指标在两个时间周期里面同一时间达到开单条件来做多或者做空,EA不设置止损止盈参数没有过多的繁琐设置, 固定手数,对本金要求也不是很高,0.01手50USD-100USD都可以做!!! 由于本EA采用的是两个周期MACD符合条件才开单平仓,所以在自动交易前一定要进行交易品种的数据优化,从中找到最佳的数据设置, 由于优化这个过程很费时,所以现在只公布了一个参数设置,这个设置不是最好的设置但回测的数据看着还可以,如果你有时间可以自己优 化更好的设置参数!!! 希望大家在使用过程中有更好的建议,可以提出来大家共同讨论,让这款EA更好!最后,如果你有更好的设置参数可以的话记得 评论区留言!!!

The principle of this indicator is very simple: detecting the trend with Moving Average, then monitoring the return point of graph by using the crossing of Stochastic Oscillator and finally predicting BUY and SELL signal with arrows, alerts and notifications. The parameters are fixed and automatically calculated on each time frame. Example: If you install indicator on EURUSD, timeframe M5: the indicator will detect the main trend with the Moving Average on this timeframe (for example the Moving

Авторский советник Salary Trend EA с широкой диверсификацией до 7 валютных пар. Эксперт размещает на выбранном расстоянии отложенные ордера (стоповые или лимитные). Присутствует уникальный алгоритм фиксации прибыли по всей корзине ордеров - данная функция значительно снижает риски, которые присутствуют у классических роботов. В советнике предусмотрен манименеджмент, можно торговать как фиксированным лотом, так и процентом от депозита. Имеется адаптивная система перекрытия просадок , трейлинг ст
Scalp SWING indicator.
It works on any time frame and Instruments
It works on trending and ranging markets.
The signals are robust and does not repaint.
The system is robust and requires no supporting indicator.
You don’t need any multiple indicators to trade the markets.
The alerts/ notifications can be enabled to gain prompt entries.
The entries are at Top and Bottom of Trend Cycles
It is Very accurate and robust system- yet extremely simplified tools for the pro traders.
Sc

GOLD GO GOAL ( GGG SYSTEM )
NEW RELEASES..!! Updated June 2020 Pure Indicator Technical Not Martingale Not Hedging Not Grid Less risk / More reward
Lots Size : 200 $ / 0.01 standard lots
Currency : best on GOLD (XAUUSD) & SILVER (XAGUSD) ********** : ( not recommended ) NZD , JPY , CHF
Time Frame : H1 ( recommended ) or higher
Survive on Sideway / Strong gain on Trend / Lower Drawdown ( less than 30% )

The indicator shows key volumes confirmed by the price movement.
The indicator allows you to analyze volumes in the direction, frequency of occurrence, and their value.
There are 2 modes of operation: taking into account the trend and not taking into account the trend (if the parameter Period_Trend = 0, then the trend is not taken into account; if the parameter Period_Trend is greater than zero, then the trend is taken into account in volumes).
The indicator does not redraw .
Settings Histo
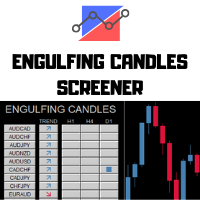
---> Check all the other products <---
The Engulfing Candles Screener is a deeply customizable dashboard.
You can chose a trend filter, using 2 EMAs, with custom periods applied on a custom TimeFrames Then you can choose 3 timeframes to search, any TimeFrame is suitable and the screener will find the engulfing candles in the selected timeframe. 3 Timeframes to scan All the major forex pairs and crosses - up to 28 symbols Deeply Customizable
How to setup the screener:
Let the crosses v
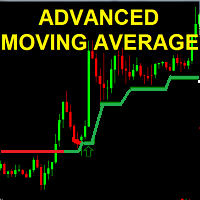
the Advanced MOVING AVERAGE indicator This is a formula of moving average based on support and resistance levels Two Colors indicator : UP trend --> Green Down trend -->Red Arrows UP/Down are shown for trend reversal indication ALERTS and mobile Push NOTIFICATIONS Simple Strategy : BUY on price over new green line Sell on price under new red line
Works on any TIMEFRAME MAin Input for calculation : index = 20.. 50..100..500 ... 1000 (Lower time frame -> Hi

Strategy quick description :
- Forex trading on H1 time unit
- The daily pivot point (DPP) defines the trend
- Buy or Sell when SMA15 cut with DPP regarding SMMA5 and RSI10 and the last candle values
- Close positions when SMA15 cut-reversed DDP
- Do not take position before the 02:00 AM
- Multiple positions are allowed, default = 5 positions
- Risk management, default Exposure = 1% for each order
- Use of a Stop Loss
- Positions can stay opened several days
- Do not take positi
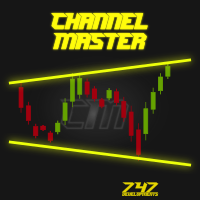
Channel Master is unique indicator for automatic channel finding. This indicator is fully adjustable by user. User can also put more instances of Channel Master to one chart with different channel size for better trend filtering. To find more information visit the 747Developments website. Features
Easy to use (just drag & drop to the chart) Fully adjustable Accessible via iCustom function Possible to use with any trading instrument Possible to use on any time-frame

IntradayMagic predicts the nature of ATR and tick volumes for 1 day ahead. The indicator does not redraw and does not lag behind. Using Intraday Magic, you can significantly improve the quality of trading and avoid unnecessary risks. According to its indications, you can detect the crisis state of the market and the moments of trend reversal, specify the moments and directions of entries. How the indicator works Periodic events, exchange schedules, Bank schedules, expirations, and other similar
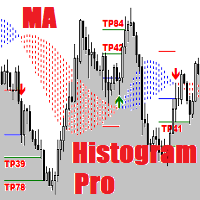
MA Histogram Pro is an expensive version of the indicator. It is equipped with the second Take Profit (TP) and is more equipped ( has a positive optimization method) than its cheaper brother. Simple and effective system with automatic optimization. See my forecasts .
MA Histogram are used primarily as trend indicators and also identify support and resistance levels.
Equipment:
Take Profit 1 Take Profit 2
Stop Loss Automatic optimization Result R/R Consecutive losses

The 'DartFX by WPR' is an easy-to-set Expert Advisor. Williams Percentage Range Williams %R, also known as the Williams Percent Range, is a type of momentum indicator that moves between 0 and -100 and measures overbought and oversold levels. The Williams %R may be used to find entry and exit points in the market. The indicator is very similar to the Stochastic oscillator and is used in the same way. It was developed by Larry Williams and it compares a stock’s closing price to the high-low r

Cherokee - is a professional adviser based on a trend tracking system with an adaptive algorithm. New sets are in the "Comments" section comments #2-3. Signal: 6 currency pairs Main Advantages 6 currency pairs; The EA does not use Martingale; The minimum starting deposit is $300; No need to close the robot during news releases; It works with 4 and 5-digit quotes; A multi-level model of a quantum set.
Working parameters Currency pairs : EUR/USD, GBP/USD, EUR/CHF, USD/CHF, USD/CAD, USD/JPY ,
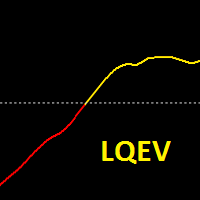
LINEAR QUADRATIC ESTIMATION OF VELOCITY OSCILLATOR Linear quadratic estimation (LQE) is an algorithm that generates predictions of unknown variables observed over time using statistical noise and other inaccuracies and predicts a single measurement more accurately than those based on it. linear quadratic estimation of velocity oscillator shows trend. You can use this oscillator all pairs and on all timeframes. Better results are H1 and H4.

High-accuracy trend indicators, please use in 1H timeframe,Try not to use it in other cycles,Can be used on any currency pair. This indicator is a trend indicator, which can accurately judge the trend. Can be combined with other indicators to increase accuracy. Can be used as a good entry point, will continue to optimize if you have any questions, please contact the author.

Henry - An indicator by which you can determine the levels and trend. The indicator calculates the saturation levels of the price chart. A signal to exit the resale area is a buy signal. A signal to exit the overbought area is a sell signal. Usually, you need to set relative values for the overbought and oversold levels of Bottom and Top - for this indicator.
Most often, a good trend is visible on the price chart visually. But an experienced trader must clearly understand the current balanc

The Perspective Trend indicator tracks the market trend with very high reliability. All intersection points will be ideal points at which the direction of the trend changes. Sharp price fluctuations, as well as noise around averaged prices, are ignored. Signal points, places where color changes, can be used as points of potential market reversal. The indiuctor algorithm implements a kind of technical analysis based on the idea that the market is cyclical in nature. This development can be used b

Are you tired of the constant ups and downs? It is not worth becoming a victim of unstable market movements, it is time to somehow get rid of it! Already now, you can use Business Trend solutions to balance the analysis of price movements and get a clearer picture of price behavior.
Business Trend is a trend indicator for the MetaTrader 4 trading platform. This indicator allows you to find the most likely trend reversal points. You will no longer find a copyright indicator like this. A simple

This indicator supports fast drawing of trendlines 1. Support drawing the next peak higher than the previous peak 2. Support drawing the lower peak after the previous peak 3. Support drawing the lower bottom of the bottom. 4. Support to draw the lower bottom higher than the previous bottom. 5. Support drawing trendline across the price zone. Peak connected vertex 6. Support drawing trendline across price range. Bottom connected Link to download and use for free. Including 02 files s

The Fiery expert system works with ticks on all types of accounts. For an internal algorithm, the elementary unit of analysis is a tick.
The expert system does not use the history stored in the database to work. For his own needs, he uploads historical data online, creating his own database. To achieve good results in real tick mode on the tester, it is necessary to carry out optimization.
The internal optimizer, having carried out optimization according to the indicated principle, selects

The trader uses the Trend for Neuro indicator to determine the market situation. This is a trending algorithm that is convenient to download, install and use. The algorithm with acceptable accuracy generates input signals and output levels. Strategy for trend trading, filtering and all the necessary functions built into one tool! By launching the indicator, the user will see only two types of arrows that can change color to blue during an uptrend, to red during a downtrend there is no uncertaint

Halley´s comet it is a Secure Automated Software for trade Forex market and indices.
The architecture is a Fully Automatic Autonomous Robot Expert capable of
Independently analyzing the market and making trading decisions Halley´s comet It is an advanced trading system. This is a fully automatic Expert Advisor. Halley´s comet . It is a 100% automatic system, The system is self-sufficient, performing all the work. Is a revolution in the customization of the trading.
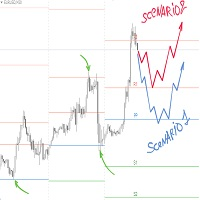
Pivot Point is a technical tool widely used by traders to predict major support and resistance price levels by calculating previous history and to predict the current price reversal points. Traders want to determine about the swing point from which there should be much possibility that the market price will be getting back, in such analysis pivot point plays an important rule. Different site explaining the logic of pivot point as:
A technical analysis indicator used to determine the overall t

Currency - Eur/Usd Candle Time - 5m for best results Recomended Broker - IG Leverage - 1:200 Minimum Deposit - $100 Fully Automated EA for Longs and Shorts You can adjust to whichever RSI period and value you want. -RSI PERIODS & VALUES WHEN THEY CROSS ARE ALL ADJUSTABLE IN THE INPUTS & THE TAKE PROFIT AND STOPLOSS OF HEDGING LONG AND SHORT TRADES.
Default settings are to... *When a LONGS trade is put on it puts in a Short at the same time. If the Short goes above 20 pips it will hit Stop

Buy and sell settings fixed H1. expert advisor does work in the all time frames. Important Main Trend Buy and Sell : You can set TP and SL to zero (0). In this case, transactions are automatically closed at maximum level during trend conversion times and continue to trade according to the trend. If you choose to use each TP and SL, each trend opens a process for change. However, the trend continues to trade in the direction of trend in the transformation. You can use it on all parities. No rest

FBO Trend Admiral is a professional yet simple to use trend following system. It detects the prevailing trend and gives entry points as arrows. To determine the trend it uses a unique filtering algorithm. Suitable for defining entry points for scalping as well as for intra-day trading. Features Works with the prevailing market trend. Suitable for all markets (currency pairs, metals and indices). Ideal for short time trading on the M1, M5 and M15 time frames. Does not redraw/repaint the arrows
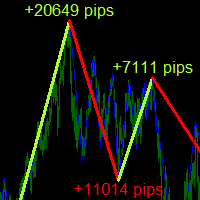
Description
ABC Trend Detector Pro is an indicator that identifies impulses and trends in the market and displays their presence on the price chart. Found patterns are drawn as colored connecting lines between their highs and lows. Above / below each extreme, the value of the range (the number of pips) of the trend is displayed.
Recommendations
You can use this indicator to determine the trend and, accordingly, to determine the direction of opening a position or closing an opposite posit
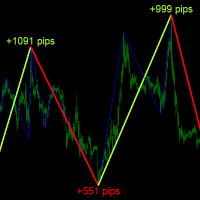
Description
ABC Trend Detector is an indicator that identifies impulses and trends in the market and displays their presence on the price chart. Found patterns are drawn as colored connecting lines between their highs and lows. Above / below each extreme, the value of the range (the number of pips) of the trend is displayed.
Recommendations
You can use this indicator to determine the trend and, accordingly, to determine the direction of opening a position or closing an opposite positi

TrendLinesEA "is a tool designed to trade according to the trend lines drawn by the internal indicator or drawn by the trader manually. The expert relies on two trading signal extraction systems (SPIKE & ROLL). SPIKE MODE : - The signal is generated when the price breaks through the trend line and then rebounds to break it again. ROLL MODE :- A signal and a bounce is created when the price touches the trend line. You can activate one or both of the signaling systems by placing a check mark on

Stochastic BR allows you to recognize reversals professionally. The "Stochastic BR" is designed to recognize profitable counter trend patterns from your chart. Stochastic Indicator: This technical indicator was developed by George Lane more than 50 years ago. The reason why this indicator survived for so many years is because it continues to show consistent signals even in these current times. The Stochastic indicator is a momentum indicator that shows you how strong or weak the current trend

Forex MakeMyDay is a fully automated and customizable Expert Advisor. Automatic identify the trend and adjust buy/sell trades ratio to lock in profits. Recommendations EA Settings: Use default settings for best results
Symbol: EURUSD
Time Frame: H1
Brokers: ECN brokers, low spread/commission, 1:200-500+ leverage
Minimum Deposit required: $1, Risk computed on account free margin balance-equity Fully automated and customizablee EA on H1 Time frame. The EA self-adjust to the current
Multi MA Distance Signal Indicator is a no-nonsense, no delay, no repaint indicator ! Moving Average distance together with a trend filter is a 'simple', but very powerful and reliable signal. The current moving average distance for both a slow and a fast moving average is compared with the past MAD values. For two moving averages, all the distances between the Close price and the moving average (MAD) over a selected period of time are compared with the current MAD "Moving Average Distance". If
EUTUSDKILLER is a trend EA that works in all market conditions (i)It buys when the indicator confirms a trend (ii)Sell when the same indicator confirms a down trend. (iii)Easy visual and effective trend detection. (iV)It filters and improve your trading strategies. (v) It scans previous data and give real time output. (vi) It can be set to auto calculate lots size.
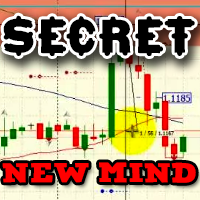
The strategy is based on the determination of the formed figures of technical analysis, candlestick patterns of higher time frames, the degree of volatility variability.
The totality of the data obtained allows the adviser to decide on the start of trading.
Dangerous trading methods are not used. Support: https://www.mql5.com/en/channels/TrendHunter
Only 1 order can be opened at a time. The averaging system is not used.
Each open transaction has a stop loss and take profit. Recommended

This EA is an extension for the free trade indicator Trend Mate . https://www.mql5.com/en/market/product/50082
The main idea is to support your decision to trade according to the current trend. It is possible to configure alert and push notification to receive when entering to first candle for bull / bear trend.
For this extension of the free indicator now it is possible to filter the current trend info with other timeframes. For example show trend for timeframe M5 considering also timefra
Grid EX is an Expert Advisor base on grid,It will also open two-way trading, which is suitable for volatile non-delivery currency pairs.
MT5 Version
Features: Easy to set up; Suitable for any timeframe; Use average price to calculate take profit and trail stop; Dynamic grid (the larger the level, the larger the grid); Balance management (maximum level and maximum lot can be set). The trading model of Grid EX: When the price rises, open an bid order of larger lots at higher price to pull the a

You do the trades, let DSProFx Order Close Manager do the rest! You can open the trades manually or by other EA, and DSProFx Order Close Manager will help you closing your opened orders automatically.
Abilities This EA give you some options to close your orders : by Hard SL & TP, Hidden SL & TP, Breakeven level, Trailing Stop, Profit Target ($), Moving Average Crossing, Time, Equity Growth and Trend Line.
Parameters on Dashboard Take Profit (Points) - Take Profit in Points. Stop Loss (Poin

The mechanism is exactly the same as the free version https://www.mql5.com/ru/market/product/50090 with the exception of a huge number of additional support settings that will help you curb the martingale system. Unlike the free version, this adviser will not let you merge the entire deposit at once, and indeed with the right settings it will not work out). You can start even with $ 100. There is a feature of testing Jast Martingale, in MT4 on data provided by the terminal, tick data is proce
Savez-vous pourquoi MetaTrader Market est le meilleur endroit pour vendre des stratégies de trading et des indicateurs techniques ? Pas besoin de publicité ou de protection logicielle, pas de problèmes de paiement. Tout est fourni dans le MetaTrader Market.
Vous manquez des opportunités de trading :
- Applications de trading gratuites
- Plus de 8 000 signaux à copier
- Actualités économiques pour explorer les marchés financiers
Inscription
Se connecter
Si vous n'avez pas de compte, veuillez vous inscrire
Autorisez l'utilisation de cookies pour vous connecter au site Web MQL5.com.
Veuillez activer les paramètres nécessaires dans votre navigateur, sinon vous ne pourrez pas vous connecter.