Regardez les tutoriels vidéo de Market sur YouTube
Comment acheter un robot de trading ou un indicateur
Exécutez votre EA sur
hébergement virtuel
hébergement virtuel
Test un indicateur/robot de trading avant d'acheter
Vous voulez gagner de l'argent sur Market ?
Comment présenter un produit pour qu'il se vende bien
Expert Advisors et indicateurs pour MetaTrader 4 - 74
This is a free plug-in for Control-adora Expert adviser. It's main function is to create a Buy Stop arrow on the chart or a Sell Stop arrow when the price crosses above or below a trend line, which will allow Control-adora expert open a new trade when the desired lines will be crossed by the price.
Settings Prefix: Write here the prefix used to identify which trend lines are subject to be watched, value "Trendline" is set by default. Always use On Close Only: When set to true (by default) the
FREE
Welcome. This indicator is for alarming the trader by sound when Symbol's price goes above or below certain level(s). It doesn't do any trading. Setting the levels is very handy, you just drag them with the mouse on the chart. You can customize the sounds the Indicator alarms you by (may be useful for office with a number of the terminals running). Also, this product includes an auxiliary Windows application that makes the usage even more handy. This product includes 4 parts: Sounder_TopBottomLe
FREE

Spread Data tool will display current spread and average spread. It will record spread for every hour (from 0 to 23) and can give better data about your broker spread. Run it for 2 days or more to get better spread data . Every spread smaller than MinSpread will be recorded as MinSpread Every spread larger than MaxSpread will be recorded as MaxSpread It help to decide what spread to be used when do backtest, EA spread settings, EA that trade in specific time interval, especially for scalping EA
FREE

MAS Indicator can be used in all currency pairs and at any timeframe, it is suitable for any trading speed. In addition, it's relatively easy to trade with the MAS Indicator. This indicator produces two signals: BUY Signal: arrow deep sky blue SELL Signal: arrow red
Indicator parameters MA Method – type of moving average MA Shift – shift moving average Fast - fast period moving average Slow – slow period moving average RSI – value rsi Confirm – value confirm Flat – value flat Colors - colors o
FREE
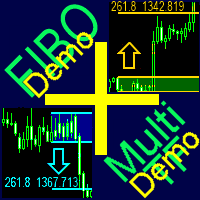
A ready-made multitimeframe trading system based on automatic plotting and tracking of Fibonacci levels for buying and selling any symbol. Demo version - calculation of the last 390 bars is not performed.
Advantages Determines the trend direction based on a complex of 14 indicators ( Cx ), extremums of ZigZag ( Z ), RSI ( R ), Impulse ( I ) Displaying the values of 14 indicators comprising the trend direction ( Cx ) Plotting horizontal levels, support and resistance lines, channels View the pl
FREE

Это бесплатная версия советника, в ней отсутствуют параметры, кроме MagicNumber и советник торгует минимальным риском 1% Купить полную версию советника https://www.mql5.com/ru/market/product/32669
Trend rollback ea FREE - уникальный, полностью автоматический эксперт, для валютной пары GBPUSD Тайм фрейм M15 . Советник использует два авторских индикатора, 1 индикатор определяет направления тренда, 2 рисует канал. Советник открывает сделки, когда цена выходит за уровни канала (торговля по тре
FREE
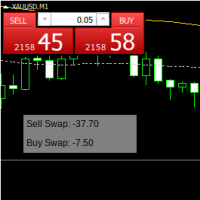
showSwap is a simple indicator. shows SWAP on the instrument chart for this instrument. You can specify the magic of the instrument, if 0, then that’s it. as well as the coordinates of the indicator panel on the chart. In forex trading, SWAPs can be either positive or negative depending on the interest rate differential between the two currencies involved in the trade. Traders may either receive or pay SWAPs depending on whether they are holding a position past a certain time (usually at the end
FREE
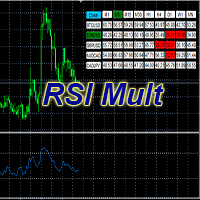
Standard Oscillator RSI (Relative Strength Index) with some additions.
Allows you to select up to 5 instruments.
Displaying indicator data from selected instruments for all time frames.
Fast switching to the selected instrument or time frame.
The RSI indicator shows good signals, but its readings still need to be filtered.
One such possible filter could be RSI from a higher period.
This version of the Oscillator is designed to make it easier to work with charts, namely, to reduce th
FREE

This indicator idea comes from Tushar Chande called Qstick.
Technical indicators quantify trend direction and strength in different ways.
One way is to use the difference between close and open for each bar and to sum it up over a period of time.
The formual is:
Qstick (period ) = Average ((close-open ), period )
In this indicator, we can choose how to calculate body by two famous chart types. The first and default indicator settings are based on Heiken Ashi chart, and the second i
FREE

Velvet RVI is intended for use with the Velvet advanced ordering layer. It is based on the algorithm for the Relative Vigor Index, provided by Investopedia here . All of the data it displays is accurate and verified against the internal API function iRVI, when it is detected by the ordering layer. In order to place orders with the Velvet RVI indicator, the ordering layer must be installed and running. Ordering from the Velvet RVI indicator requires that "Velvet Ordering Layer" ( found here ),
FREE

Советник работает на пересечении двух Moving averages рассчитанных по ценам Open и Close. Но несмотря на простоту показывает неплохие результаты. Параметры: Time frame — Период для расчёта Moving averages Period MA — Период усреднения Moving averages Method MA — Метод Moving averages Lot — Размер контракта Step averaging — Шаг усреднения позиции Take profit — в пунктах Magick number —
FREE
指标功能:完成十字光标跟随,多个窗口鼠标位置的同步显示。 功能 开启 :点击"H"标签,标签变成"S",开启十字光标,通过鼠标点击,完成第二个以上窗口的位置同步。 可以大周期同步小周期 (注意:在大周期同步小周期时,要注意小周期中的数据是否足够多) , 也可以小周期同步大周期。 功能关闭:点击 "S"标签,会变成"H"。或者通过键盘的"ESC"键,关闭。
指标可以多个窗口加载,也可以单窗口加载。
参数设置: LabWindow:标签显示的窗口 LabConer :标签显示的角落位置 LabX :标签位置横坐标 LabY :标签位置竖坐标 LabShowBackup :标签背景显示于背景 LabFontName :标签的字体名称 LabFontSize :标签的字体大小
FREE

The London Stock Exchange Session's Hours
This indicator facilitates observing the currency pair's quotations during subsequent parts of the stock exchange session live. Before the session starts, a rectangle is drawn on the chart but not filled in with color. It means the extent of the session duration. Before the first bar enters the rectangle of the session, a sound signal or pop-up window will notify us that the session will just start. When the price graph crosses the edge of the session
FREE

This script allows you to toggle the "Show Trade Levels" option, but for the current chart only. Normally, you can only change the setting using the Options -> Chart menu for ALL charts, but this script allows you to do it for a SINGLE chart. I'm using it when I take screenshots, because most of the time I'm not trying to show the trades, just some functionality of one of my other tools. Iif you need that functionality, then this script is very helpful!
If the script helps you, please let me
FREE

The indicator improves the idea implemented in the standard Bulls and Bears indicator. The indicator colors candles by analyzing the divergence of the maximum and minimum prices of the current bar with the average value of the maximum and minimum prices over a longer period of time. The indicator does not re-paint on fully formed bars. The indicator is easy to set and efficient on trendy market segments.
Adjustable parameters: i_Period - smoothing period for forming the channel; i_Method - smo
FREE

The purpose of this new version of the MT4 standard indicator provided in your platform is to display in a sub-window multiple timeframes of the same indicator. See the example shown in the picture below. But the display isn’t like a simple MTF indicator. This is the real display of the indicator on its timeframe. Here's the options available in the FFx indicator: Select the timeframes to be displayed (M1 to Monthly) Define the width (number of bars) for each timeframe box Alert pop up/sound/ema
FREE
This indicator displays the signals based on the values of the classic DeMarker indicator on the price chart. The DeMarker indicator can be used for determining the overbought or oversold areas on the chart. Reaching these levels means that the market can soon turn around, but it does not give signal, as in a strong trend the market can stay in the overbought or oversold state for quite a long time. As with most oscillators, the signals are generated when leaving these areas. This indicator all
FREE

Footmarks Pro Footmarks Pro is a MetaTrader 4 Essential Indicator that create round number or sweetspot on chart with "Button". Parameter Indicator Name - Footmarks Pro Pair Selection - 250 points / 500 points / 1000 points Sweetspot Setting Sweetspot Line Color Sweetspot Line Style Sweetspot Line Thickness Sweetspot Button Setting Button Axis-X Button Axis-Y Thanks...
FREE

Make trades on symbols which are corelated not making any sense. So what if we can check, which of symbols are not corelated to each other and are oposit in current trend. For this simple and quick analyze you can use this utility. Simply run and see list of symbol pairs which are oposit to each other. Results of analyse will be printed in Strategies log. Duplicity A -> B == B -> A is not displayed.
You can specify period for which will be calculated trend (Daily,Hourly,Mothly), choice d
FREE

Risk Optimizer is the absolute solution for applying risk management on your account. Bad risk management is the main reason that causes traders to lose money. Risk Optimizer calculates and suggests the correct lot size for each position according to your personal, customized risk profile. You can give directly your preferred risk as percentage (%) for each position or you can trust our algorithms to calculate and optimize according to your risk category selection. But it is not only that! Selec
FREE

ON Trade Pivots is A technical indicator that Draws all Pivot levels depending on time frame that defined in settings.
Notes It will be good tool for all traders who use pivot levels in their trades. Let me inform you that this indicator draw this level as buffers not as objects then you can connect it easily to EA. This indicator allow you to find pivots levels for any time frame not only daily you are free to choose time frame from settings.
Parameters Use_System_Visuals - Enable /Disable
FREE

Find pairs are good to trade. This demo version is unlimited and can be use with all functionalities, but displays only 3 results max. Up to 4 criteria. Candlestick patterns. Create your own screener with OR/AND conditions. Ex: (condition 1 OR condition 2) AND (condition 3 OR condition 4). From the result, simple click on the pair label displays the symbol in all charts you have. Load your own pair list. By default, the program works with: AUDCAD, AUDCHF, AUDJPY, AUDUSD, CADJPY, CADCHF, CHFJPY,
FREE

Very usefull expert advisor for ichimoku kinko hyo indicator. this expert advisor will notify you whenever there is a cross over/below the clouds or tenken sen /kijun crossing. All Ichimoku traders know the importance and valuable signals when crosses done below or above the clouds or tenkan and kijun crosses. Now you will be alerted quickly to make benefits from the markets This will help you to be alerted for possible trade action. it will simplify your chart observation and be notified wtith
FREE

Power Trend Free - the indicator shows the trend strength in the selected period.
Input Parameters The indicator has three input parameters: Period - a positive number greater than one, it shows the number of candlesticks used for calculations. If you enter one or zero, there will be no error, but the indicator will not be drawn. Applied Price - the standard "Apply to:" set meaning data used for the indicator calculation: Close - Close prices; Open - Open prices; High - High prices; Low - Low
FREE

The EA places orders at the specified terminal time with an accuracy of 1 minute.
Types of orders are selected, the default is pending.
Set stop loss, take profit, the time after which pending orders are deleted, if until that moment they were not opened(time can not be less than 11 minutes from the time of opening, the EA will not work). Check for magic number is at the beginning. If there are orders with the same magic and on the same instrument (the same symbols), the orders will not be
FREE

Based on a combination of indicators, E13 Acid Fulx is an excellent indicator for knowing when to buy or sell on any asset and temporaryity. The indicator myself I have used it as a tool for my analysis when trading Forex. It is a useful and easy-to-understand trend indicator. If you combine it with your own analyses you will surely get a good result in your operation.
FREE

RSI Currency Strength Meter uses RSI (Relative Strength Index) to monitor how strong a currency is, or in other words, if it's being bought or sold by the majority compared to the other currencies. It displays the strength-lines of the currencies of the pair (base and counter currency of the chart) with changeable solid lines. Also, you can add up to ONE additional currency (only 1 in the DEMO version, in REAL up to 5) to the "comparison pool" that already has the base and the profit (counter) c
FREE
This indicator is one of the variants of the MACD technical indicator. The indicator is the difference between two moving averages with different smoothing periods. Each moving average is additionally smoothed by an adaptive digital filter. In a simplified sense, an adaptive digital filter is a moving average with effective smoothing. Using a digital filter allows you to smooth out sharp fluctuations with minimal signal delay.
Using the indicator: It should be taken into account that the value
FREE

CloseProfit is a utility created to automate the process of setting a stop-loss and closing orders when a certain percentage of profit is reached.
The utility also has two Buy and Sell buttons on the chart for opening orders.
The utility can be used to close orders opened by other advisors, with a stop-loss or a percentage of the increase in the deposit. To do this, you need to set in the settings a magic number that matches the one that is installed in the advisor when opening a transactio
FREE

Indicator with the function of catching trees should pinbar of all time frames 1. PinBar identification indicator for multi timeframe. 2. Function backtest of PinBar candlestick patterns 3. Announcements on MT4 / MT5 and on mobile phones Please watch my movie on youtube for instructions. S ubscribe my channel for free indicator. https://youtu.be/gIONGgBMqW8
#KIDsEA #indicator #Pinbar #priceaction #mt4 #mt5
FREE
Introducing Austin RSI—an innovative indicator designed to elevate your forex trading strategy by applying moving averages to the MetaTrader 4 indicator, RSI.
The Relative Strength Index (RSI) is a popular momentum oscillator that measures the speed and change of price movements. It oscillates between 0 and 100 and is used to identify overbought and oversold conditions in the market. Traders often use RSI to gauge the strength of price movements and anticipate potential trend reversals.
Aus
FREE

O indicador é uma ferramenta desenvolvida para o MetaTrader, projetada para auxiliar na análise detalhada do comportamento do preço em relação a uma média móvel específica. Ao ser anexado ao timeframe diário, o ele realiza cálculos e monitora, em timeframes menores, quantas vezes o preço toca determinados níveis de afastamento durante o dias além de calcular a média dos toques.
MT5: https://www.mql5.com/pt/market/product/111710
FREE
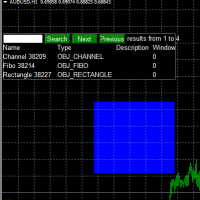
Use this software to browse through all objects within the chart and look at them comfortably. Also, you can look at the list of global variables and search and delete them . The same you can do with charts and indicators. You can search in objects names and object descriptions to find the object you are interested in. This is definitely an improvement to what is available in Mt4. You type what you are interested in , then press Search button. You can move to next and previous search results. No
FREE

The VMA is an exponential moving average that adjusts its smoothing constant on the basis of market volatility. Its sensitivity grows as long as the volatility of the data increases. Based on the Chande's Momentum Oscillator, the VMA can automatically adjust its smoothing period as market conditions change, helping you to detect trend reversals and retracements much quicker and more reliable when compared to traditional moving averages.
FREE
This indicator is a moving average built using the triple exponential smoothing method (T3). The indicator is part of a series of indicators - T3 Line AM, T3 Momentum AM, T3 Candles AM, T3 Signal AM .
The indicator has minimal lag and allows you to effectively follow the trend direction. The indicator is not redrawn on fully formed bars. The indicator is supplemented with signals and notifications to the terminal and e-mail.
The application of the indicator is identical to the application o
FREE

EasyTrend AM is an indicator that allows you to open a position at the very beginning of a significant price movement. The second most important quality of the indicator is the ability to follow the trend as long as possible in order to obtain all potential profits while minimizing potential losses. This indicator does not repaint or not recalculate. A version of this indicator with advanced settings and signal notifications is EasyTrend 3 AM .
Signal of the indicator: red arrow appearing abov
FREE

The indicator calculates running total of linear weighted returns. It transforms rates into integrated and difference-stationary time series with distinctive buy and sell zones. Buy zones are shown in blue, sell zones in red. Parameters: period - number of bars to use for linear weighted calculation; default value - 96; smoothing - period for EMA; default value - 5; mode - an integer value for choosing calculation mode: 0 - long term trading; 1 - medium term trading; 2 - short term trading; defa
FREE

Ever wondered what is XAU/XAG rate or how Chinese Yuan is traded against Russian Ruble? This indicator gives the answers. It shows a cross rate between current chart symbol and other symbol specified in parameters. Both symbols must have a common currency. For example, in cases of XAUUSD and XAGUSD, or USDRUB and USDCHN, USD is the common currency. The indicator tries to determine the common part from symbols automatically. If it fails, the DefaultBase parameter is used. It is required for non-F
FREE

High, Low, Open, Close — isn't this too much? Sometimes you need a unique history of prices. But if choose one thing, you lose the rest. Smoothing also leads to data loss. Often you lose one of the most important market details: information about extremes. It is due to the preservation of information about the highs and lows, the correct "smoothing" for the history of price is a zigzag. But zigzags also have drawbacks — they do not provide intermediate values. The Price Line indicator solves thi
FREE

Volume Levels is a very important indicator for exchange trading. Most of the trades were performed on those levels. This indicator displays the price level that had the most trade volumes over a certain period of time. Often, the price bounces from those levels in the future, and it can be successfully used in trading. This is a demo version that works only on the USD/JPY currency pair. To work on all currency pairs, install the full version: https://www.mql5.com/en/market/product/15888
Param
FREE

Индикатор выводит первые производные двух MACD. По умолчанию, желтая MACD является более быстрой, чем синяя MACD. В настройках можно задать подходящие вам параметры для каждой из MACD. Одновременное изменение знака производных может являться дополнительным сигналом разворота. Входные параметры
Yellow MACD fast EMA period Yellow MACD slow EMA period Blue MACD fast EMA period Blue MACD slow EMA period
FREE

TraderTool is a tool/panel that will help any trader to perform trades quickly and easily. The product has been developed with user friendliness and ease of use in mind. It has the ability to manage multiple types of orders, either placed by an Expert Advisor, or manually. It also allows you to place orders in a single click. You can add stop loss and take profit, initiate a trailing stop or start break even operation, and all these with the simple panel. With the advanced panel (you can call it
FREE
Standard deviation with levels is a modification of the Standard deviation indicator, supplemented by the levels of expected Highs and Lows. The levels are plotted using the Support and resistance bands indicator, which determines the High and Low levels nearest to the current indicator value based on the historical values of the extremes.
Parameters standard deviation period - period of the standard deviation indicator. extremum detector period - period of extremum detection. This parameter
FREE

The indicator uses the Chester W. Keltner's channel calculation method, modified by the well-known trader Linda Raschke. Due to the modification, the calculated channel contains a much more complete overview of the price movements, which allows increasing the probability of an accurate prediction of the upcoming price movement. Unlike the classic Keltner method, the base line of the channel is plotted based on the Exponential Moving Average, and the Average True Range is used to calculate the up
FREE

Hi New Update Available At Non Free Version. Its more profitable and saver than older one. Just Grab it fast. Every month price goes up
This Free version Only use Lot 0.01 cannot modify the Lot Size. If You wanna unlock the lot size you can buy Pro Version at https://www.mql5.com/en/market/product/49608 See EA Performance on Backtesting with low balance = https://youtu.be/8Wok_CTzcsQ
Mata Elang EA is a trading robot for the trading on forex and trades Scalping Strategy. This is a Tre
FREE

Description VisualHistory plots positions (Buy and sell orders only) from history of account on a chart. It draws the standard arrows for entry/exit and connects them by the dashed line. Also, VisualHistory displays information on the top left corner of a chart concerning displayed positions: positions count, net profit. Download it to the <MQL4/Experts> directory of your MetaTrader.
Options
Start date for history orders - start date of displayed trade history End date for history orders - e
FREE

Cet indicateur vous permet de savoir combien le prix peut passer sur la barre actuelle. Il recherche la moyenne de l'ATR pour les 5 barres précédentes et dessine 2 limites de prix. Vous pouvez l'utiliser sur n'importe quelle période de n'importe quel outil.
Sur la base de cet indicateur, vous pouvez exposer les niveaux Stop Loss et profit, et l'utiliser dans d'autres bonnes stratégies.
N'oubliez pas d'utiliser la gestion des risques pendant le trading!
FREE

The utility is designed to close and delete positions when the specified loss/profit values are reached in the currency/percentage of the Deposit. The chart displays a panel with information: profit/loss on the account, the number of open positions, and total positions in lots. Parameters: SHOW THE DASHBOARD - TRUE - Yes, FALSE - No. CURRENCY PAIRS - TRUE - All, FALSE-Current. STOP PROFIT IN $ OF THE DEPOSIT - Profit value in the Deposit currency. STOP LOSS IN $ OF THE DEPOSIT - Loss value in
FREE

This Expert Advisor closes all open positions and pending orders. It is possible to close only buy or sale orders, market or pending orders, positions with profit or loss.
You can to get source code from here .
Parameters CloseAllBuy - close buy positions. CloseAllSell - close sell positions. CloseMarketOrders - close market orders. DeletePendingOrders - delete pending orders. CloseOnlyProfit - close only profitable orders. CloseOnlyLoss - close only loss-making orders. ClearChart - clear th
FREE
This expert is designed to work in pairs with the same indicator. https://www.mql5.com/ru/market/product/34836
The expert does not display anything on the screen and does not trade.
It only performs calculations for the indicator, this is done to save your computer resources.
Since the expert works with symbols from Market Watch, there is no way to test it in the tester.
Instructions for use:
0) Select the required symbols in the Market Watch, which will be displayed in the indicator. (Not
FREE

CoralDash is a simple symbol shortcut dashboard. The Symbol List has many presets to choose from: Market Watch Open Orders Current Chart Majors A custom list Clicking the symbol has two available actions Set the current chart symbol Filter the list of symbols shown in the dashboard based on one currency (e.g., see all EUR pairs) Click the "PAIR" cell in the header to toggle between the two available actions Click the symbol cell to apply the action For the filter, click the left side to selec
FREE
The presented indicator gives signals about the price leaving the Donchian channel, as well as about the price returning to the channel. Donchian channel - a technical indicator developed by Richard Donchian, is a variation of the trading interval breakout rule. It is built by taking the highest (high from High) and lowest (low from Low) prices for the previous n periods, followed by marking the area between them on the chart. Donchian recommended using his indicator for daily timeframes with an
FREE

Recovery Zone Assistance, as its name says ... It is an assistant, an expert advisor that monitors all the orders for the asset in which it has been placed, no matter if that order was by some other expert advisor or by the trader placed on the Manually, he will start his work after each order that is negative.
This Expert Advisor is based on this sistem on video "Recovery Zone" on https://www.youtube.com/watch?v=DJz4E7VyeSw. See more products on: https://www.mql5.com/en/users/joaquinmetayer
FREE

As a Thanks to the Trading Community ZenKen Trading will be releasing all Classic Indicators as EAs.
The First to be created is In-Depth RSI Auto Trader.
The user can choose to trade classic over bought and over sold levels or they can change to trading the 50 line cross.
The user can also decide if they want the over bought and oversold levels to close trades for them.
User has several safety features to select from to help protect from high spreads, bad trade hours, and losses.
I wil
FREE

基于股票软件黄金线指标改编。可根据需要调整参数值。具体使用规则请参考相关股票软件说明。 ////////////////////////////////////////////////////////////////////////////////////////// //股票公式源码如下:
VAR1:=(HIGH+LOW+OPEN+CLOSE)/4;
黄金线:EMA(3*VAR1-2*SMA(VAR1,2,1),13); //////////////////////////////////////////////////////////////////////////////////////////
声明 1 指标计算均基于价格变化而来, 不保证使用此指标的盈利性,作者不对使用此指标的任何损益负责。 2 本指标免费使用。
FREE
This indicator show all history orders on chart with the same symbol. It help you see time and price that orders opened and closed. 1) Show all history 2) Open chart with symbol that you need to watch 3) Attach the indicator 4) Press key "h" -Downwards line Blue: sell with profit -Downwards line Red: buy with loss -Upwards line Blue: buy with profit -Upwards line Red: sell with loss.
FREE
Download your broker's detailed spread data into a simple CSV file When choosing a broker, it is important to choose one that offers the right spreads for you. Ideally, we choose a broker with the lowest spreads. However, a broker will only advertise either the lowest spread they offer, or the average spread. The reality of spread is that it can vary massively and depends on the currency pair, the time of day or the volatility of the market at a given point in time. Some EAs are more sensitive
FREE
The Chart Navigator is a powerful and user-friendly indicator designed to enhance your chart navigation experience in the MetaTrader platform. With its advanced features and intuitive interface, it enables traders to effortlessly explore multiple timeframes, switch between symbols, and efficiently analyze price movements. Key Features: Timeframe Navigation: Seamlessly switch between different timeframes with just a single click. The Chart Navigator provides a graphical object that allows you to
FREE
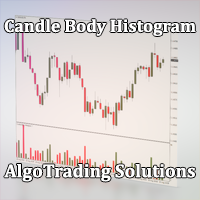
Индикатор Candle Body Histogram отображается в отдельном окне и показывает размер тела каждой свечи в виде гистограммы. В зависимости от того растёт свеча на графике или снижается, гистограмма меняет свой цвет. Свечи "доджи", у которых совпадают цены открытия и закрытия, так же отображаются на гистограмме отдельным цветом. Поскольку индикатор строится от нулевого значения, он позволяет визуально сравнить тела свечей относительно друг друга. На гистограмме можно разместить уровни, чтобы отслежив
FREE

The new version of the trading panel, which now has the ability to separately close Buy and Sell orders, display targets for all orders on the chart, as well as the ability to use the panel to trade with brokers working on the FIFO rule. Also, the new version adds option buttons for separate management of open orders.
It has a convenient visualized interface and intuitive control without a lot of additional tabs to which traders have to be distracted and switch their attention. Thanks to this

I make this indicator to help you for setting effective stoploss and getting more signals from following trends. This indicator helps to tell the trends and sideway, when 2 lines stand above of blue cloud, it means uptrend. When 2 lines stand above red cloud, it means down trend, the other else, it means sideway market. For taking order, you have to wait the arrows. You also need to see the cloud position, if the cloud's res, you have to wait the yellow arrow for selling order. If the cloud's bl
FREE

Introducing the “Symbol Cost Info MT4” indicator – your ultimate tool for staying ahead in the forex market! This innovative indicator is designed to empower traders with real-time cost information, directly on their charts. Here’s why every trader needs the “Symbol Cost Info MT4” in their arsenal: Real-Time Spread Monitoring : Keep a close eye on the spread for any currency pair, ensuring you enter the market at the most cost-effective times. Pip Value at Your Fingertips : Instantly know t
FREE

Product Overview
This tool is discretionary trading aid that executes a one-time entry when the conditions are set.
Action after the newest bar is fixed (opening action)
For example, there is no need to worry about being pruned by the shadow of the same price before that if you set it in the condition of when the closing price was broken.
It is not possible to set complicated conditions, and it is not designed for continuous automatic trading, but since it works after the time period
FREE

SYMBOL POWER based on inputted 5 time frames and Compared to 20 Other Symbols !! Great Indicator YOU DON'T HAVE TO SHIFT ON ALL TIME FRAMES FOR EACH CURRENCY PAIR TO CONCLUDE ITS TREND AND ITS POWER YOU HAVE IT ALL IN ONE TABLE , 20 CURRENCY PAIR WITH 5 TIME FRAMES ALSO , COMPARE BETWEEN CURRENCIES STRENGTH AND ALERTS THE STRONGER /WEAKER PAIR BASED ON 5 TIMEFRAMES CALCULATIONS ALEERTS enable /disable using 5 time frames M5 M30 H1 H4 and D1 ( latest version You SELECT you own 5 timeframes fr
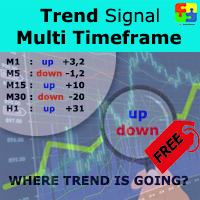
Free version. Only works on EURUSD. Do you want to always know in a quick glance where price is going? Are you tired of looking back and forth between different timeframes to understand that? This indicator might just be what you were looking for. Trend Signal Multitimeframe shows you if the current price is higher or lower than N. candles ago, on the various timeframes. It also displays how many pips higher or lower current price is compared to N. candles ago. Number N. is customizable The dat
FREE

Ce petit script va égayer votre vie. Vous trouverez ci-dessous son code, vous pouvez l'insérer dans OnInit de n'importe quel robot. Ou changez les couleurs et l'échelle selon vos goûts #property copyright "V.Temchenko Skype:vasily.temchenko" #property link " Mailto:tvp.prog.96 @gmail.com" #property version "1.00" #property strict #property description "Have questions? Skype: vasily.temchenko Viber: +38098 800-6-800" ; #property description "If the voice - only Russian, Ukrainian
FREE

FREE

The indicator detects market efficiencies and inefficiencies by studying price movements and marks candles where the best efficiencies occurred. The most 'efficient' candles are indicated with a vertical bar histogram. Taller bars represent these candles. The highs and lows of these candles are supply and demand areas, important levels that will be retested in the future. It can be used on all time frames with the same settings.
FREE

This indicator shows in a subwindow the trend in M1, M5, H1, D1 timeframes based on MA, MACD, Stochastic This way you could see in once in different timeframes what happening. This is my first free indicator. Please follow I will put here some more. Thank you for you attention. . . . . .
lfknglkslksnlgslgnsflgjrpoesv ,msv lkrjpfjésmdg sd.npo4wsmdglknsp4jwpkeégmfs.lkmp Thank you
FREE

HJZHI88888888888888888888888888888888888888888888888888888888888888888888888888888888888888888888888888888888888888888888888888888888888888888888888888888888888888888888888888888888888888888888888888888888888888888888888888888888888888888888888888888888888888888888888888888888888888888888888888888888888888888888888888888888888888888888888888888888888888888888888888888888888
FREE
Le MetaTrader Market est le meilleur endroit pour vendre des robots de trading et des indicateurs techniques.
Il vous suffit de développer une application pour la plateforme MetaTrader avec un design attrayant et une bonne description. Nous vous expliquerons comment publier votre produit sur Market pour le proposer à des millions d'utilisateurs de MetaTrader.
Vous manquez des opportunités de trading :
- Applications de trading gratuites
- Plus de 8 000 signaux à copier
- Actualités économiques pour explorer les marchés financiers
Inscription
Se connecter
Si vous n'avez pas de compte, veuillez vous inscrire
Autorisez l'utilisation de cookies pour vous connecter au site Web MQL5.com.
Veuillez activer les paramètres nécessaires dans votre navigateur, sinon vous ne pourrez pas vous connecter.