Regardez les tutoriels vidéo de Market sur YouTube
Comment acheter un robot de trading ou un indicateur
Exécutez votre EA sur
hébergement virtuel
hébergement virtuel
Test un indicateur/robot de trading avant d'acheter
Vous voulez gagner de l'argent sur Market ?
Comment présenter un produit pour qu'il se vende bien
Expert Advisors et indicateurs pour MetaTrader 4 - 265
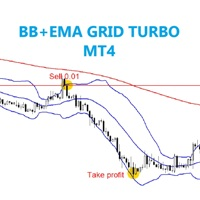
The EA trades on candles breakout from above or below BB, then be checked trend by MA to confirm order position. SETTING Symbole - Set symbol to trade. BB_period - Set BB period. BB_deviation - Set BB deviation. MA_period - Set MA period. Lots - start lot. Multiple_lots - Multiply lot for next order. Max_lots - maximum lot. Grid_boost - Frequency of opening position (Less = more order). Grid_minimum_pips - Check distance grid from last order. TP_pips - take profit, in pips. SL_money - Stop l

Are you in search of a reliable tool to enhance your trading experience on MetaTrader 4? Look no further! "Great Safe Signal" is here to elevate your trading strategy and provide you with invaluable insights for making informed decisions. Key Features: Precision Analysis: "Great Safe Signal" employs advanced algorithms to analyze market trends and price movements with pinpoint accuracy. This ensures that you have the most precise information at your fingertips. User-Friendly Interface: We unders

Modify TP SL Multi-Order Selected chart. Please leave a review about this product to help other users benefit from it. Looking for an easy-to-use multiple trading helper?
This is the right choice!
Why?
+ User-friendly utility
+ Help adjusting Stop Loss & Take Profit for all your running orders automatically
+ Compatible with orders Sell , Buy , Sell Limit , Buy Limit , Sell Stop , Buy Stop
+ Easily edit all orders with appropriate new P&L values
+ The indicator works only on the select

STZ Forex EA IV
Forex Robot
Is an fully automated Forex Robot for MT4 Terminal Trading.
The default settings are already profitable. But you can test and adjust the files to your needs.
There are more then 8 Indicators built in to filter as much as possible,
You can also join the Telegram Channel here
https://t.me/+Ft3Q8y4akvxjN2Jk
100 % automated different settings available simple TP and SL Trailing Stop Martingale For ALL Pairs For

Trailing Stop_Steps EA is an expert advisor that can manage your order's stop-loss by moving at fixed steps. In particular, this expert advisor can use two parameters to increment the stop-loss according to your preferences. In many cases, you might want to increment the stop-loss by a specific value when the price is at specific distance from the current stop. This trailing stop-loss EA allow you to do exactly this: to trigger a stop-loss increment when the price reaches a specific threshold.

Space Trader x5
Forex Robot
Is an fully automated Forex Robot for MT4 Terminal Trading. The default settings are already profitable. But you can test and adjust the files to your needs.
There are more then 25 Indicators built in to filter as much as possible,
You can also join the Telegram Channel here https://t.me/ +rbMoGQwS0WdjNGU0 https://t.me/+Ft3Q8y4akvxjN2Jk
100 % automated different settings available simple TP and SL Trailing Stop Martingale For A
I could write a fantastic description with lots of quantitative testing parameters but we have a saying that "taste of a pudding is in the eating " so I will simple put a CHALLENGE :Test this EA on any of the major and minor pairs (AUD,USD,EUR,CHF,NZD )and I guarantee you 50% discount if you can prove in a test on any of the major pairs above that you have incurred more than 3 error runs. *NOW HAPPY TESTING* Then you get to write the description unhindered!!!!!!!!!!!!!!!!!!!!!!!!!!!!!!!

To get access to MT5 version please click here . This is the exact conversion from TradingView: QQE MT4 Glaz-modified by JustUncleL This is a light-load processing and non-repaint indicator. All input options are available. This is not a multi time frame indicator. Buffers are available for processing in EAs. You can message in private chat for further changes you need.
RSI Intelligent is a fully automated scalping robot that uses a very efficient Relative Strength Index (RSI) breakout strategy, Probabilistic analysis with (RSI). Most effective in the price Cumulative probability of a normal distribution that occupy the bulk of the market time. Transactions happen almost every day like Scalping follow trend. A Forex robot using the Relative Strength Index (RSI) indicator combined with an artificial neural network would be an advanced automated trading system th

The EA of Bollinger Bands are a popular technical analysis tool used by traders and investors to analyze price volatility and potential price reversal points in financial markets, such as stocks, forex, or cryptocurrencies. They consist of three lines: The middle band: This is typically a simple moving average (SMA) of the price over a specific period. The most common period used is 20. The upper band: This is the sum of the middle band and twice the standard deviation of the price over the same

Fully automated, which does not use grid strategies, martingale, averaging positions, waiting out a loss, etc.
The idea is not complicated, when flat, 2 limit orders are set when using USE_LIMIT_ORDERS = true, otherwise it trades
by market. When an order is triggered, the position is closed by TAKE_PROFIT, SIGNAL_TRAILING_TAKE_PROFIT in an unsuccessful situation
by STOP_LOSS_VIRTUAL.
Or the orders are deleted.
After closing a position, the expert looks at how the position closed, with a pr

Dynamic Momentum mt4 - works on the Bollinger Band indicator and RSI Indicator, which is a leading indicator. To enter a position, the advisor uses the oversold or overbought conditions of this indicator, catching the profit of traders. First 10 purchases 25% off full price $65. For Expert Advisor need hedge type account.
Settings and manual here Timeframe: H1 Platform: MetaTrader 4 Minimum deposit: 500 Leverage: 1:200 up to 1:1000 Type of account: Hedging, Zero, Micro, Standard, Premium or

This offer is limited to a temporary period 10 years watching the strategy. and 5 years trying to make it a reality, I mean programmatically. And now I put it as a robot. Signal tracking expert 7 days Every 10,000, the maximum limit is 3 lots Every 1,000 has a maximum limit of 0.30 lots , 250 profit 30m ,1H ,4H Settings lot = 0.15 / 0.30 / 0.90 /1.80 /2.70 /3.6 = It's up to you, dear Take Profit= 25 / 20 /18 /16 /14 =It's up to you, dear Stop Loss=0 Target Equity up = ( 14000 )The amount to whic

Three white Candlestick USES THE TREND WAVE INDICATOR AND IT CAN IDENTIFY THE BEGINNING AND THE END OF A NEW WAVE TREND MOVEMENT.
AS AN OSCILLATOR, THE INDICATOR IDENTIFIES THE OVERBOUGHT AND OVERSOLD ZONES.
IT WORKS GREAT TO CATCH THE SHORT TERM PRICE REVERSALS AND USES A MARTINGALE STRATEGY TO CLOSE ALL TRADES IN PROFIT.
USE DEFAULT SETTINGS ON H1 OR HIGHER TIME FRAME ON ANY PAIR FOR MORE ACCURATE TRADES
WHY THIS EA :
Smart entries calculated by 4 great strategies The EA can be run on ev
" TESTED SUCCES: RoboForex-ECN-1, RoboForex-ECN2, RoboForex-ECN-3, ICMarkets-Live01, 02, 03, dst"
Trade SR is an EA designed for trading with lots that automatically increase when the balance increases, so that the profits obtained also increase. use the right stop loss and appropriate take profit, so that you have a safe limit so that trading stops when the balance is in loss. Just make a minimum deposit for trading, you will slowly get regular profits and can withdraw them
"IMPORTANT" Speci

Super Trend Channels MT4 Indicator Looking for a versatile and powerful channel indicator for your MetaTrader 4 trading platform? Look no further than the "Super Trend Channels" indicator! This advanced tool is designed to help traders identify trend channels accurately, enabling you to make informed trading decisions with confidence. Key Features: Multi-Channel Support: The "Super Trend Channels" indicator supports multiple channels simultaneously. You can visualize various channel types, inclu

Enhance your trading strategies with the " MA Trend Filter " indicator for MetaTrader 4. This powerful tool is designed to help you make more informed trading decisions by effectively filtering market trends using Moving Averages (MA). Key Features: Efficient Trend Filtering: The "MA Trend Filter" uses Moving Averages to filter out noise and highlight significant market trends. It simplifies complex price data, making it easier to identify potential entry and exit points. Customizable Settings:

Introducing Bluey, the next evolution in automated trading technology. Bluey isn't just another run-of-the-mill trading robot; it's a sophisticated system engineered to redefine your trading experience. Powered by cutting-edge algorithms and state-of-the-art features, Bluey seamlessly blends technical analysis, artificial intelligence, and machine learning to provide traders with accurate and profitable trading signals.
Bluey's advanced technology excels at identifying lucrative trading opport

Tired of facing challenges and hitting those frustrating max loss limits with prop trading firms? Say goodbye to those worries and welcome success with open arms, thanks to the PROP FIRM PAC-MAN. This exceptional trading bot is your ultimate solution, designed to excel in both live and prop firm trading environments, including FTMO and more. Robot Performance: A Game-Changer PROP FIRM PAC-MAN stands out from the crowd, ranking among the top expert advisors for its remarkable approach to handling

This is a simple utility which will put automatic Stop Loss and Take Profit on every new trade based on ATR values. It also has Stop Loss Trailing and Break Even function. Whenever you open a trade, it will put ATR times Stop Loss and Take Profit automatically. Stop loss and take profit are two important tools used by traders to manage risk and set profit targets in financial markets. The Average True Range (ATR) indicator can be a valuable tool in helping traders determine appropriate levels fo

Professional expert Effect Trader analyzes the market using a special algorithm. The basic principle is that the bot takes the indicated prices for a certain period of time and calculates the strength and amplitude of the price by checking it with its own indication system based on actual data. The moment is fixed when the trend loses strength and reverses, and then the previous series closes and a new one is prepared. The bot also analyzes its own overbought/oversold signals in its algorithms.
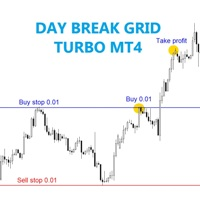
The EA trades on pending order price which breakout out of the day s. Best time frame 1 hour, Any pair any broker no limited, recommend minimum deposit 500$
SETTING Bar_history - Set candle history passed. Lots - start lot. Multiple_lots - Multiply lot for next order. Max_lots - maximum lot. Grid_boost - Frequency of opening position (Less more order). Grid_minimum_pips - Check distance grid from last order. TP_pips - take profit, in pips. SL_money - Stop loss in money. Number order for DD

" TESTED SUCCES: RoboForex-ECN-1, RoboForex-ECN2, RoboForex-ECN-3, ICMarkets-Live01, 02, 03, dst"
Trading 30 utilizes a combination of several trading techniques to engage in market transactions. You only need to use a small balance to generate substantial profits because Trading 30 incorporates automatic increases in the trading lot size in line with the increase in the available balance. Consequently, the amount of profit also increases in proportion to the lot size being traded. It employs

Emilian: L'Expert Advisor pour MetaTrader 4 Aperçu Rencontrez Emilian, l'Expert Advisor qui utilise des Moyennes Mobiles Exponentielles (MME) et l'Indice de Force Relative (RSI 21) pour ouvrir et fermer des trades.
Offrant des stratégies de gestion des risques personnalisables, Emilian utilise également la True Range Moyenne (ATR 12) ou des valeurs spécifiques en pips pour définir les niveaux de Take Profit et de Stop Loss.
Caractéristiques Clés Stratégie de Croisement de MME: Utilise des MME

Bullish&Bearish Candlestick USES THE TREND WAVE INDICATOR AND IT CAN IDENTIFY THE BEGINNING AND THE END OF A NEW WAVE TREND MOVEMENT.
AS AN OSCILLATOR, THE INDICATOR IDENTIFIES THE OVERBOUGHT AND OVERSOLD ZONES.
IT WORKS GREAT TO CATCH THE SHORT TERM PRICE REVERSALS AND USES A MARTINGALE STRATEGY TO CLOSE ALL TRADES IN PROFIT.
USE DEFAULT SETTINGS ON H1 OR HIGHER TIME FRAME ON ANY PAIR FOR MORE ACCURATE TRADES
WHY THIS EA :
Smart entries calculated by 4 great strategies The EA can be run o
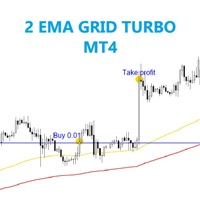
The EA trades on price which checked by slow EMA and traded by fast EMA meanwhile double check with range of distance between 2EMA and candle body size in pips . Best time frame 30 mins, Any pair any broker no limited, recommend minimum deposit 500$
SETTING Symbole - Set symbol to trade. EMA_fast - Set Fast EMA period. EMA_slow - Set Slow EMA period. EMA_range_pips - Set least range between fast and slow EMA. Candle_size_pips - Set Candle size before confirm trade. Lots - start lot. Multiple_
Indicator that synchronizes the charts, that is, when the asset is replaced in one of the charts, all those with the synchronized indicator are changed, with the same timeframe (Same_Timeframe = true) or with different timeframes (Same_Timeframe = false). The graphics to be synchronized are identified by color (Label). To synchronize indicators, the indicator must be inserted in all charts to be synchronized, using the same color (Label). A box with the chosen color (Label) and identification A

"RSI" usually refers to the Relative Strength Index, a technical indicator used in financial markets to analyze the strength or weakness of an asset's price. "Pending Grid" may suggest a specific trading strategy that combines pending orders with grid trading techniques. RSI EA : RSI (Relative Strength Index) is a technical indicator used in trading to assess whether an asset is overbought or oversold. It measures the speed and change of price movements. RSI values range from 0 to 100. Typically
This EA has been developed, tested and traded live on USDJPY H1 TF. Everything is ready for immediate use on real account. Very SIMPLE LONG/SHORT STRATEGY with only FEW PARAMETERS. Strategy is based on the breakout of the PIVOTS on the daily chart. It enters if volatility raise after some time of consolidation . It uses STOP pending orders with ATR STOP LOSS. To catch more profits there is a TRAILING PROFIT function in the strategy. EA has been backtested on more than 20-year lon
Trader Assistant MT4 aide chaque trader à gérer le risque par transaction en fonction de son solde et dispose de quelques outils pratiques. Attention. L'application ne fonctionne pas dans le testeur de stratégie. Comment télécharger la démo. Assistante commerciale : Il utilise un panneau fluent spécial - qui n'est pas dans la plate-forme meta trader. Vous pouvez voir le montant des profits et pertes avant de mettre en place une transaction. Il dispose également de quelques outils pratiques, q

Le logiciel d’interface Scalper Terminal est un indicateur, il ne s’engage pas dans des transactions d’achat-vente automatiques. Cet indicateur montre la zone commerciale actuelle dans laquelle les transactions peuvent être effectuées lorsqu'une opportunité commerciale de scalping se présente. Lorsqu'il y a un signal de scalping, sur le côté droit de la paire de trading concernée, le voyant Turquoise s'allume et la direction exacte du trading est écrite au-dessus. Après cela, cliquez sur le bou
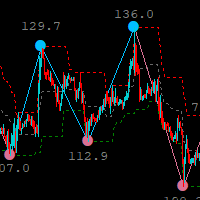
basé sur l'indicateur zigzag, l'indicateur de canal haut bas zigzag est un outil pour alerter le trader d'un changement de tendance, il est d'une grande utilité
comme il donnera une alerte précoce d'un changement dans la tendance actuelle, l'indicateur dispose d'une option multi-périodes pour échanger des délais plus élevés ou plus bas.
canal sur la période actuelle, cet indicateur est un ajout à votre système/stratégie et peut être utilisé de manière autonome pour trader, mais nous vous recomma

VETAL HOOTEA USES THE TREND WAVE INDICATOR AND IT CAN IDENTIFY THE BEGINNING AND THE END OF A NEW WAVE TREND MOVEMENT. AS AN OSCILLATOR, THE INDICATOR IDENTIFIES THE OVERBOUGHT AND OVERSOLD ZONES. IT WORKS GREAT TO CATCH THE SHORT TERM PRICE REVERSALS AND USES A MARTINGALE STRATEGY TO CLOSE ALL TRADES IN PROFIT. USE DEFAULT SETTINGS ON H1 OR HIGHER TIME FRAME ON ANY PAIR FOR MORE ACCURATE TRADES
WHY THIS EA : Smart entries calculated by 4 great strategies The EA can be run on even a $20000 acco

The EA (Expert Advisor) is built on the Parabolic logic combined with multi-time frame analysis. Utilizing Parabolic indicators across multiple time frames allows for more stable entry points, enhancing accuracy in trading decisions.
The EA incorporates numerous useful functions, but not all of them need to be utilized. To make adjustments, focus on changing the lot size, take profit (TP), and stop loss (SL) settings.
By default, both the TP and SL are set at 50 pips each. If a trade is closed
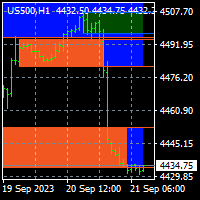
To get access to MT5 version please create personal order. This is the exact conversion from TradingView: Order Blocks & Breaker Blocks [LuxAlgo] This is a light-load processing and repaint indicator. All input options are available. This is not a multi time frame indicator. Buffers are available for processing in EAs. You can message in private chat for further changes you need.

Smart Invest Basic (EA) employs an averaging strategy designed for long-term profitability with low risk. It operates by initiating trades and setting take profit levels. If the market quickly reaches the take profit point, it opens another trade upon the next candle's opening. Conversely, if the market moves against the trade, it employs an averaging technique to secure more favorable prices. The EA's primary approach involves using smaller lots to prevent significant drawdown during

Smart Invest Premium is a sophisticated enhancement of the Smart Invest Basic EA, designed to optimize long-term profitability with a focus on flexible and customizable risk management . This advanced version introduces dynamic grid trading capabilities, allowing users to configure multiple grids , each with distinct sizes and risk parameters . This flexibility empowers traders to tailor the EA to their specific trading strategies and risk tolerance, making it a ve

Achieving a high win rate in various activities, such as gaming, investing, or sports, often requires a combination of skill, strategy, and discipline. Here are some general principles that can help you develop a high win rate strategy: Skill Development: Mastery of the fundamentals is crucial. Whether it's a game, a financial market, or a sport, invest time in learning the basics and continually improving your skills. This might involve studying strategies, practicing regularly, or seeking out

Xtractor EA
Est un mécanisme véridique dont l'objectif est de scalper le montant spécifié des bénéfices et des pertes fixes à l'aide de l'intelligence artificielle et il est strictement efficace sur {US30 NYC} en utilisant un courtier recommandé testé [ ICMarkets] Xtractor EA est basé sur la stratégie de position en attente (PPS) avec un algorithme de trading avancé plus élevé. Il utilise l'ordre d'achat / l'ordre de vente, les lignes de tendance et l'action des prix avec quelques indicateurs
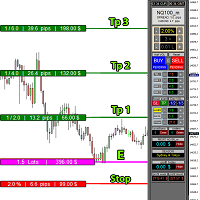
educational video https://www.youtube.com/watch?v=EHK_Z-9FvdM If you want to test the free version, you can download the file from the link below and test it in Alpari broker in demo accounts mt4. Download link free version: https://www.uplooder.net/files/199902052dcb318fb85a20262e8bd6b0/TPS-TradeManager-freeDemoFo-r-a-lpariBroker.ex4.html Download Metatrader 4 for free testing in demo accounts: https://www.uplooder.net/files/0e489a0794f5bf9130e149d0a8eb8f85/alpari4setup.exe.html Performance :

Modify TP SL Pending Orders Selected chart. Please leave a review about this product to help other users benefit from it. This script avoids modifying existing BUY and SELL ( TP & SL ) orders. + User-friendly utility + Help adjusting Take Profit and Stop Loss points for all your running orders automatically + Compatible with orders Sell Limit , Buy Limit , Sell Stop , Buy Stop + Easily edit all orders with appropriate new P&L values + The indicator works only on the selected window. There's no

This EA uses a very unique logic. I don't really want to say this, but it enters the market shortly before a new candlestick forms. The reason for this is that entering when a new candlestick forms is too late. By entering just before, you can capture profits quickly. However, it's essential to set a reasonable stop loss. It is highly recommended to use it on a VPS (Virtual Private Server) close to the MT4 server to minimize entry delays, as delays in entry can lead to less favorable results. Pl
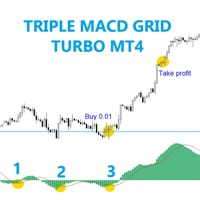
The EA trades when MACD signal cross 3 times . Best time frame 30 mins, Any pair any broker no limited, recommend minimum deposit 500$
SETTING Symbole - Set symbol to trade. Fast_EMA_period - Set Fast EMA period. Slow_EMA_period - Set Slow EMA period. Signal_period - Set signal period. Lots - start lot. Multiple_lots - Multiply lot for next order. Max_lots - maximum lot. Grid_boost - Frequency of opening position (Less more order). Grid_minimum_pips - Check distance grid from last order.

Unlock the full potential of your trading strategy with the Large Strong Signal MT4 Signal Indicator. Designed with precision and reliability in mind, this powerful tool empowers traders with invaluable insights to make informed trading decisions. Here's why "Large Strong Signal" stands out in the crowded landscape of trading indicators: Enhanced Market Awareness : Gain a deeper understanding of market dynamics through our meticulously crafted indicator. It offers a comprehensive view of price
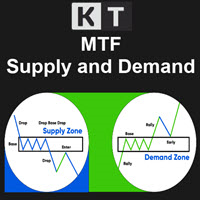
KT Supply and Demand indicator identifies and plots key supply and demand zones. It achieves this by analyzing swing points and integrating them with a multi-timeframe analysis, ensuring that only the most crucial supply-demand zones are highlighted. This advanced method highlights the regions where prices are likely to reverse, stemming from significant supply-demand zones established by recent price movements.
Features
Precision Analysis: Our refined algorithm is designed to accurately pinpo

Trend expert adviser, Trend breakout expert adviser, Price action trading, Trend Predictor EA, Trend trading strategies, Trend following indicators, Trend breakout patterns, Trend Follower EA, Trend catcher strategy, Breakout catcher techniques, Price action analysis, Trend following signals, Trend breakout confirmation, Trend Rider EA, Trend catcher system, Breakout catcher indicator, Trend Tracer EA, Price action patterns, Trend trading signals, Trend following methods, Breakout catcher strat
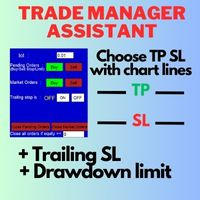
Hello Traders,
This EA tool help is very helpful in your risk money management, it helps to open pending & market orders based on your % risk from your equity or the amount risk chosen
You can also set a TP and SL, Open price with the drawn horizontal lines of the EA.
The EA can also close all orders with one click and set a trailing stop.
You can find below more details in the video :
https://www.youtube.com/watch?v=iSHH_zojcsM&t=229s

Dévoilement de l'indicateur de tendance XY sans repeint : Votre guide ultime pour le succès sur le Forex et les options binaires Dans le monde dynamique du trading Forex et des options binaires, il est essentiel de garder une longueur d'avance. Les traders sont constamment à la recherche d'outils qui peuvent leur donner un avantage concurrentiel, et l'un de ces outils puissants qui fait des vagues dans la communauté des traders est l'indicateur "Non-Repainting XY Trend". Introduction L'indicateu

Reverse Martingale, also known as the "Paroli" betting system, is a gambling strategy used primarily in games of chance such as roulette, blackjack, or even sports betting. Unlike the traditional Martingale system, where a player doubles their bet after a loss, the Reverse Martingale involves increasing the bet after a win and reducing it after a loss. This strategy is often employed by individuals hoping to take advantage of winning streaks and capitalize on short-term gains. Here's how the Rev

AJ OPTIONS USES THE TREND WAVE INDICATOR AND IT CAN IDENTIFY THE BEGINNING AND THE END OF A NEW WAVE TREND MOVEMENT. AS AN OSCILLATOR, THE INDICATOR IDENTIFIES THE OVERBOUGHT AND OVERSOLD ZONES. IT WORKS GREAT TO CATCH THE SHORT TERM PRICE REVERSALS AND USES A MARTINGALE STRATEGY TO CLOSE ALL TRADES IN PROFIT. USE DEFAULT SETTINGS ON H1 OR HIGHER TIME FRAME ON ANY PAIR FOR MORE ACCURATE TRADES
WHY THIS EA : Smart entries calculated by 5 great strategies The EA can be run on even a $20000 accoun

Are you ready to unlock the full potential of trading XAU/USD (Gold) on the 5-minute timeframe? Meet Gold Exchange, your trusted partner for achieving precision trading, breakout opportunities, and loss minimization. Key Features: Breakout Trading: Gold Exchange is engineered to identify breakout points within the trend on the 5-minute XAU/USD chart. This feature allows you to capitalize on market momentum, capturing entry points with high profit potential. Trend Recognition: Our expert advisor

Swing trading is a method in which traders attempt to take advantage of market fluctuations. They buy a security when they believe the market will rise and sell if they feel the market will fall, which, as you can imagine, is common in most trading strategies, irrespective of trading style.
The four most frequently occurring patterns in the swing trading domain are reversal, retracement (or pullback), breakouts, and breakdowns.
it work all currency pair, and work all timeframe
100% non repaint

Utilities
This is an EA program to make it easier for traders to place open limit orders on the market. This program is equipped with: Set Lots Set BuyLimit, (this is the first price you must input to set up a BuyLimit order on the chart) Set SellLimit, (this is the first price you must input to set up a SellLimit order on the chart) SL and TP sets, Set Magic Number (I also matched it in the Order Comment) Set STEP By Point, Set Max Order, and Close all by Magic Number (you can close all order

Forex Market is very dynamic. Whatever strategy you used to trade the market will always face its ups and downs. What I learn from my experience, we have to embrace drawdown as part of our trading life and try our best to manage it, growing the account while waiting the drawdown decreasing over time. So the key is : - Ideal capital to cover the drawdown until a certain max percentage of the balance. - Built in algorithm to grow profit while in drawdown and in profit position such as how to benef

An indicator based on candlestick patterns
To catch short-term and long-term trends
If it gives a signal in the direction of the trend, it is long term
And if it gives a signal in the opposite direction of the trend, it is short term
Too many signals
Can be used in all symbols
Can be used in all time frames
Attributes: Too many signals Can be used in all symbols Can be used in all time frames Simple settings Simple and fast usage With author lifetime support
Settings: Candle back: The number

MACD Pro I EA
https://youtu.be/2wCzTFIGNp4 =============== This Robot is fully automated and has been created for everyone. The Robot works also on cent accounts.
The Ea is based on the MACD Indicator and 3 more and has been kept simple. ========================================= Maybe better to go for small profit, set it on higher time frames then you can use it for more pairs at the same time. =========================================== => works on all Time Frames but i would recommend the

The Fantastic Price Entry Signal Indicator is a powerful tool designed to assist traders in making informed decisions in the financial markets. This advanced indicator leverages cutting-edge algorithms and technical analysis to identify potential entry points with high accuracy.
Features: 1. Precision Entry Points: The indicator generates precise arrow signals on the chart, highlighting potential entry points for various trading strategies.
2. Trend Identification: By analyzing price mov

A Bollinger Bands hedge strategy is a trading strategy that utilizes Bollinger Bands to make trading decisions and manage risk. Bollinger Bands are a technical analysis tool that consists of a middle band (usually a simple moving average) and two outer bands that are typically set at a certain number of standard deviations away from the middle band. These bands expand and contract based on market volatility. Here's a basic outline of a Bollinger Bands hedge strategy: Objective : The primary goal
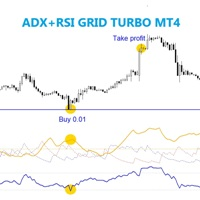
The EA trades on price which over bought and over sold of RSI indicator meanwhile check over limit ADX value level. Best time frame 30 mins, Any pair any broker no limited, recommend minimum deposit 500$
SETTING Symbole - Set symbol to trade. ADX_period - Set ADX period. ADX_value - Set ADX level. RSI_period - Set RSI period. RSI_upper_level - Set RSI high level. RSI_lower_level - Set RSI low level. Bar_history - Set bar to confirm trade. Lots - start lot. Multiple_lots - Multiply lot for ne
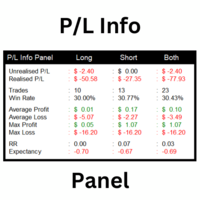
This utility shows various types of information on chart, controlled by many filters and option for each of them. If you want any custom feature or want to remove something from this product for your personal use. Please send me a personal message, I'll be happy to do so for you. Inputs and features explained: BG Color - Background color of the Dashboard
Text Color - Color of text info on the Dashboard
Border Color - Color of Border of the Dashboard Set Color on +/- Text - True/False opt
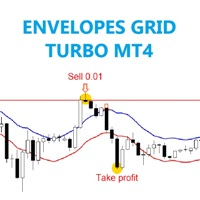
The EA trades on candle which over bought and over sold of Envelopes indicator meanwhile check body size pips from the line level. Best time frame 30 mins, Any pair any broker no limited, recommend minimum deposit 500$
SETTING Symbole - Set symbol to trade. Envelopes_period - Set Envelopes period. Envelopes_deviation - Set Envelopes deviation. Check_Candle_pips - Check distance from the Envelopes break line. Lots - start lot. Multiple_lots - Multiply lot for next order. Max_lots - maximum
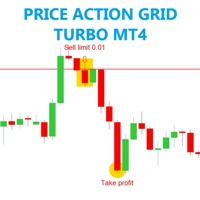
The EA trades on pending order price which breakout out from the previous bar . Best time frame 30 mins, Any pair any broker no limited, recommend minimum deposit 500$
SETTING First_candle_body_size_pips - Minimum size of previous candle. Last_candle_body_size_pips - Minimum size of last candle before pending order. Delete_pending_time_minute - Time to be release pending order. Lots - start lot. Multiple_lots - Multiply lot for next order. Max_lots - maximum lot. Grid_boost - Frequency of

Introducing the SPYDER AI Intraday EA , a revolutionary forex expert advisor that combines cutting-edge technology with the power of CHATGPT and AI to navigate the complex world of currency trading. Designed to excel in both trending and ranging markets, SPYDER AI Intraday EA brings a new dimension to your trading experience. Telegram for live updates(myfxbook) and huge discount - https://t.me/botshub670 With a special focus on the AUDNZD , AUDCAD , and EURGBP currency pairs, SPYDER AI Intraday

This EA is based on the closing price from last Friday's weekend. The closing price from last weekend reflects the market sentiment of the past week, and it is known to have a significant impact on price fluctuations in the following week. This EA was created with this idea in mind. For stable operation, the stop-loss is set at 90 pips. Additionally, grid orders are placed every 30 pips, but in most cases, all orders are closed without hitting the stop-loss. The best pair for this strategy is EU
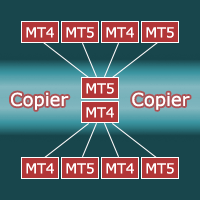
Copier for the MetaTrader4 terminal. Designed to copy trade from one terminal to another. Compatible with the version for the MetaTrader5 terminal; if available, copying can be performed between different terminals (regardless of the type of accounts: hedging or netting). The number of accounts to which copying is possible is not limited (depends only on the computing power of your computer). Directions for copying the version for MetaTrader 4 together with the version for MetaTrader 5: MT5 Net

Get all benefits of a grid strategy and none of its disadvantage | Built by a grid trader >> for grid traders.
This is MT4 version, click here for Blue Sonic Donchian MT5 (settings and logics are same in both versions) Real monitoring signal --> Sonic Gold | Sonic Fx Intro BlueSonic Donchian EA ('Sonic') is a next-gen multi-currency multi-timeframe EA base on Donchian indicator. Other than normal one-off entry, users would have option to activate grid series to maxi
*NOTE : 40% de réduction pour les premiers acheteurs ! La sortie de Free EA aura lieu la 2e semaine de novembre La réduction est terminée une fois que l'EA GRATUIT est disponible L'indicateur RSi est l'un des indicateurs les plus populaires pour indiquer lorsqu'un certain produit ou paire est suracheté ou survendu. Currency Strength Meter est également un indicateur de tendance basé sur plusieurs devises. RSi Currency Strength Meter est un indicateur à un graphique qui a l'algorithme de RSi et

Hello, today I'd like to introduce a new EA called "Storm Hammer". Storm Hammer is a single order EA with clear Stop Loss and Take Profit. The entry for trading orders depends on the conditions of three candlesticks, and profit is generated based on the following conditions: If an order hits the Take Profit, it means you win. However, if an order hits the Stop Loss, it means that in the next order, your lot size will be doubled compared to the previous order. This EA may have a moderate level of
Bienvenue dans le monde des solutions commerciales innovantes! Nous présentons à votre attention notre conseiller commercial avancé FTC Neuro , travaillant sur la base des statistiques macroéconomiques actuelles et des calculs de neuroset modernes. En analysant la situation du marché à l'aide d'algorithmes complexes, le conseiller reconnaît les modèles cachés de l'information économique à l'aide d'algorithmes avancés d'intelligence artificielle. Il vous offre l'expérience de trading la plus pro

The strategy is based on Order-Block concept with MVB(Most Volatile Bar) concept. To determine a good zone of concern to focus for users, the zone are painted in blue and target levels are in thin redline. The mindset behind this indicator was to help users grow naturally while also making money trading. This strategy works so well on XAUUSD, the win rate is over 85%. To Buy! > Trader MUST see a Bullish Engulfing Candlestick pattern (HIGHER High, HIGHER Close Candle), at the Bank Zone (The Blu
MetaTrader Market - les robots de trading et les indicateurs techniques pour les traders sont disponibles directement dans votre terminal de trading.
Le système de paiement MQL5.community est disponible pour tous les utilisateurs enregistrés du site MQL5.com pour les transactions sur les Services MetaTrader. Vous pouvez déposer et retirer de l'argent en utilisant WebMoney, PayPal ou une carte bancaire.
Vous manquez des opportunités de trading :
- Applications de trading gratuites
- Plus de 8 000 signaux à copier
- Actualités économiques pour explorer les marchés financiers
Inscription
Se connecter
Si vous n'avez pas de compte, veuillez vous inscrire
Autorisez l'utilisation de cookies pour vous connecter au site Web MQL5.com.
Veuillez activer les paramètres nécessaires dans votre navigateur, sinon vous ne pourrez pas vous connecter.