Regardez les tutoriels vidéo de Market sur YouTube
Comment acheter un robot de trading ou un indicateur
Exécutez votre EA sur
hébergement virtuel
hébergement virtuel
Test un indicateur/robot de trading avant d'acheter
Vous voulez gagner de l'argent sur Market ?
Comment présenter un produit pour qu'il se vende bien
Expert Advisors et indicateurs gratuits pour MetaTrader 4 - 33

The Hi Lo Breakout is taken from the concept of the ZZ Scalper EA which exploits the inevitable behaviour of price fluctuations and breakouts. The fact that because market prices will always fluctuate to higher highs before ebbing down to lower lows, breakouts will occur.
But here I've added a few more filters which I see work well also as an Indicator.
Range Analysis : When price is within a tight range this Indicator will be able to spot this and only then look for price breaks. You
FREE

DSS is similar to Stochastic except for this Indicator we use what is called double exponentially smoothing. This will give the trader a more speedy response to price changes which tends to smooth out the erratic movements of a regular Stochastic. Because its always best to know what the larger timeframes are doing. I have adopted the tactic of overlaying the larger chart of DSS over the smaller chart to gauge whats going on overall and to pint point best entry or exit points. I have left it adj
FREE

Megatrends Indicator Time Frame: Suitable for any time frame. Purpose: Trend Prediction. Blue and red color indicate the buy and sell call respectively. Buy: When the blue line is originating it is opened buy call. Sell: When the Red line is origination it is opened sell call Happy trade!! this indicator is suitable for all time frame, but our recommended time frame to use 1hour and 4 hours, suitable for any chart.
FREE

EA "GenisysX Knight" is an advanced system that exploits unique fluctuation between AUD, CAD, and NZD currencies. Historically results show that these pairs used in composition always return back first moved pair after fast movement in one direction. This observation can allow us to include a grid-martingale system where can get maximum points of these unique situations.
EA "Undefeated Triangle" uses only 3 pairs: AUDCAD, AUDNZD, and NZDCAD. Real account monitoring ; Much cheaper than si
FREE

This EA has been designed to achieve stable trades regardless of market fluctuations. The optimal time frame for this EA is M5. It calculates the price changes in higher time frames, such as H1 and H4, and looks for entry points after a significant trend has occurred and the price starts to retrace.
It is recommended to set wider take profit and stop loss levels. This setup works well for one trade per day. If a trade ends in a loss, the EA waits for an opportunity to re-enter with double the l
FREE

I have designed a logic based on the widely used RSI indicator in Forex trading. Normally, it is well known that entering trades when the RSI value is overbought or oversold is effective, but it is not very effective when the trend reverses. Therefore, as a countermeasure, this EA (Expert Advisor) enters counter-trend trades after entering based on the RSI value. In other words, it uses a grid order strategy, but instead of placing orders at fixed intervals, it places additional sell orders when
FREE

The MAtrio indicator displays three moving averages on any timeframe at once with a period of 50-day, 100-day, 200-day. After attaching to the chart, it immediately displays three moving averages with the parameters of simple (SMA) moving average SmoothingType50 , simple (SMA) moving average SmoothingType100 , simple (SMA) moving average SmoothingType200 . Accordingly, with the price type ValuePrices50, ValuePrices100, ValuePrices200 , by default, the price is Close price everywhere. All parame
FREE

Certainly! A candlestick pattern EA is an Expert Advisor that automates the process of identifying specific candlestick patterns on a price chart and making trading decisions based on those patterns. Candlestick patterns are formed by one or more candles on a chart and are used by traders to analyze price movements and make trading decisions. EA likely scans the price chart for predefined candlestick patterns such as the Hammer, Inverted Hammer, Three White Soldiers, and Evening Star. When it
FREE

This Expert Advisor will change how you manage your risk forever.
The EA automatically calculates your position size by either looking at your balance or equity. You need simply type in how much risk you want to have on that particular trade, move your TP line and SL line and it does the rest. Click buy or sell and it enters the position and places your TP/SL for you. It does the same thing for pending buy limits or sell stops. Feel confident knowing your risk before entering your trade! Most
FREE

Diversify the risk in your trading account by combining our Expert Advisors. Build your own custom trading system here: Simple Forex Trading Strategies
The expert advisor opens trades when the SMAs cross and when the WPR has left overbought/oversold areas. The SMAs are also programmed to close the trades if the trend changes. The Stop Loss, Take Profit, and Trailing Stop are calculated based on the ATR indicator. The recommended currency pair is NZDUSD and the recommended timeframe to operat
FREE

RaysFX StepMA+Stoch Caratteristiche Principali Adattabilità: Il nostro indicatore RaysFX StepMA+Stoch è progettato per adattarsi alle mutevoli condizioni di mercato. Utilizza l’Average True Range (ATR) per misurare la volatilità del mercato e regolare di conseguenza le sue strategie di trading. Precisione: L’indicatore genera segnali di trading quando la linea minima incrocia la linea media. Questi segnali sono rappresentati come frecce sul grafico, fornendo punti di ingresso e di uscita chiari
FREE
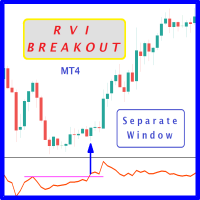
Probability emerges to record higher prices when RVi breaks out oscillator historical resistance level. It's strongly encouraged to confirm price breakout with oscillator breakout since they have comparable effects to price breaking support and resistance levels; surely, short trades will have the same perception. As advantage, a lot of times oscillator breakout precedes price breakout as early alert to upcoming event as illustrated by 6th screenshot. Furthermore, divergence is confirmed in case
FREE

This Expert Advisor does not take positions, This EA is made just for: "Trailing Stop Loss". Description The expert moves the SL by Moving Average value or by last candle's high or low(candle trailing). Indicator Parameters Trailing Method (trailing by moving average value or candle trailing). MA Period (period of moving average). MA Method (simple, exponential, smoothed, linear weighted). Apply to (when you select "Trailing With MA" method, calculation and moving average based on close, op
FREE

Price Trap Test
This is a free version of the Price Trap Full Expert Advisor designed to provide an opportunity for free testing of the algorithm on a live account, and not in the strategy tester. The trading signals algorithm is exactly the same here, the difference is that you cannot change the parameters, with the exception of GMToffset . Full version verified with broker just2trade Parameters
GMToffset - your broker's time difference and GMT.
FREE

Le tableau de bord MT4 CCI Scanner vous aide à suivre les niveaux de l'indice des canaux de marchandises (CCI) sur différents délais et instruments, et fournit des alertes en temps réel lorsqu'un nouveau signal est détecté. Il est convivial et léger en termes de puissance de calcul, garantissant une performance fluide sur n'importe quel ordinateur. Caractéristiques clés : Regroupement automatique des instruments : Le scanner collecte tous les instruments de votre liste de surveillance du marché
FREE

Strong and weak Pairs is a trend following indicator to help you choosing the pairs to trade based on the currency score. Strong and weak Pairs is comparing currencies position to the moving average for all major pairs then display the position score from Zero (0) to Seven (7) with two lines on the chart. 7 is the strongest currency and zero is the weakest currency. Additionally there is a dashboard displaying all the currencies score to choose the pair you will trade. Strong and Weak Indicator
FREE

FusionAlert StochRSI Master is an indicator available for MT4/MT5 platforms, it is a combination of RSI & Stochastic indicator which provide "alerts" when the market is inside "overbought and oversold" regions combined for both indicators, results in more precise and accurate signals to be used as a wonderful tool, in the form of "buy or sell" signals. This indicator comes with many customization options mentioned in the parameter section below, user can customise these parameters as needful. Jo
FREE

MerkaStudent is a basic version of an expert advisor that allows us to understand part of the behavior of a chart in historical time.
It uses some basic parameters in trading, which allows us to understand mathematically how a chart moves and thus know what is our mathematical expectation in the historical period analyzed. Starting from a mathematical logic, we can create a strategy to evaluate its results.
FREE

Lemon Cat Scalper Free Version. The ideal time frame of this EA is M15, however lower timeframes are also suitable. I mainly used M15 and M5 for backtesting. This EA simply uses previous bars to determine the position for opening orders. It uses a very special strategy for defending losing positions, and it has passed 10 years backtest for most symbols. This EA is mostly suitable for EUR/USD, USD/CAD, AUD/USD, NZD/USD, EUR/CAD, EUR/AUD, AUD/CAD, AUD/NZD and NZD/CAD, however other symbols are
FREE

The standard RSI indicator is very helpful in identifying overbought or oversold areas during a flat, but gives a lot of false signals when the market is trending. For example: during an uptrend, the standard indicator often enters the "oversold" zone and extremely rarely (most often, when the trend has already ended) enters the "overbought" zone. This indicator takes into account the trend movement and, with the selected settings, can enter the zone opposite to the trend direction, giving a sig
FREE

This Dashboard is free to download but is dependent on you owning the Flag Trend Pro MT4 indicator. Down load the indicator: Flag Trend Pro
The Dashboard will show you on a single chart all the timeframes (M1 to Monthly) with their own status for the indicator: Gold Pro MT4
all time frame and all symbol: smart algorithm detects the trend, filters out market noise and gives entry signals!!!
How to understand the status: symbol - Fill All the Pair what you want. M1, M5, M15,M3
FREE

Whether you are a scalper or daily trader, you will always look for bullish / bearish engulfing candles. This can be a bit tricky and stressful when you try to visually identify the engulfing candles on the chart. Not only that, you might be trading on the M15 time frame but the engulfing candle is forming or has already formed in the H4 time frame. This indicator is made to do that on your behalf. You can trade on any time frame and see Engulfing candles of another time frame, this means that y
FREE

Engulfing candlestick patterns are comprised of two bars on a price chart. They are used to indicate a market reversal. The second candlestick will be much larger than the first, so that it completely covers or 'engulfs' the length of the previous bar.
By combining this with the ability to look at trend direction this indicator eliminates a lot of false signals that are normally generated if no overall trend is taken into consideration
FREE
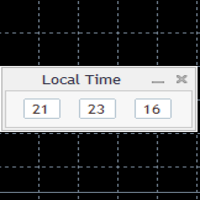
Simply clock. Local time as default. There are possible to Select: Local Time /Server Time /GMT Time as input. Please take into account that the local time is the most accurate. However ,this clock always uses local time seconds, even If GMT / Server Time Is selected. I solved it this way to get more accuracy. Delays can occur when changing minutes or hours, if local time is not selected.
FREE
Velvet MACD is intended for use with the Velvet advanced ordering layer. It is a modified version of the MACD indicator provided by Metaquotes and all of the data it displays is accurate and verified, when it is detected by the ordering layer. In order to place orders with the Velvet MACD indicator, the ordering layer must be installed and running. Ordering from the Velvet MACD indicator requires that "Velvet Ordering Layer" ( found here ), version 2.0 or higher, be installed and running. Whe
FREE
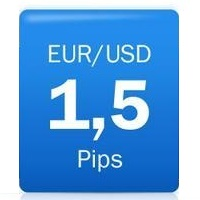
Displays current spread in the main window of the chart. Indicator Setting: BigDisplay =true or false to switch on and off.
DisplaySize = 20 is default
DisplayColor = Blue
Display_y = 550 position: staring position Y of background panel
Display_x = 1200 position: staring position X of background panel
Author: Happy Forex (Expert Advisor - your algorithm-driven profit, without stress or work)
FREE

A very useful indicator for trading, which shows the current load on the deposit. The load is calculated by the formula (margin / balance) * 100%. If necessary, the indicator beeps when the load on the deposit exceeds a certain level. The load is displayed total, taking into account all open positions.
Indicator parameters:
Color - text color. Font size - font size. Font family is a font family. Right - indent to the right. Bottom - indent bottom. Max load - the maximum load at which the sound
FREE

The indicator displays on the chart a map, on which markers show the current trading session, as well as shows a text. The indicator provides two types of background display: white and black. The indicator is displayed as the background and does not hinder tracking the current market situation.
Parameters: GMT - the time difference of the terminal and GMT. Background - selection of background - black or white.
FREE

EA BUMAN may not have a high frequency of entries, but it can provide stable profits. The entry logic is quite simple. It only uses one moving average line.
It enters trades when the candlestick crosses the Exponential Moving Average (EMA) line. If the closing price of the candlestick is above the moving average line, a BUY entry is executed. If it is below the moving average line, a SELL entry is executed.
To increase the profit-taking win rate, it is important to effectively use the Break Ev
FREE

Индикатор " AutoDiMA " рисует по графику в основном окне скользящую среднюю с динамическим периодом, рассчитываемым по стандартному индикатору " Average True Range (ATR) ". Когда " ATR " изменяется в диапазоне значений между верхним уровнем и нижним уровнем - тогда в заданном диапазоне меняется вариативный период скользящей средней. Принцип ускорения или замедления скользящей средней переключается в настройках параметром " FLATing ".
ВХОДНЫЕ ПАРАМЕТРЫ: - DRAWs : Количество баров для отображения
FREE
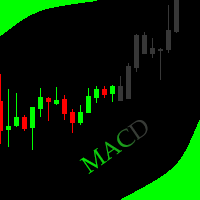
This indicator allows to hide MACD oscillator (on all MT4 timeframes) from a date define by the user, with a vertical line (Alone) or a panel (with "Hidden Candles"). Indicator Inputs: Fast EMA Period Slow EMA Period Signal SMA Period Apply To Information on "MACD" indicator is available here: https://www.metatrader4.com/en/trading-platform/help/analytics/tech_indicators/macd ************************************************************* Hey traders!! Give me your feeds! We are a community h
FREE
This indicator helps you to Scan symbols which are in the Market Watch Window (in demo Max 15 Symbol) and filter out trends with alerts. It works based on the most popular indicator "Bollinger Bands" which is used by many traders for trading: When box color changes to " Green " or " Red " color, it indicates you for trend change for long and short entry. And also you will get alerted on screen. When it changes to " Green ", it indicates you that trend is going upwards, and you can take the long
FREE

The indicator displays information about:
the name of the currency pair and timeframe. current price bid. time before the close of the candle. the current difference between the ask and bid (spread). Trading volume stats can also be displayed.
Displayed data
Name, account number, and account currency. A deposit in the account currency. Balance at the current time and a percentage of the balance. Current profit and its percentage. Current transaction and the percentage of the total deposit. Pr
FREE
Retracement Reversal and Support and Resistance Pro is based on a formula used by Proprietary trading firms and other big institutions on WallStreet including on my Company and used by my traders here in the capital of the world. This indicator will create Red and Green arrows on a possible mayor Retracement level, Reversal Level and future Support and Resistance levels and Yellow arrows on a possible m i nor Retracement level, Reversal Level and future Support and Resistance levels . This in
FREE

EXTREME PRICE ACTION DASHBOARD
Make your trades professionally using advanced statistics and price action. Manages 29 pairs simultaneously. It has Buy and Sell buttons, close buy and close sell separately for each pair. Stop Gain and Stop Gain programmable in Pips automatically. Dynamically calculates 5 regions where statistically the most assertive sales and 5 more assertive shopping regions are found. Indicates the total lots, buy balance and sell balance for each pair. Change the graph's t
FREE

Multi-devises, indicateur multi-devises, vous permettant de voir la tendance basée sur l'intersection de 2 EMA sans clics supplémentaires, il recherche la Dernière intersection sur tous les délais à la fois et écrit dans le coin supérieur gauche dans quelle direction la tendance de la paire de devises ouverte est dirigée, ainsi que depuis combien de temps était la Dernière intersection.
Sur la base de cet indicateur, vous pouvez ouvrir des ordres si la plupart des tendances sont dirigées vers
FREE

FTU Idiotèque L'indicateur est destiné à la plateforme MT4, peut être utilisé seul mais mieux combiné avec d'autres indicateurs ou stratégies Combine divers indicateurs tels que macd, adx pour dessiner une flèche pour suggérer une entrée ou un changement de tendance Regardez une courte vidéo d'introduction sur youtube : https://youtu.be/lCRJ3mFNyOQ Caractéristiques de l'indicateur : Flèches de vente et d'achat Alerte visuelle et sonore Poursuite de la tendance / Signal de changement de tendance
FREE
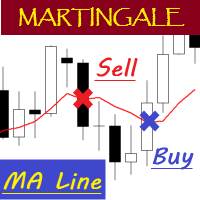
EA "MA Line" with martingale feature
To see how EA works, please watch the video below. In the video, I perform parameter optimization and do a backtest. The parameters that are optimized are: - MA Period - Stop Loss - Take Profit
For the future, I will try to optimize and test EA, especially the expert advisors in the mql5 community. hopefully it can be useful for colleagues in the mql5 community.
FREE

This EA exploits the inevitable behaviour of price fluctuations and breakouts. Because market prices will always fluctuate to higher highs before ebbing down to lower lows, breakouts of these levels will occur. This EA will open a trade in anticipation of catching some of the profits from these breakout moves. We use the fixed exit methods of Stop Loss, Take Profit and Trailing Stop in such a way so that we will scalp small but consistent profits.
No martingales needed, just a simple but ex
FREE
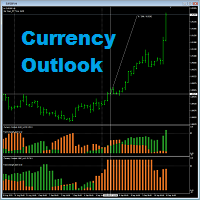
Currency Outlook is an indicator that can help us "Trade the right pair in the right direction and at the right time". This indicator analyzes prices of all cross currency pairs of the selected currency and report the result to us in form of double colours histogram diagram. The maximum height of the histogram diagram of the indicator is 100. The indicator is exclusively programming for AUD, CAD, CHF, EUR, GBP, JPY, NZD and USD. A feature for calculating trade lot size has been added to th
FREE

FREE
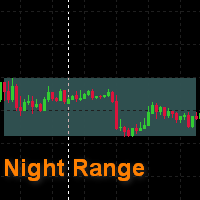
This is a simple indicator that draws a night range. The start and the end of a working day are specified in hours, color rectangles are adjusted as well. It helps to view the history in search for regularities , excluding unpredictable night time. It can be used to search for a breakthrough of the night range. It is drawn as a background , and does not cover a chart and other indicators .
FREE
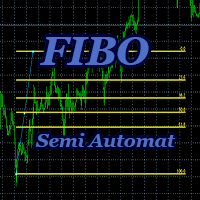
Advisor-assistant for those who like trading on Fibonacci levels. Automatically finds manually plotted Fibonacci Lines on the chart, and opens an order when the levels are broken. The Expert Advisor has 4 customizable levels and the ability to turn them off as unnecessary.
Parameters: Lot - order volume (lot); Requote - price slippage; Magic - individual number for all EA orders, works only with own orders; Name Fibo - set initial name of Fibonacci lines; Level parameters are ide
FREE

Всем привет, мои друзья, сябрыыы. Я трейдер, 20 лет опыта. Хочу продемонстрировать свой индикатор. Индикатор создан на базе в тесной кооперации с индикатором arrows_template. Данный индикатор рисует на графике инструмента (любого) индикатор AO(Awesom) поверх. Видите сам AO на графике. Видите пересечение зоны нуля, Блюдце и т.д.. Если будут подсказки, корректировки. Пишите смело, всех пошлю.......Шутка До свидания.
FREE

***IMPORTANT: This free indicator works with the paid for Strong Weak Forex Expert Advisor. The EA also depends on the following custom indicators: Strong Weak Heiken Ashi Strong Weak Parabolic Strong Weak Values Strong Weak Symbols Download them for free in the Market. The EA will not work without it. These are all custom indicators which the Strong Weak Forex Expert Advisor relies on to generate trading signals. If you have any problems with installation send me a message.
FREE

FIBO ALERT https://www.mql5.com/en/market/product/34921
This indicator draws a fibonacci retracement (high and low) of a candle. It alerts and notifies the user whenever price touches or crosses the fibonacci levels. INPUTS ON Alert: set to true will alert pop up whenever price crosses levels at chart time frame. ON Push: set to true will send push notification to phone whenever price crosses levels at chart time frame. ===== FIBO (High & Low) ===== Time Frame: indicator draws fibonacci leve
FREE

As we know, МТ4 and МТ5 do not store tick history, which may be necessary to develop trading strategies and market analysis. I have developed a method allowing you to receive tick history very easily. The indicator gathers tick history in real time and writes it to XXXXXX2.hst file, where XXXXXX is a symbol name. This file can be used to create an offline chart or something else. If you use a trading robot, then launch the indicator and control your broker by examining the spread and quotes. All
FREE

Acceleration/Deceleration Technical Indicator (AC) measures acceleration and deceleration of the current driving force. This indicator will change direction before any changes in the driving force, which, it its turn, will change its direction before the price. If you realize that Acceleration/Deceleration is a signal of an earlier warning, it gives you evident advantages. But, a classical AC indicator does not include any input parameter. In the source file we can see that this indicator are us
FREE

This indicator is based on the MACD indicator
Also, some candlestick patterns are used in it to identify better signals
Can be used in all symbols
Can be used in all time frames
Easy to use method
Adequate settings
Settings: period: The number of candles used to calculate signals. pFast: Like the MACD indicator settings pSlow: Like the MACD indicator settings
alarmShow: If you want to receive an alert in Metatrader after receiving the signal, enable this setting alarmShowNoti: If you want to
FREE

Hello everyone,
Today I want to share with you a strategy who is designed especially on EURUSD timeframe M1 .
Chevre miel is not spread sensitive . Chevre miel is very easy to use . Chevre miel does not use any dangerous strategy .
The expert is free because it doesn't trade often.
Settings : Autolotsize : can be true or false . if it's true the expert will trade with a percent of you balance that you can choose. if it's false the expert will trade with the lot that
FREE
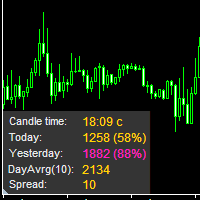
The information panel displays important trading information on the chart. Visual display of the information will help you to make a prompt and precise trading decision. Screenshots depict information which I use in my trading system. But you can add any other desired information. To do this contact me via MQL5 web-site. Displayed information: Time till the end of the current candle and formation of a new one. Time set format: hh:mm, if there is at least one full hour, or mm:ss, if you have les
FREE

Flash Scalper is a scalper Expert Advisor that exploits acceleration of volatility of the market. It goes into action when there is an explosion of volatility for example during the news or special events. The minimum volatility is settable from input parameters. The EA work every time with stop loss and take profit, no martingale. Any initial deposit on account is allowed to start work with this expert advisor. The most important conditions for this expert advisor are low spread and fast execut
FREE

AC Pivot Panel – Your Ultimate Pivot Trading Tool The AC Pivot Panel is a powerful yet user-friendly pivot point indicator designed to help traders identify key support and resistance levels with ease. Whether you’re a beginner or an experienced trader, this indicator simplifies pivot trading and enhances your decision-making process. Key Features : Interactive Selection Panel : Easily adjust pivot settings directly on the chart with a compact and intuitive panel. Multiple Pivot Methods : C
FREE

The M.O.D.E stands for " Multiple Oscillator Divergence Exit ". It is an indicator which signals a divergence between the price, and multiple oscillators. It is initially an exit indicator because it signals the weakening of a trend, but it could be used as an entry signal if used analytically Key Features: Check many divergences at once Non repainting Sends Alerts and Push Notifications You could load the M.O.D.E onto a single chart, and be able to see the divergences happening on multiple os
FREE
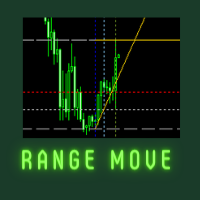
Welcome to Range Move Indicator page This indicator is suitable for Multitime frame and working with any pair including gold and silver pattern also. Very simple and profitable indicator forever. Buy open: when the candle break above the break line 100% sure buy call has open and buy tp line formed in yellow color. Sell open: when the candle break below the break line 100% sure sell call has open and sell tp line formed in yellow color.
FREE

The Trend DashBoard Indicator for MT4 BULLISH or BEARISH trend information and provides UP and DOWN arrow signals. The trend information is based on MACD, Stochastic, Moving Average, and RSI MetaTrader indicators. So, forex traders can use them in any technical trading strategy to BUY and SELL based on the arrow signals. The indicator works well for new and advanced forex traders. It’s available as a free download and is easy to install.
FREE

This is the countdown of the last candle Indicator. How much time remains in the current candle of your chart CTime display exactly how many hours, minutes and seconds remain before the current candle closes, and a new one opens. This allows you to be on the ball as soon as the next candle appears It could be useful for a trader who trades with candles as the main attention Available option to change the text color to suit the chart background. This Indicator is related to the system here .
FREE

Current Pips and Money Profit This indicator displays the results of the currently open position on the graph. Result in pips and in the invoice currency. Thanks to this, you can enlarge the chart to the entire screen and have control over the result of trading without opening a terminal window which takes a space of a screen. The display positions of this data can be adjusted at the user's discretion and colors also.
FREE

BOROT Assistant : Trading Assistant for Manual Traders
Description:
The Trading Assistant is a user-friendly tool designed for manual traders to improve their trading performance and enhance their decision-making process. It offers a comprehensive range of features that help traders effectively manage risk and reward, execute orders, and identify potential trading opportunities. The Assistant's key features include:
Risk and Reward Box : Clients can easily draw a risk and reward box on their
FREE

The Starting Points indicator for MetaTrader 4 is a technical analysis tool that shows the monthly, weekly, and daily starting points, as well as the 1000-point and 500-point levels, in the forex market. The indicator is displayed as a series of horizontal lines that represent the starting points and levels. Benefits of Using the Starting Points Indicator Identify potential trend changes: The Starting Points indicator can help traders identify potential trend changes by highlighting areas wher
FREE

For backtest use tickstory with fixed timeshift like gmt +0 without DST option activated, set current_broker_gmt parameter to the gmt of your backtest time shift. My Tickstory time shift setup
For demo, put on EURUSD H1 chart set current_broker_gmt parameter to the current broker gmt shift. Simple and safe , no grid, no hedge, no martingale and Stoploss is always set. You could expect 1 trade by day. Low spread broker (0.1pips) reccomended, better on ECN account Paid Version
What's new: 1) Imp
FREE

The e-FastCHF EA is developed for GBPCHF. The EA has no trading limitations only on GBPCHF. 16.01.2015. The Swiss National Bank decided not to support the EUR/CHF course on the level of (1.20). Now it is pegged not to EUR but to USD. Our strategy is based on this fact. Tests have been performed from 02.01.2015. Timeframe – М15 Currency pair – GBPCHF No Martingale Calculation of lot basing on the balance (risk per trade). Supporting ECN accounts. This option operates as follows: first a position
FREE

MAS Indicator can be used in all currency pairs and at any timeframe, it is suitable for any trading speed. In addition, it's relatively easy to trade with the MAS Indicator. This indicator produces two signals: BUY Signal: arrow deep sky blue SELL Signal: arrow red
Indicator parameters MA Method – type of moving average MA Shift – shift moving average Fast - fast period moving average Slow – slow period moving average RSI – value rsi Confirm – value confirm Flat – value flat Colors - colors of
FREE

The indicator informs when the current bar closes and a new bar opens. TIME is an important element of trading systems. BarTimerPro indicator helps you CONTROL THE TIME . Easy to use: place on the chart and set “alarms” if it necessary. In the tester, the indicator does not work. Key Features
Shows the time elapsed since the opening of the current bar Indicator Updates Every Second Setting the appearance (31-36) and the location (21-24) of the indicator, changing all texts (41-50). 4 types of “
FREE

This Program will not execute any trades!
Works on any chart and any time frame!
This is the MT4 version.
MT5 version: https://www.mql5.com/en/market/product/125600?source=Site+Market+My+Products+Page
This Program will produce a comment box at the top left of the chart and show you your equity % difference throughout the day. Updating constantly in real time.
The daily resets back to zero on open of a new market open day. Using new current equity at start of day as reference for future calc
FREE

O Chart Control é um indicador que permite de forma rapida e pratica alterar o timeframe e ativo do grafico, possibilitando que voce possa fazer todas as suas analises em apenas um grafico sem precisar abrir vários, além disso voce pode escolher o entre os temas claro e escuro para o qual melhor se adapta a sua preferencia.
MT5: https://www.mql5.com/pt/market/product/109444
FREE
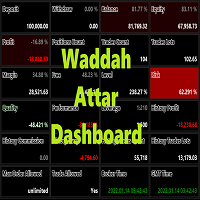
Waddah Attar Dashboard
Simple App show you the most important information about your account , trades and history . Risk , Quality and Performance are the most important numbers you must watch them carefully . also the important thing you must do is Focus on the RED Color on the board . you can control the font name , font size , width , height and padding properties . the information is auto arranged on the chart . don't worry about it .
Thanks .
recommended product for position risk manage
FREE
Your feedback is valuable and appreciated.
I appreciate feedback on where the application is weak and what improvements or features would be beneficial.
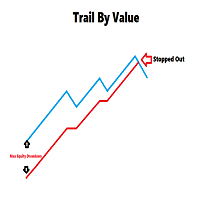
This is a utility for setting trailing stops by value. Trailing stops are great tools for locking in profits as a trade progresses. When trades progress towards potential targets confidence in the trade should be reflected in management of the trade. Market exposure persists for the duration of the trade, and the choice to remain in a trade is
FREE

After 7 years I decided to release some of my own indicators and EAs for free.
If you find them useful please Show support with a 5-star rating! Your feedback keeps the free tools coming! See other my free tools as well here
_________________________________ Intraday Intensity Index (III) for Precision Forex Trading The Intraday Intensity Index, meticulously developed in MQL4, is a cutting-edge tool designed for enhancing forex trading analysis. This indicator offers a deep di
FREE
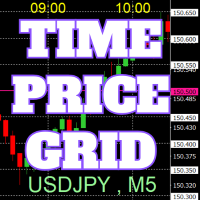
Sur le graphique, des grilles de prix et de temps sont dessinées pour faciliter la référence aux nombres ronds.
Depuis "Entrée des Paramètres", il est possible de configurer des intervalles de prix pour chaque période. Les lignes de la grille pour les nombres significatifs (nombres ronds) sont plus épaisses et plus visibles que les autres lignes, les rendant facilement reconnaissables. La grille pour les nombres significatifs (nombres ronds) peut être configurée avec une couleur différente des
FREE
Le MetaTrader Market offre un lieu pratique et sécurisé pour acheter des applications pour la plateforme MetaTrader. Téléchargez des versions démo gratuites de Expert Advisors et des indicateurs directement depuis votre terminal pour les tester dans le testeur de stratégie.
Testez les applications dans différents modes pour surveiller les performances et effectuez un paiement pour le produit que vous souhaitez en utilisant le système de paiement MQL5.community.
Vous manquez des opportunités de trading :
- Applications de trading gratuites
- Plus de 8 000 signaux à copier
- Actualités économiques pour explorer les marchés financiers
Inscription
Se connecter
Si vous n'avez pas de compte, veuillez vous inscrire
Autorisez l'utilisation de cookies pour vous connecter au site Web MQL5.com.
Veuillez activer les paramètres nécessaires dans votre navigateur, sinon vous ne pourrez pas vous connecter.