RSI Momentum and PIP average Indicator

MQL5 Indicateurs

Tâche terminée

Temps d'exécution 28 jours

Spécifications

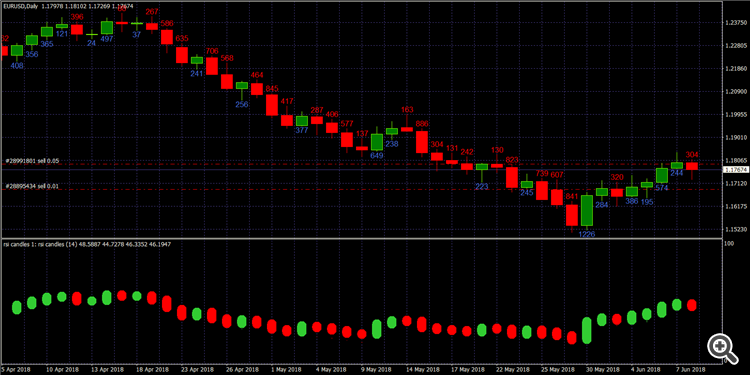
Hello, I am looking to have an indicator designed that can take the pip count for a candlestick and divide it buy the count of the RSI candle stick. Below is an screen shot of the attached  indicators. You can see that the pip count is already calculated, even tho i wold like mines to also include the candle stick wicks in the pip count also. 

The bottom is an RSI Candle indicator. I would like the count of each candle for that as well just like the pip count. So for example if the fixed min and maximum is 0 and 100 for the RSI inputs, lets say the last red RSI candle started at 55 and is now at 46.The value of that candle is 9(55-46=9). On the flip side the Green RSI Candle right nest to the last lets say started at 45 and went up to 55. The value of that candle would be -10(45-55=-10) 

So what our indicator will do is develop a bar chart that will display the average of the pip count / rsi count. Using the example RSI numbers above the last pip count on the chart is 304. So we will take the 304/9=33.7 and the pip count next to last is 244/-10=-24.4. So the 33.7 and the -24.4 will be the figures used to create out bar chart indicator. 

Both of the attached indicators below allow you to select the number of candles you want to display information for. i would like to get data line above or below our custom bar chart that displays the average of the BAR CHART figures (please convert the negative numbers into positive numbers just for this average).

So for example, if I used the value of 2 for both the Pip count indicator and the RSI candle indicator we would have the number from above on our bar chart to calculate. To get the average would be calculated as: ( next to last bar chart number(converted Positive) 24.4 + the last bar chart number 33.7) / Number of imputed candles to display information for which is 2 for this example, gives us (24.4+33.7)/2=29.05. So the line item on our custom indicator would display that the "Average RSI" is 29.05 or 29 if we don't select to use decimals.

Sample 1 


So to sum it all up: This RSI Momentum Indicator will do as follow:

1. Display the number of pips in each candle plus the wick unlike the attached indicator does.

2. display the RSI as candles with the positive or negative count displayed above and below like the pip count figures.  

3. Display our custom "Bar Chart" with the Pip count and RSI averages.( will have positive and negative number.

4. Display somewhere on the chart the average of the "Bar Chart" figures from indicator 3 above, converting all negative number to positive before doing the average.


Inputs:

RSI common fixed minimum: default = 0

RSI common fixed maximum: default = 100

Include all the inputs from the Attached RSI Candle indicator

For the "MT7_bodyPointsIN" indicator attached, input "Max Look Back Bars" can be combined with the "Bars To Calculate" input from the "RSI Candle" indicator attached.

Our custom Bar Chart inputs can just be color preference for positive and negative values.

Decimal space input: default 0 


If you have any questions please feel free to let me know. If you can think of any cool inputs or features I might be missing please advise.


Look forward to working with you.


DaJuan
Dossiers :

Répondu

1
Développeur 1
Évaluation
(8)
Projets
11
18%
Arbitrage
0
En retard
1
9%
Gratuit
2
Développeur 2
Évaluation
(135)
Projets
193
42%
Arbitrage
17
29% / 59%
En retard
28
15%
Gratuit
3
Développeur 3
Évaluation
(16)
Projets
21
19%
Arbitrage
7
0% / 71%
En retard
14
67%
Gratuit
4
Développeur 4
Évaluation
(66)
Projets
95
28%
Arbitrage
20
25% / 55%
En retard
24
25%
Gratuit
Commandes similaires
I have a mt5 indicator that is working perfectly but I will like to make it an expert advisor to have an automated trade. I will be glad if I can get a well experienced developer to execute this project. Thanks
O TRABALHO CONSISTE NA MUDANÇA DO HISTOGRAMA DO INDICADOR TREDN DIRECTION AND FORCE DSEMA SMOOTHED PARA O HISTOGRAMA DA FOTO ANEXA, OBEDECENDO AS TRES CORES VERDE (UP, VERMELHOR(DOWN) E CINZA(TREND). O MESMO TEM QUE ODECER O MESMO CALCULO E COLORIR DA MESMA FORMA POREM COM HISTOGRAMA DDE FORMATO DIFERENTE
If you are knowledgeable in hedging strategy we can chat. I created my simple EA using Fxdreema , so you only need to modify it for me. There are two parts of the EA , 1. Is the execution strategy 2. Is the money management strategy (hedging). I already created number 1 which is the execution of trades , I only need someone who can implement hedging in every orders the EA create. Additional Parameters needed. Trade
We are interested in a TradingView indicator that reads candlestick pattern shapes and shows the location of entry and exit points on a candlestick chart. What services do you provide related to this
Hello Im looking for professional trading developer who htf ready made trading with best and working strategy with low risk level with average of 30 to 60 percent profit margin, broker is not problem, any broker is welcomed and any trading pairs are welcomed as well
the sl doesnt work i want the tp logic to remain i need the trend direction fucntion tow ork i the trend is up then only buys if down only sells i need the fibo nacci fucntion to work as well and the flat zone function to work as well and i need the code to trade 1% of the balance //+------------------------------------------------------------------+ //| US500_EA.mq4 | //|
Connect from Mt4 via binary derive account api. I have a bot. You need to convert the bot to an indicator. After converting I need to connect with my binary deriv through api. I want to trade my derivative binary account through mt4. If anyone can setup via API then contact me
Moving average cross strategy that has no stop but will just reverse direction each time the crossover happens. But will have a 3 step profit taking method at certain percentage points. It will be used for futures options on the buy side. 3 days out
Reposting: I have posted this add earlier and had worked with Developer initially in trial mode. I was wondering if that developer is still available as I want buy this code from him with some modifications which I need. Hello - I am looking for some thing like this. 1- Moving Average MA value as line on Chart with label. i.e. 5min, 50, Exponential ( Labels should be selectable, Hide / Unhide, or display on Right /
My EA calls recent and live Polygon tick data, stores it locally and then displays it on the chart. I need someone who can modify the EA so that it can use information from TickDataSuite or any other tick repository instead of polygon so it can be used while backtesting. More information about the EA can be given. Price is negotiable if you have a backlog of completed orders and good reviews

Informations sur le projet

Budget
30+ USD
Pour le développeur
27 USD