Voir comment commander un robot de trading
Lisez les Règles avant de passer une commande ou de l'exécuter
Comment commander un robot de trading dans MQL5 et MQL4
Voir un exemple de spécification des exigences pour commander un robot
Nouvelles commandes dans la catégorie:
40+ USD
30 - 100 USD
30 - 50 USD
50 - 80 USD
50 - 100 USD
100+ USD
30 - 50 USD
Spécifications
Key Features....
.................................
*We Want TWO VERSIONS.
1. for Forex Tester 2 (.dll) file... and please note that this version doesn't have to have any data windows or, bells and whistle.. JUST AUTOMATICALLY TRADING THE STRATEGY... no vertical lines or, the other special things like the MT4 (.ex4) Version.
2. for MT4/MQL4 Language (.ex4) file BUT BUT BUT TWO VERSIONS ARE NOT REQUIRED, but, it would be nice, if you can do it, OK
*No Stop Loss
*Starting lot size .01
*Target/Take Profit(TP) 50 pips
* We want to Draw a GREEN LINE for BUY STOP or, SELL STOP by placing the GREEN LINE Above or Below the Current Price/Candle.... If Placed Above Price, BUY STOP. If Placed Below Price, SELL STOP.
*Takes the Best Trending 2 Pairs, out of 15 Pairs (All 15 Pairs/Charts must be open)
Aud/Usd Aud/Jpy Eur/Usd Eur/Jpy Eur/Gbp Gbp/Usd Gbp/Jpy Cad/Jpy Nzd/Usd Nzd/Jpy Usd/Cad Usd/Chf Usd/Jpy Xau/Usd Xag/Usd
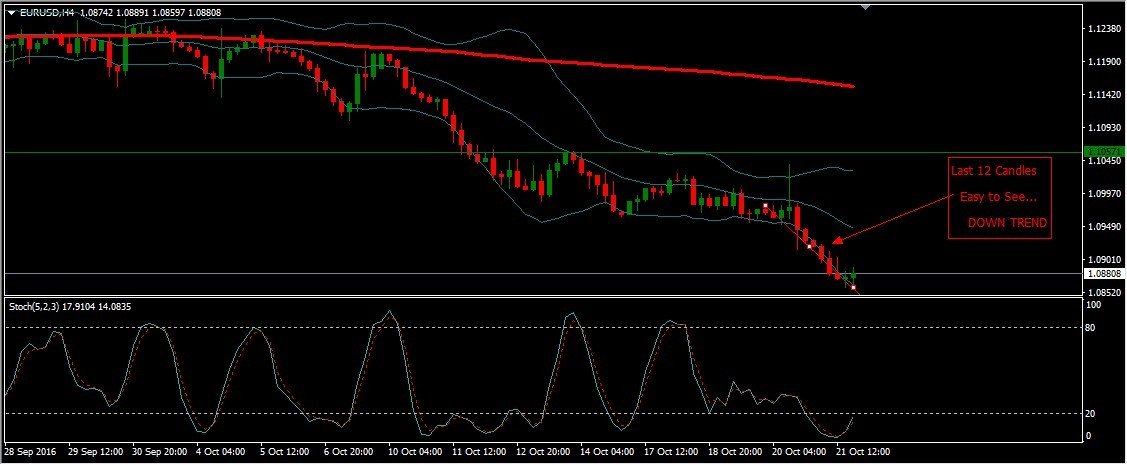
*How does it Calculate the Trend?... Answer: (Counts the last 12 Candles for each TimeFrame)... Is it UP, or DOWN Direction, based on the last 12 Candles, for each Timeframe?
*How does it Calculate which Two Pairs to Choose out of the 15 Pairs?... The Pairs with the Most Green (UPs) or, Red (DOWNs)
*If there is a Tie... Choose the Pair with the Most Pips, according to the last 3, 4 Hour Candles.
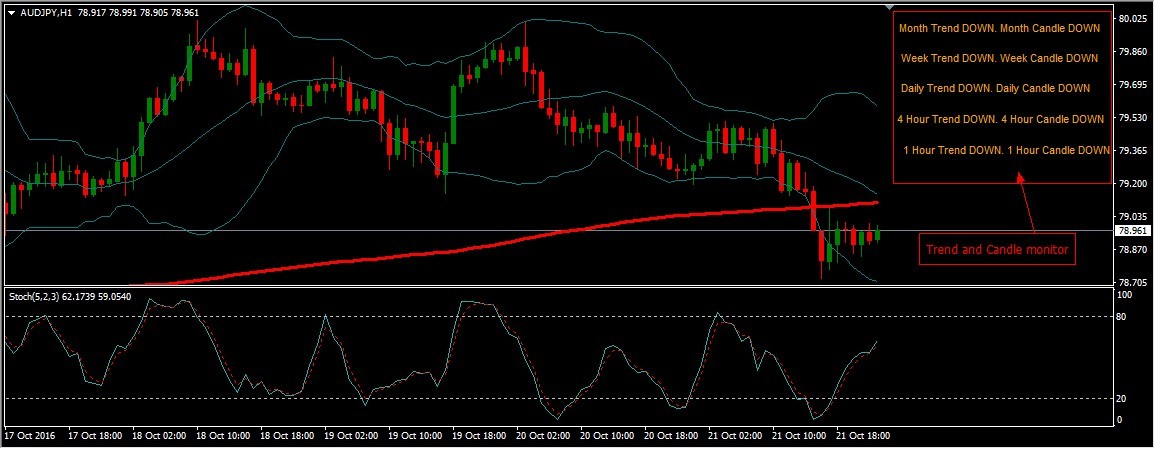
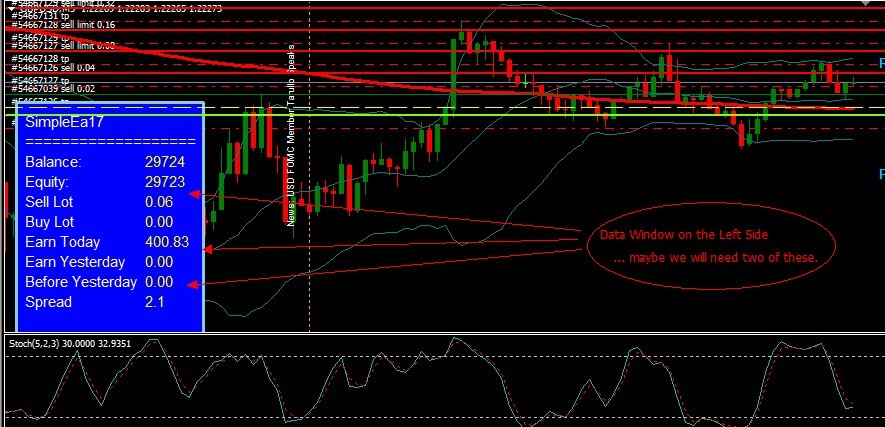
*An Example of the Information we want on the LEFT side of each chart, in 2 Data Window, for All 15 Pairs, that we trade:
AUD/USD
| CANDLES >> H1 (Arrow) H4 (Arrow) D1 (Arrow) W1 (Arrow) MN (Arrow)
| TREND >> H1 (Arrow) H4 (Arrow) D1 (Arrow) W1 (Arrow) MN (Arrow)
AUD/JPY
| CANDLES >> H1 (Arrow) H4 (Arrow) D1 (Arrow) W1 (Arrow) MN (Arrow)
| TREND >> H1 (Arrow) H4 (Arrow) D1 (Arrow) W1 (Arrow) MN (Arrow)
EUR/JPY
| CANDLES >> H1 (Arrow) H4 (Arrow) D1 (Arrow) W1 (Arrow) MN (Arrow)
| TREND >> H1 (Arrow) H4 (Arrow) D1 (Arrow) W1 (Arrow) MN (Arrow)
EUR/USD
| CANDLES >> H1 (Arrow) H4 (Arrow) D1 (Arrow) W1 (Arrow) MN (Arrow)
| TREND >> H1 (Arrow) H4 (Arrow) D1 (Arrow) W1 (Arrow) MN (Arrow)
EUR/GBP
| CANDLES >> H1 (Arrow) H4 (Arrow) D1 (Arrow) W1 (Arrow) MN (Arrow)
| TREND >> H1 (Arrow) H4 (Arrow) D1 (Arrow) W1 (Arrow) MN (Arrow)
GBP/USD
| CANDLES >> H1 (Arrow) H4 (Arrow) D1 (Arrow) W1 (Arrow) MN (Arrow)
| TREND >> H1 (Arrow) H4 (Arrow) D1 (Arrow) W1 (Arrow) MN (Arrow)
GBP/JPY
| CANDLES >> H1 (Arrow) H4 (Arrow) D1 (Arrow) W1 (Arrow) MN (Arrow)
| TREND >> H1 (Arrow) H4 (Arrow) D1 (Arrow) W1 (Arrow) MN (Arrow)
CAD/JPY
| CANDLES >> H1 (Arrow) H4 (Arrow) D1 (Arrow) W1 (Arrow) MN (Arrow)
| TREND >> H1 (Arrow) H4 (Arrow) D1 (Arrow) W1 (Arrow) MN (Arrow)
NZD/USD
| CANDLES >> H1 (Arrow) H4 (Arrow) D1 (Arrow) W1 (Arrow) MN (Arrow)
| TREND >> H1 (Arrow) H4 (Arrow) D1 (Arrow) W1 (Arrow) MN (Arrow)
NZD/JPY
| CANDLES >> H1 (Arrow) H4 (Arrow) D1 (Arrow) W1 (Arrow) MN (Arrow)
| TREND >> H1 (Arrow) H4 (Arrow) D1 (Arrow) W1 (Arrow) MN (Arrow)
USD/CAD
| CANDLES >> H1 (Arrow) H4 (Arrow) D1 (Arrow) W1 (Arrow) MN (Arrow)
| TREND >> H1 (Arrow) H4 (Arrow) D1 (Arrow) W1 (Arrow) MN (Arrow)
USD/CHF
| CANDLES >> H1 (Arrow) H4 (Arrow) D1 (Arrow) W1 (Arrow) MN (Arrow)
| TREND >> H1 (Arrow) H4 (Arrow) D1 (Arrow) W1 (Arrow) MN (Arrow)
USD/JPY
| CANDLES >> H1 (Arrow) H4 (Arrow) D1 (Arrow) W1 (Arrow) MN (Arrow)
| TREND >> H1 (Arrow) H4 (Arrow) D1 (Arrow) W1 (Arrow) MN (Arrow)
XAU/USD
| CANDLES >> H1 (Arrow) H4 (Arrow) D1 (Arrow) W1 (Arrow) MN (Arrow)
| TREND >> H1 (Arrow) H4 (Arrow) D1 (Arrow) W1 (Arrow) MN (Arrow)
XAG/USD
| CANDLES >> H1 (Arrow) H4 (Arrow) D1 (Arrow) W1 (Arrow) MN (Arrow)
| TREND >> H1 (Arrow) H4 (Arrow) D1 (Arrow) W1 (Arrow) MN (Arrow)
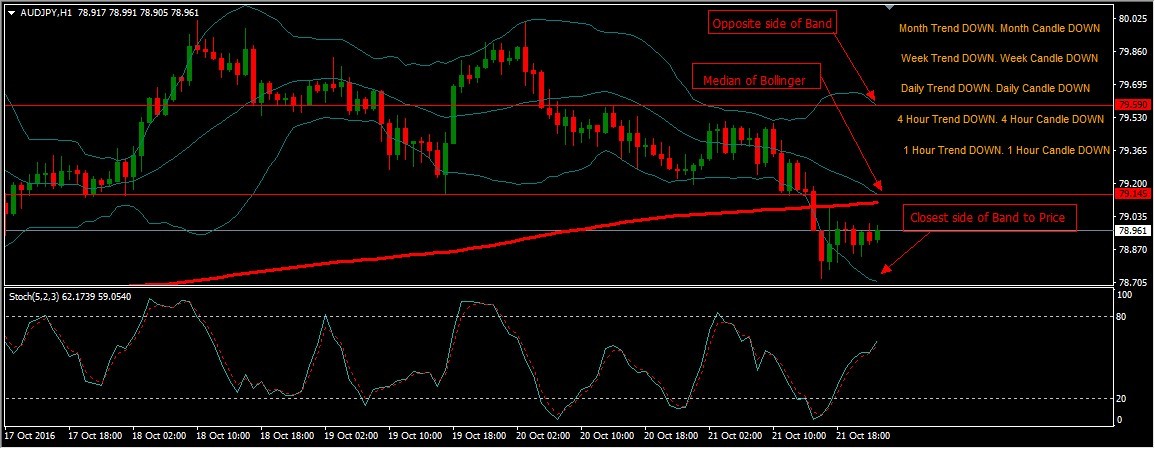
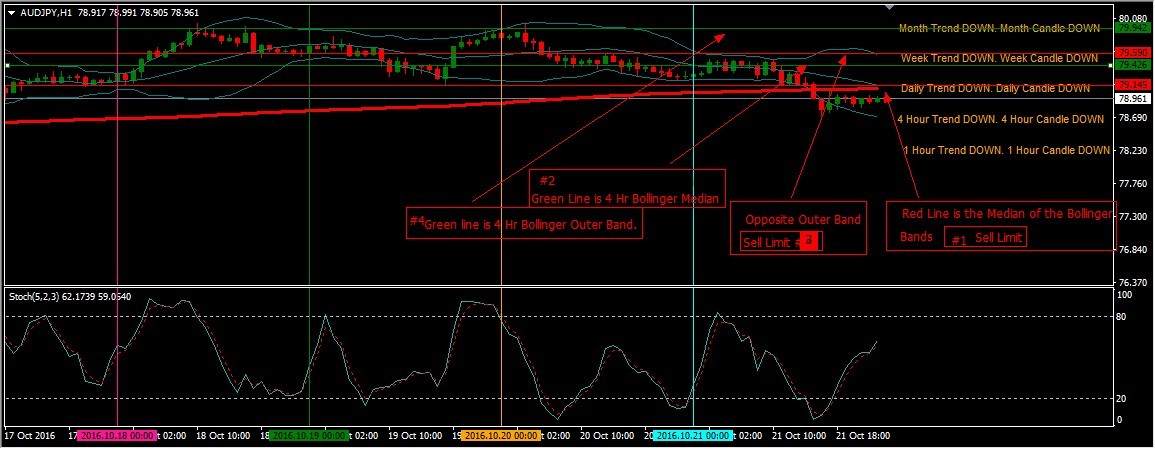
*Gets into more positions when price retraces, at certain points, also known as the Price Pull-Backs. OK First...
1st Position, is according to trend of the BEST TWO TRENDING CHARTS/PAIRS(Just Gets in once Calculated, going the direction of the Trend... with Option in Settings to get in after first Pull-back). 2nd Position, when it pulls back to the Middle of the Bollinger Median Point.
For Example... [See Attachment]
Then, Opposite Side of the Bollinger Band, from where you ENTERED a Position, According to the 1 HR. & 4HR. Charts, Median and Opposite Band(Furthest Band) Points. (We call Pull Backs, High Fives).
For Example... [See Attachment]
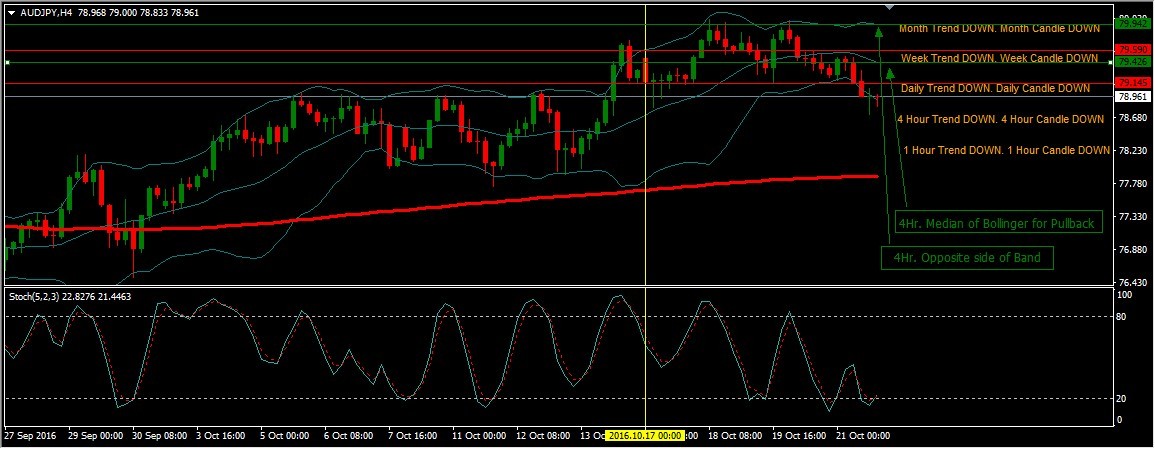
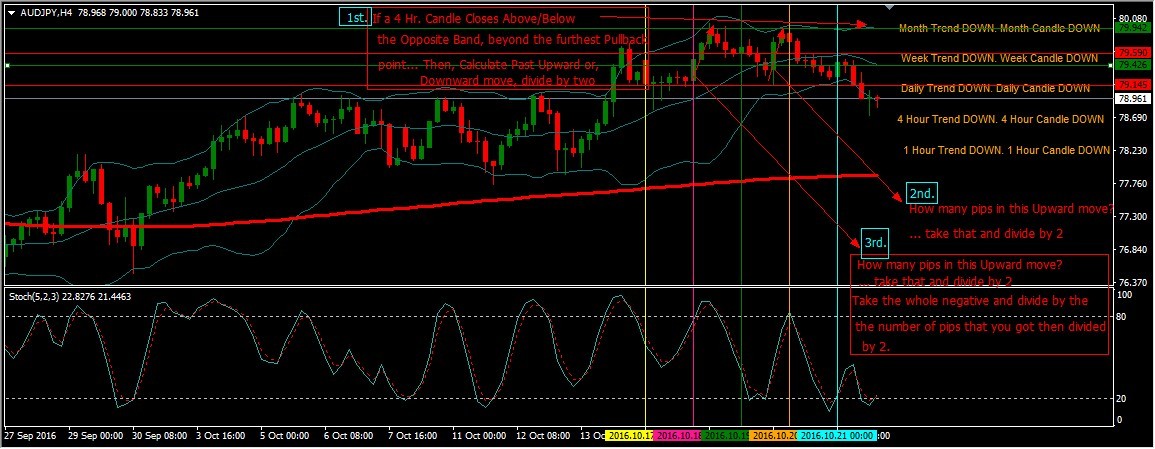
*We Will look to go the Opposite Direction ONLY After.... Price Closes Above or, Below the Opposite Point of Entry, Furthest Pullback Point, with both 1 hour and 4 hour Median ond Opposite Band Points, from where we 'started from/entered from'.
&, we need the EA to calculate how many pips the 4 Hour Candles last Move Upward or Downward was.
For Example... [See Attachment]... Please also consider position of 200 MA for 5 minute chart... Did the price cross-over 200 MA?... A sign to really look to go the opposite way.(we want the OPTION)
Also,
*Calculation Example... 0.01 in 4 negative positions... Lets say those 4 Negative Positions are: -$3.00 + -5.00 + -$8.00 + -$11.00 = -$27+ $50 Profit = $77 Goal.
80pips last Upward move / 2 = 40 pips... So, $77 / 40 = $1.93 a LOT. (.19) or, you can round up to (.20) lot size... Then, if the Price Stops going up and Goes against us again, for some strange reason after another 4 Pullback points, then the opposite way with now be (.20 LOT X 4 positions negative... example -$50, -$100, -$150,- $200) = $-500 + 200 profit = $700... 80 pips last Downward move / 2 = 40 pips... So, $700 Goal /40 pips = 17.5 a LOT (1.75 LOT size) or, you can round up to (1.8 LOT size)
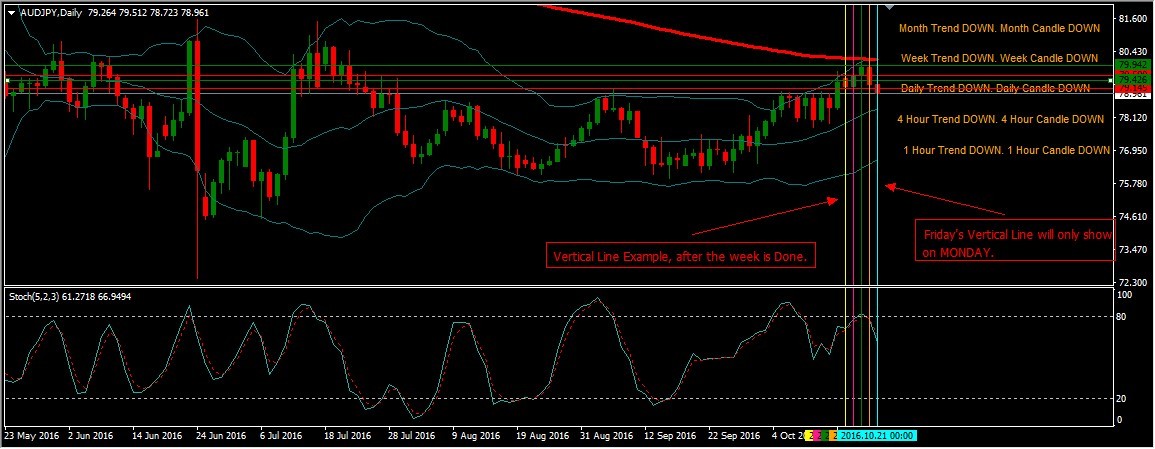
*We want Vertical lines to be drawn for Only the Current Week Only(5 days (M-F) after each day has closed/finished).
We want Monday(Yellow) Tuesday(Pink) Wednesday(Green) Thursday(Gold) Friday(Sky Blue & Friday only showed on Mondays)For Example....
*Horizontal Lines for the Closing and Opening of EACH DAILY CANDLE for the CURRENT WEEK ONLY.
For Example....
*On the Right Side of the Chart, Where it is empty after pushing (button)
We want Every Chart/Pair to Show(the BELOW) on the Right Side of the Chart:
Month Trend DOWN/UP - Month Candle DOWN/UP side note:(8 size font) (DOWN in Red) (UP in Green)
Week Trend DOWN/UP - Week Candle DOWN/UP side note:(8 size font) (DOWN in Red) (UP in Green)
Day Trend DOWN/UP Day - Candle DOWN/UP side note: (8 size font) (DOWN in Red) (UP in Green)
4 Hr. Trend DOWN/UP - 4 Hr. Candle DOWN/UP side note: (8 size font) (DOWN in Red) (UP in Green)
1 Hr. Trend DOWN/UP - 1 Hr. Candle DOWN/UP side note: (8 size font) (DOWN in Red) (UP in Green)
Also, Other Details Underneath like:
2 BEST TRENDING PAIRS/Charts(Currently)
Balance
Equity
Total Sell Lots
Total Buy Lots
Earned Today
Earned Yesterday
Before Yesterday
Spread (in pips, NOT POINTS)
Commandes similaires
Daily Bias Candle trading
60+ USD
I would like an EA that follows exactly this steps to trade de daily candle. Watch the video and then see if you can do the task. https://www.youtube.com/watch?v=g3oDYq4P9ZE Document is one this link https://cdn.discordapp.com/attachments/1135977927469703230/1135978751461695598/Daily_Bias-TTrades_edu.pdf?ex=669a9a27& ;is=669948a7&hm=96de195f7e695a381c1261b065f67b94fae319d02a0c88641b146f8b2978320c& Should have
I have a custom EA that works fine in the live market trading, but when doing a back test in the strategy tester , it does not open sell orders. There are no errors or warnings; it just doesn't open sell orders. I've checked every possible reason that might be the reason why it does not open sell orders, but I can't find anything, especially since it works fine in the real market and it opens both buys and sells
MT5 EA (Private)
30+ USD
The Expert Advisor would use two built-in indicators as entry/exit signals and our own risk management strategy with customizable inputs. The goal is to create a reliable and efficient trading tool that can automate our trading process on the MT5 platform
COPY AN IDICATOR TO MT5
30+ USD
Hi, I have an indicator from my friend, I want to copy it to my own MT5 can you do that for me. Here is the link
I installed the E.A. into the Experts folder in MT4. When I double click on it nothing happens. When I right click and "attach to chart" nothing happens. The E.A. is not grayed out, it simply will not attach. Any help would be greatly Appreciated
Modify MQL5 EA for some new logics
30 - 100 USD
I have an EA and want to add few new logic to fetch profit taking factors and other values from an external master data and use it in existing EA
Profitable Expert Advisor
100 - 200 USD
Hello Every one, Good day, I want from someone professional to create an EA is working on Mt5, This EA is working by depend on some indicators, and all those indicators must be working on MACD window, not on the chart, for more details please read my attached pdf file carefully. Many Thanks
I'm looking for an expert MQL5 developer that can create an EA that's based on my price action trading strategy with no indicators. The EA must analyze trades based on my price action rules, enter trades based on my price action rules, manage trades based on my price action rules and exit trades based on my price action rules
hi hi there i have an strategy on tradingview and i want to automate it like metatrader EA so i want the strategy to open and close trade automaticlly on tradingview
Expert Advisor Developer for MT5
30 - 100 USD
We are looking for an experienced Expert Advisor Developer who can build a customized MT5 Expert Advisor for us. The Expert Advisor would use two built-in indicators as entry/exit signals and our own risk management strategy with customizable inputs. The goal is to create a reliable and efficient trading tool that can automate our trading process on the MT5 platform. Skills required: - Strong understanding of
Informations sur le projet
Budget
200 USD
Pour le développeur
180
- 180
USD
Délais
de 14 à 21 jour(s)