Spécifications
I wanted indicator for Meta trader 5:
I need an indicator that plots trend lines. These lines should identify possible tops and bottoms following my reasoning below.
Very important: This indicator needs a 4 parameter input for me to test at different ranges, for example, the zig zag indicator, if you increase or decrease the depth it shows different results
In my case it will be in relation to points and candle intervals
These inputs will be:
Ranges
Line alignment
Line extension deadline
Graphical record history of at least 30 days, looking at the M15 period
Simplified Logic:
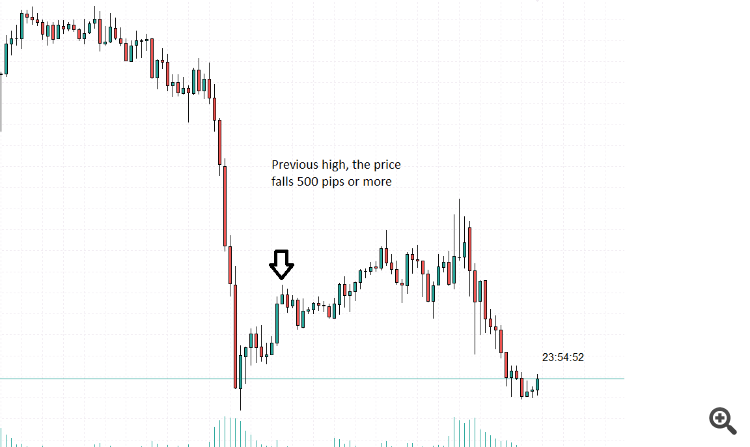
Identification of the First Top:
The price needs to fall at least 600 points from a previous high, in a range of at least 3 candles.
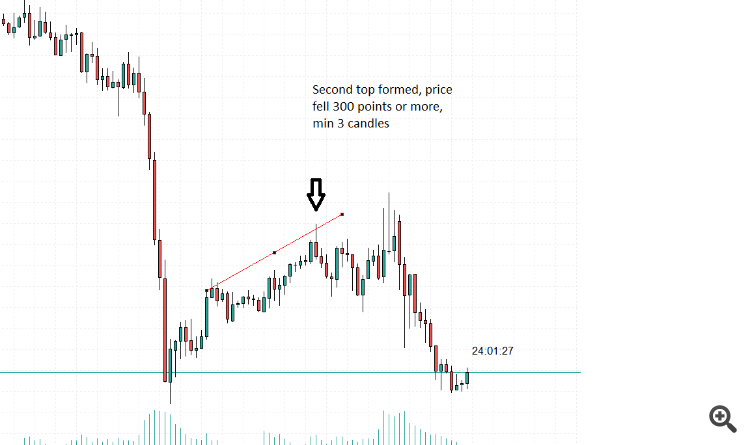
Identification of the Second Top:
The price needs to surpass the previous high by at least 100 points.
Afterwards, it must fall by at least 400 points in a range of at least 3 candles.
Line Drawing:
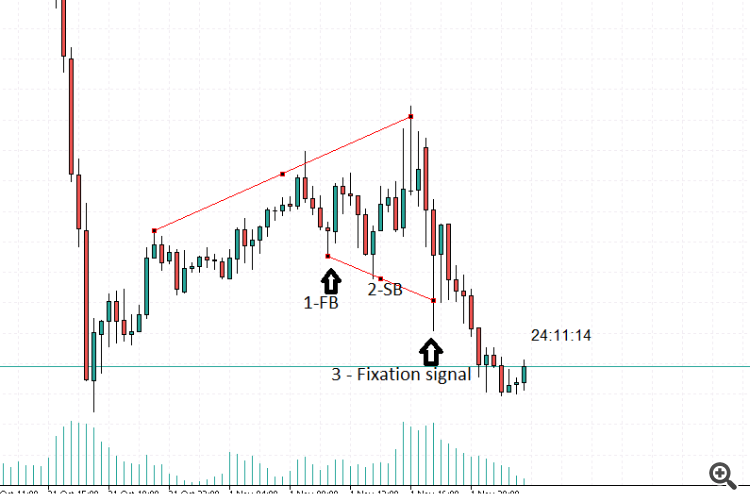
Draw a line connecting the highs of the two tops.
Extend the line by 3 candles ahead in the future.
Line Fixation:
When the price or candle touches the line, the line needs to be shortened by 5 seconds at the same point it touched, it cannot move or recalculate

In this same image we can already identify another inverse formation which will also be requested:
the inclination should be like this < most of the time. See the prints to better understand what it should look like
Very important: I will need an input that moves the lines uniformly in relation to the lows and highs, example: If I want to leave the line aligned exactly with the lows or highs I leave this configured in the input, as well as if I If you want to leave a difference in points, for example 10 points, it should be like this image:
Very important: input to limit line extension, after the second top or bottom is formed, the line will extend 3 candles ahead of the future, this line must expire within a period of number of candles.


