Voir comment commander un robot de trading
Lisez les Règles avant de passer une commande ou de l'exécuter
Comment commander un robot de trading dans MQL5 et MQL4
Voir un exemple de spécification des exigences pour commander un robot
Nouvelles commandes dans la catégorie:
30+ USD
50 - 80 USD
50+ USD
30+ USD
30 - 85 USD
Spécifications
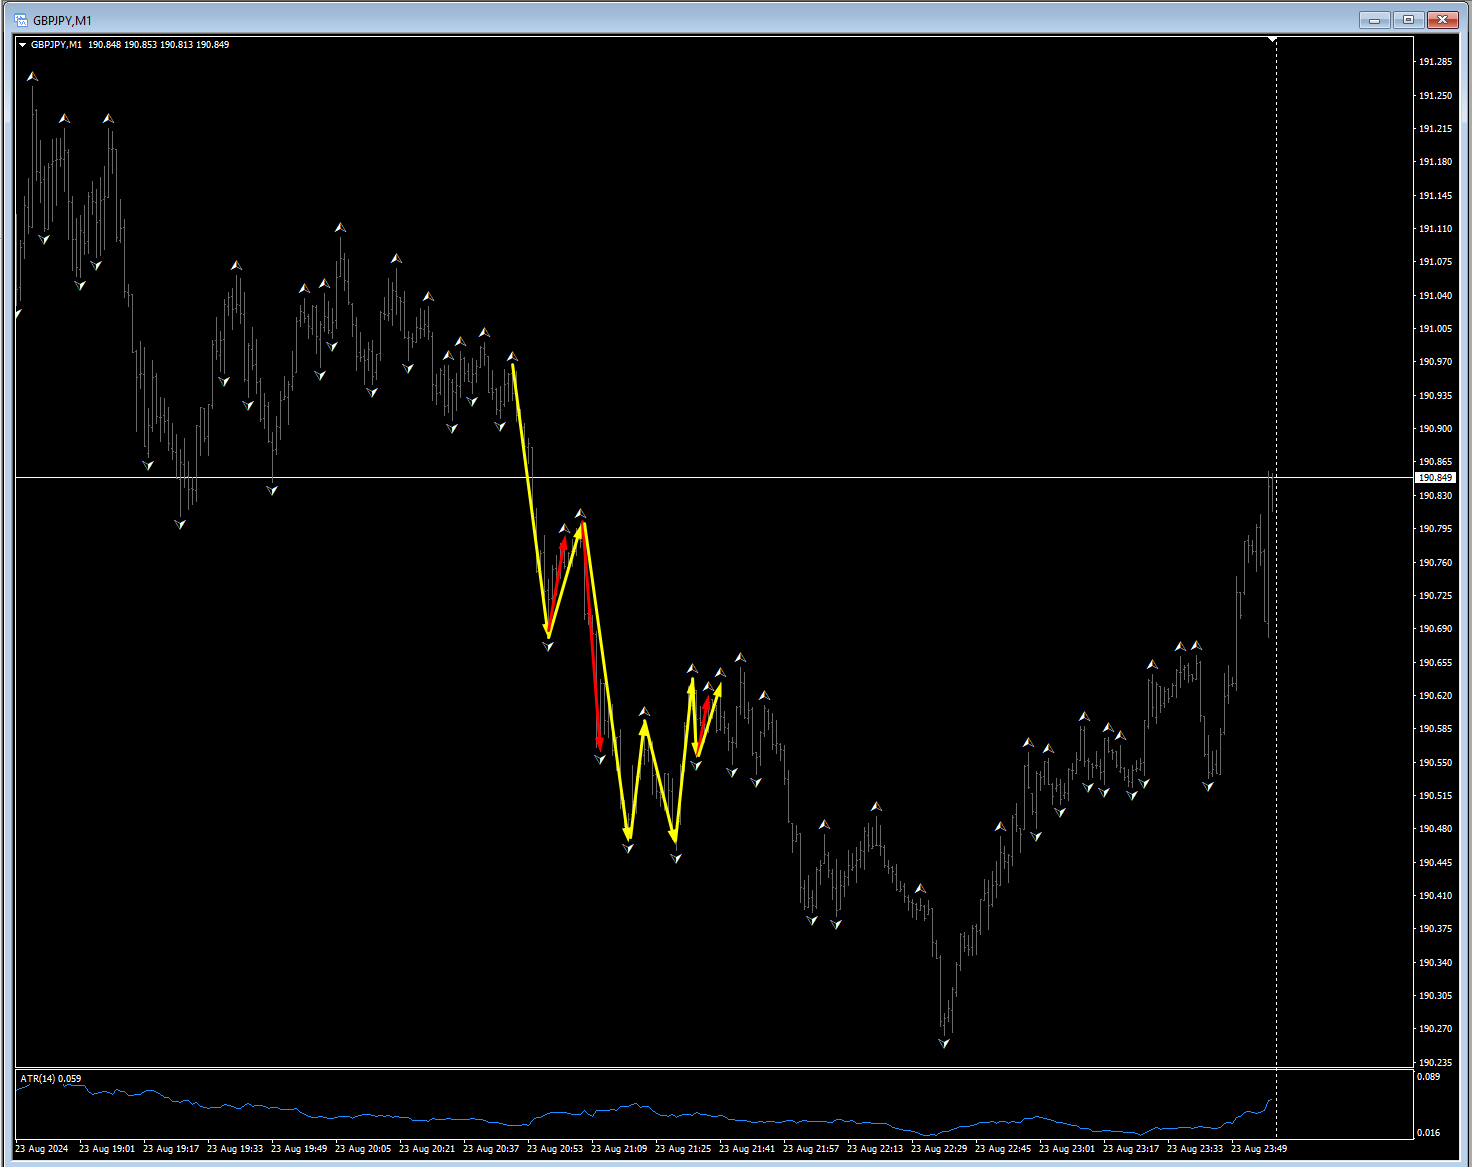
I need an indicator that shows me data similar to an ATR, but instead of the range of candlesticks for the previous n period, it shows me the range of the fractal highs to the fractal lows to the fractal highs and so on.
In the image attached below, starting from the first yellow arrow on the left, it goes to the next fractal low. This is one fractal period. Then from that fractal low, it goes to the next fractal high. This would update the average on the indicator. But instead of there being another fractal low, there's a new fractal high. So the information gets updated by changing the range of that fractal period to the next fractal high.
By default I want to see the period of previous 14 fractal ranges.
I hope I explained that well.
Répondu
1
Évaluation
Projets
11
36%
Arbitrage
4
25%
/
25%
En retard
1
9%
Travail
2
Évaluation
Projets
228
58%
Arbitrage
3
100%
/
0%
En retard
47
21%
Travail
3
Évaluation
Projets
0
0%
Arbitrage
0
En retard
0
Gratuit
4
Évaluation
Projets
444
64%
Arbitrage
5
40%
/
0%
En retard
4
1%
Gratuit
5
Évaluation
Projets
0
0%
Arbitrage
0
En retard
0
Gratuit
6
Évaluation
Projets
65
6%
Arbitrage
26
19%
/
35%
En retard
4
6%
Chargé
7
Évaluation
Projets
102
38%
Arbitrage
0
En retard
3
3%
Travail
8
Évaluation
Projets
431
34%
Arbitrage
54
37%
/
39%
En retard
157
36%
Chargé
Commandes similaires
i want a robot and an indicator that uses macd..bolingerbands And emas As well as fibonacci retracement confirmation from SMC strategy , OB+CHoCH And RTO i want it to print SL and TP using High and Lows
2 indicators
30+ USD
Need 2 visual indicators. Visual examples under attachment. A) indicator shows a price on horizontal trendline and hides it from the price bar. 1)option to configure font size and trendline color; 2)option to choose trendline style; 3)option to choose on what timeframe/s trend lines will appear. B) indicator allows to represent a certain time period on a different background. 1)option to choose on what timeframe it
Hello! I want to convert an existing open source indicator for tradingview to mql5. Its an orderblock indicator also showing horizontal bullish/bearish volume. My expectation of this is the following: The orderblocks will apear on the chart at exactly the same place with top/bottom etc. The bullish and bearish volume is somehow displayed/indicated. (The values of the orderblocks are retrieveable to develop an EA in
Hi, Thanks for looking at my requirement. Here are the details of the job and right now, we do have 2 jobs to do in same file. The clear detailed explanation along with the pictures are in the google drive link : https://drive.google.com/drive/folders/14KMGzunkE-Hbg0eK6iUrs4DNvRetTJYc?usp=sharing Also, i am into this coding thing for more than 2 years now full time. I am a math guy and not a coder. So the
I need telegram EA
30+ USD
Hello, I need an expert that can help me to develop an EA. That can also work while I open trade on phone, can I get this done? I need video demo and work sample. Thanks
Convert Tradingview indicator Pine Script to MQL4 language ( indicator/EA) Hi , I need a script written for Auto trading bot to trade on Trading View. This is a simple strategy to trade Renko chart on Trading view. The trading bot will have rules for entry and exit. Stop loss and Take Profit. order size by x% of equity. Daily profit target in pips. I want an experienced Trading View Pine script coder please! Thanks
We have an existing EA which use specific strategy based on our propriety Indicator(Semaphores) and Stochastic. The EA is multi symbol and Multi timeframe. we need to fix it for following issues 1 - Check the Status on close of the Candle[1] or open of the Candle[0] 2 - open order with SL which meet specific requirement 3 - Amend order for TP when specific requirement meet. 4 - Update the Scanner as in the picture. 5
Sierrachart
60 - 100 USD
Hi everyone, I have a request for Sierra chart. I already have a number template and I want to know is it a way for you to make adjustments so that 3 vertical numbers that decrease or increase are highlighted
CPI ROBOKING
30+ USD
*Strategy: CPI-Based Trading* *Instruments:* XAUUSD (Gold), UsTech100 (Nasdaq 100), USDJPY *CPI Release:* 1. *Higher-than-expected CPI:* - XAUUSD: SELL (Gold prices may drop due to potential rate hike) - UsTech100: SELL (Tech stocks may drop due to potential rate hike) - USDJPY: BUY (USD may strengthen due to potential rate hike) 2. *Meets or lower-than-expected CPI:* - XAUUSD: BUY (Gold prices may rise due
TradingView Indicator adding labels 2 indicator
50 - 150 USD
Hey, I’m needing someone to add statistics to an indicator in Trading View. I already have the indicator coded on Pinescript which is a Zig Zag Indicator, however I need someone to calculate statistics of the Zig Zag over a regular hour trading session including the mean, mode, deviation, etc.. with labels of those statistics in the indicator, I will provide all of the math and details, and a picture of how it should
Informations sur le projet
Budget
80+ USD
Client
Commandes passées22
Nombre d'arbitrages0