Spécifications
The only purpose of this script will be to find initial settings for an existing EA, which uses different candlestick patterns as signals to enter the market. It has to give information about candle size and spread.
This script has to run in the tester (preferably only the tester) on any time frame, mostly the M1, M5, M15 chart, but also any other time frame and correctly extract the information about the candle characteristics and display them in an aggregated form in the Backtest window.
If it is not possible to modify the backtest window in this way, an alternative solution has to be provided.
What is meant by aggregated result is the following:
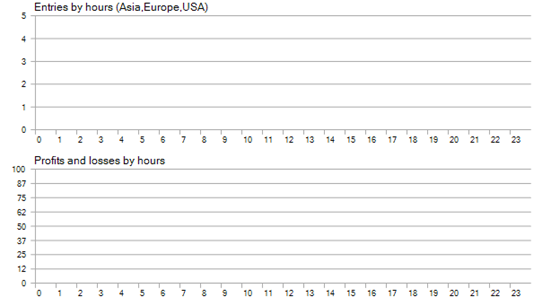
Like this functionality of the backtest window, I want that the average characteristics of the candlestick formations are displayed for every hour of the day (in points and %). This does not have to look like the graphs below. Preferably, it is in the form of a table.
This is just an example of what is meant by “aggregated results”.
Preferably, the script will also be able to aggregate the results by a custom time period, which is not necessarily one hour.
As already mentioned, this script has the only purpose to help finding initial settings for an existing EA.
One functionality of this EA is that for a selected number of bullish / bearish candles in a row + a corresponding selectable price movement a buy / sell signal is generated.
This is what a part of the input menu of this EA looks like:
The main thing I want from this script, is that it will count and display how many candlestick formations with consecutive bullish/bearish candles occur within an hour of the selected time period and the Average size of candlestick patterns in points and % is displayed. Candle number from 1 to 59.
Selected time period is whatever is chosen in the tester here:
![]()
Preferably the script provides the functionality to only look at a specific time period.
This can be achieved while collecting data or later, where the data is displayed in the backtest window. The latter is preferred.
(However, this is how it could look like, when the data collection of the script is limited via the input menu in the tester:
Possibility to choose multiple time periods in hours (the script only looks at included time period)
Include hours → ON / OFF
From:
To:
(4x the same input)
Possibility to exclude multiple time periods in hours (the script ignores excluded time periods)
Exclude hours → ON / OFF
From:
To:
(4x the same input)
Here is a list of things the script should collect information about and display aggregated results for the selected time period.
1. Amount of Consecutive positive, negative candles + Average size of candlestick formation in points and %
How Average size of candlestick formation could be calculated. If there is a more efficient way to calculate is that would be even better.
Bullish candlestick formation:
- points: (Close prize last candle of formation – Open prize first candle in formation) x 100
- %: (Close prize last candle of formation – Open prize first candle in formation) / Open prize first candle in formation x 100
Bearish candlestick formation:
- points: Open prize first candle of formation – Close prize last candle in formation x 100
- %: (Open prize first candle of formation – Close prize last candle in formation) / Open prize first candle of formation x 100
In the following there will be an example how this aggregated information could look like. This is just an example. This example is only for one hour of the day. As mentioned before all hours of the day have to be displayed.
(See this again:
 )
)
Preferably it is also possible to have the script display custom time intervals. How the results are displayed has to be discussed with the developer.
Example of what is meant by amount + size of candlestick formations
10 a.m – 11:am
Bullish candles:
- candle number 1: 15; 28p
- candle number 2: 8; 39p
- candle number 3: 4; 51p
- candle number 4: 1; 58p
- candle number 5: 0
Bearish candles:
- candle number 1: 18; 21p
- candle number 2: 5; 13p
etc.
2. Average maximum for bullish formations, Average minimum for bearish formations in points and %.
Maximum / Minimum includes the wick / shadow of the candle, while average size only included the candle body.
How maximum / minimum could be calculated.
Bullish candlestick patterns:
points: highest price in formation - open prize first candle of formation
%: (highest price in formation - open prize first candle of formation) / open prize first candle of formation x 100
Bearish candlestick patterns:
points: Open prize first candle of formation – highest price in formation
%: (Open prize first candle of formation – highest price in formation) / open prize first candle of formation x 100
Example
10 a.m – 11:am
Bullish candles:
- candle number 1: 15; 28p, maximum: 38p etc.
- candle number 2: 8; 39p
- candle number 3: 4; 51p
- candle number 4: 1; 58p
- candle number 5: 0
Bearish candles:
- candle number 1: 18; 21p, minimum: 31p etc.
- candle number 2: 5; 13p
etc.
3. Average spread in points and %
The spread is calculated at the beginning of each new candle and divided by 60 to get an average for every hour.
spread in points: ask – bid
spread in % = (ask – bid) / ask * 100
The requirement specifications for this task are only a draft and are to be completed with suggestions of the developer how to achieve the outlined task.
The task for the developer does not only include the writing of the code, but also to think about of how to realize the task, which again, is only outlined in the requirement specifications.
Therefore the developer needs to completely understand the task.
It is in the interest of the developer to ask all the questions which are not clear beforehand.
To solve the task, it is necessary for the developer to communicate his strategy and understanding before the coding can begin.
Additional payment based on the work required to complete the task is negotiable as long as the desired result will be achieved.
At the end the source code is required.
Troubleshooting has to be provided by the developer in case of errors which are detected only after the payment is completed.
Developers which are interested in a long term cooperation are preferred.