Dashboard based on Fibonacci and Candlestick Pattern

Spécifications

Need one MT5 Dashboard that can display and generate Alerts based on Fibonacci and Candlestick Patterns on Higher and Lower timeframe combination. Need its source code also.

The alert setting should have below options, Similarly there should be true false option to be set for each higher and lower timeframe to turn them on and Off for checking on Major or Minor Timeframes, Atleast 1 Major Timeframe and 1 Minor Timeframe is Mandatory to select, Default will be 4 Hour for Major Timeframe and  30 Minutes for Lower timeframe.


Bullish Buy Scenario on Pullback

------------------------------------------

First Identify the Trend using the Higher timeframe like 1 Week, 1 day and 4 Hour Candles(is current candle above or below previous candle of same timeframe, also look at the moving average like 200,100,50,20 etc. on various timeframes with respect to current price) and then at various fib levels wait for a pullback till either 61.8% or 78.6%,  and then wait for a Bullish candles on lower timeframe like 1 hour, 30 minutes, 15 minutes, 5 minutes  etc.  then Show Buy alert when the candle closes. The list of Bullish Candles to be scanned should be configurable like Hammer, Dragon Fly Doji, Bullish Engulfing, Morning Star, Tweezer Bottom, Bullish Marabozu, Inverted Hammer, etc. The Body or wick of this candle should touch the Fibonacci % line and its closing price should be above the Fibonacci Percentage line. 

Need a dashboard which can show in a table for all symbols present in the marketwatch if this criteria is met or not, if met it should show the Date and timing when this condition first became true in User timezone (Default will be IST timezone (India time)). Then when we click on that symbol the chart should open for that symbol for that particular timeframe and that candle should be highlighted where the condition became true. 

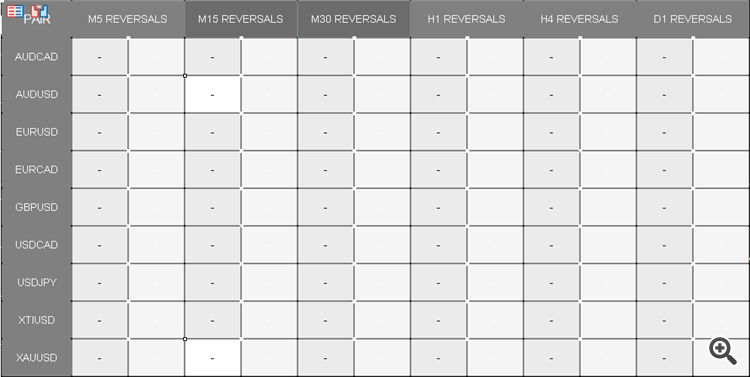
Dashboard will show Symbol, which higher timeframe is Bullish, what is Fib percent where the candle has been created and the timeframe of that candle which is of a lower timeframe. Also there should be a column in the Dashboard that says if High/Low of this candle is broken or not by its next candle if yes it will show High broken at IST timestamp. When a new candle pattern is generated on same fib line then show both records but show recent record on top and old record below that. Put option to sort and filter on any symbol/pair and timeframe and recent date timestamp etc. Dashboard Table will look something like this. the Font size we should be able to reduce or increase and the text should be automatically wrapped, like WORD WRAP will be ON always. When Symbols are extra and cannot fit on one screen show a scroll bar for horizontal and vertical scrolling, if scrolling is not possible show pagination with next and previous buttons. The Dashboard can be applied on top of any chart on any timeframe but it will scan for this pattern on all timeframes and all symbols present in the Marketwatch of MT5. 


Répondu

1
Développeur 1
Évaluation
(243)
Projets
431
34%
Arbitrage
54
37% / 39%
En retard
157
36%
Travail
2
Développeur 2
Évaluation
(47)
Projets
69
45%
Arbitrage
3
0% / 100%
En retard
0
Chargé
3
Développeur 3
Évaluation
(568)
Projets
641
41%
Arbitrage
21
57% / 29%
En retard
47
7%
Travail
4
Développeur 4
Évaluation
(9)
Projets
4
0%
Arbitrage
11
0% / 82%
En retard
0
Gratuit
5
Développeur 5
Évaluation
(40)
Projets
76
39%
Arbitrage
0
En retard
0
Travail
Commandes similaires
Lihle's trades 30+ USD
``` //+------------------------------------------------------------------+ //| Hello World Expert Advisor | //| | //| This is a basic EA that buys and sells based on a simple | //| moving average crossover strategy. | //+------------------------------------------------------------------+ #property version "0.01" #property strict input int FastMA
Hello, i need a robot for gold trading being able to determine a trend or instant changes on a micro scale so its just going to scalp very fast but, for example lets say we have an equity of 500 bucks it needs to take profit at 5 and open a new position and just continiue going like that all day, but i also want it to determine buying opportunities based off of a very wide range of candlestick data of gold the day
i want a robot and an indicator that uses macd..bolingerbands And emas As well as fibonacci retracement confirmation from SMC strategy , OB+CHoCH And RTO i want it to print SL and TP using High and Lows
Hello, I need an expert that can help me to develop an EA. That can also work while I open trade on phone, can I get this done? I need video demo and work sample. Thanks
We have an existing EA which use specific strategy based on our propriety Indicator(Semaphores) and Stochastic. The EA is multi symbol and Multi timeframe. we need to fix it for following issues 1 - Check the Status on close of the Candle[1] or open of the Candle[0] 2 - open order with SL which meet specific requirement 3 - Amend order for TP when specific requirement meet. 4 - Update the Scanner as in the picture. 5
I want to create an EA MT5 that can 1. identify support and resistance (based on close candles) 2. mark snr breakout 3. multitimeframe breakout scanner 4. scan the valid setup that appears 5. available for manual marking, INFO SPREAD & TIME NEXT BAR 6. sends alert notification to Telegram I need a professional and experienced developer with fast and good work according to what I want. if you are interested I will
Hi, I have an scalping Expert Advisor for XAUUSD pair with Break Out strategy using iADX indicator and it seems other indicators too. Need a help to do reverse engineering on it. Thanks
I would like to create a bot based purely on the below fundamentals; Timeframe from 5M to 1Month. The bot will place a trade via a candlestick pattern and supply and demand zone approach, (NO RSI, Bollinger bands, or the like to be taken into account) just purely candlesticks based off the candlestick bible, buy and sell. Once a trade is made, the bot will continue to make trades in that position’s direction (locked
Dear Digital Intellectual, I’ll generally outline my idea with the intended instruments and their logic. Fundamental bias with multiple factors . I have this outside of MT. It's very easy to activate or deactivate the EA on MT if the fundamentals are not in line to be bullish or bearish. Later on, APIs would be needed to fully automate this (not yet needed). Logic : Fundamental factors on a higher timeframe drive the
CPI ROBOKING 30+ USD
*Strategy: CPI-Based Trading* *Instruments:* XAUUSD (Gold), UsTech100 (Nasdaq 100), USDJPY *CPI Release:* 1. *Higher-than-expected CPI:* - XAUUSD: SELL (Gold prices may drop due to potential rate hike) - UsTech100: SELL (Tech stocks may drop due to potential rate hike) - USDJPY: BUY (USD may strengthen due to potential rate hike) 2. *Meets or lower-than-expected CPI:* - XAUUSD: BUY (Gold prices may rise due

Informations sur le projet

Budget
30+ USD
Pour le développeur
27 USD
Délais
de 5 à 7 jour(s)