Tâche terminée
Spécifications
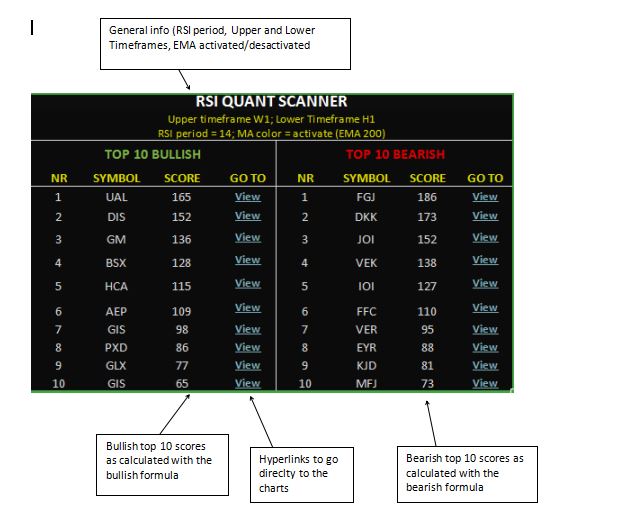
RSI QUANT SCANNER
GENERAL INFO
l It is for metatrader 5
l It is a scanner to rank top 10 bullish opportunities and top 10 bearish opportinities.
l It must to scann among all symbols available in my broker´s account ( including forex, CF D shares, indices, commodities,...)
l I need both the ex5 file as well as the open code (mql5)
l It has to be possible to setup all the parameters of the indicators
l It has to scann into two timeframes for every symbol: One will be the Upper Timeframe and the other will be the Lower Timeframe (It must have the possibility for selecting both Upper and Lower timeframes)
INDICATORS
It has t wo indicators:
l RSI: The cla s sical oscillator everyone knows.
l Color moving average (indicator attached) : It is a moving average indicator that change color depending on the slope of the trend. Bullish trend has one color and bearish trend has another color. This will be only a filter, and the scanner must have the possibility to activate or desactivate it.
Of course, asd I said before, it must be possible to play with the setups of these two indicators.
SCANNING TOP 10 BULLISH OPPORTUNITIES: BULLISH FORMULA
The scanner must make a rank with all the symbols available in the platform, to look for the top 10 bullish opportunities. It must be based on the next formula:
l SCORE FOR THE SYMBOL = RSI value in Upper Timeframe + (100-RSI value in Lower Timeframe)
For example, let´s take we have selected H4 as the Upper Timeframe and M15 as the lower Timeframe. Let´s consider the current RSI in H4 for a certain symbol is 62 and RSI in M15 for the same symbol is 28 . So, the SCORE for this symbol is:
SCORE = 62 + (100-28) = 62 + 72 = 134
So, the scanner must apply the same formula for all the symbols available in the platform and then make a ranking, showing the TOP TEN HIGHIEST SCORES. These are the top ten bullish opportunities.
SCANNING TOP 10 BEARISH OPPORTUNITIES: BEARISH FORMULA
The scanner must also make another rank of all the symbols available in the platform, to look for the top 10 bullish opportunities. It must be based on the next formula:
l SCORE FOR THE SYMBOL = (100-RSI value in Upper Timeframe) + RSI value in Lower Timeframe
For example, let´s take we have selected H4 as the Upper Timeframe and M15 as the lower Timeframe. Let´s consider the current RSI in H4 for a certain symbol is 38 and RSI in M15 for the same symbol is 63 . So, the SCORE for this symbol is:
SCORE = (100-38)+63 = 62+63 = 125
So, the scanner must apply the same formula for all the symbols available in the platform and then make a ranking, showing the TOP TEN HIGHIEST SCORES. These are the top ten bearish opportunities.
MA COLOR AS FILTER
The scanner must have the possibility to activate or desactivate a filter, based on MA COLOR indicator. The MA color indicator must be applied as a filter for the Upper Timeframe Chart.
When you activate the filter, the scanner must rank the top 10 bullish opportunities only found among those symbols with EMA 200 showing a positive slope in the Upper Timeframe defined. Likewise, the scanner must rank the top 10 bearish opportunities only among those symbols with EMA 200 showing a negative slope in the Upper timeframe defined.
SCANNER DISPLAY
The scanner display must show both the top 10 bullish opportunities and the top 10 bearish opportunities, after making the calculations for all the symbols available in the broker list , considering the selected timeframes (upper and lower timeframes).
It also must have the possibility to change colors and also to choose position on the screen (top left, top right, bottom left or bottom right).
It must scann all the available symbols in my broker´s list. It must have the possibility to choose timeframes (upper and lower) to scann ( M1, M5, M15, H1, H4, D1, W1 , Monthly ) .
It must have hyperlinks to go directly to the charts (as shown below).
The display must look like it appears in the attached document