Rejoignez notre page de fans
- Vues:
- 44928
- Note:
- Publié:
- 2006.10.16 10:23
- Mise à jour:
- 2014.04.21 14:54
-
Besoin d'un robot ou d'un indicateur basé sur ce code ? Commandez-le sur Freelance Aller sur Freelance
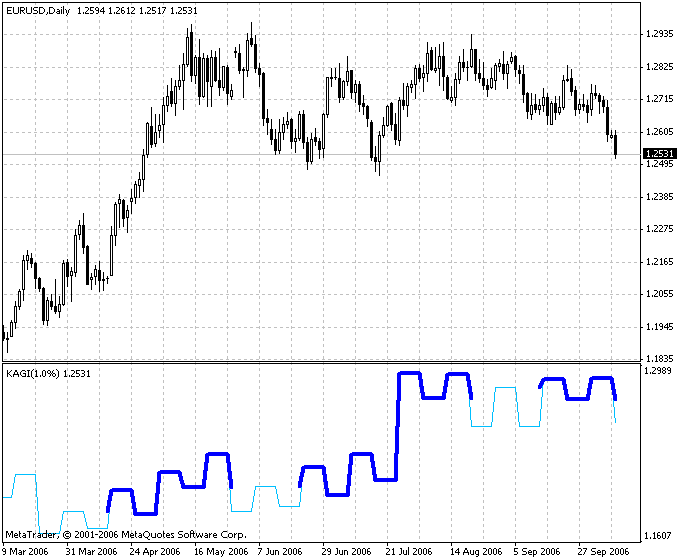
The Kagi Charts are supposed to appear in 70s of the 20th century, at the first stage of Japanese stock market development. The Kagi Charts represent a series of interconnected vertical lines. The thickness and increment direction of these lines are determined by the price dynamics. The Kagi Charts do not consider the time.
If price move on in the same direction, the vertical line in the chart becomes longer. If the price turns by a pre-defined value (reverse coefficient), a new vertical line in a new column will be drawn in the chart. The thickness of Kagi lines changes when prices exceed their previous maximum/minimum values.
The Kagi Charts became known in the USA due to Steve Nison's book named "Beyond Candlesticks".
The Kagi Charts illustrate how demand-and-supply forces act. A sequence of thick lines speaks for that the demand is above supply (the market grows).
A sequence of thin lines means that the supply is above demand (the market drops). Interchange of thick and thin lines speaks for that the market is balanced (supply is equal to demand).
The basic trade signal on a Kagi chart is the line thickness: If a thin line becomes thick, you should buy, if vice versa, you should sell.
A sequence of increasing maximums and minimums speaks for the power of the ascending movement, decreasing maximums and minimums speak for the weak market.
Parameters
Porog - reversing coefficient in percents

 CloseOnChart
Quickly close open orders by dragging and dropping this expert on chart. Will ask for confirmation to close each order within 2 pips of the drop.
 JK BullP AutoTrader
The Expert Adviser JK_BullP_AutoTrader is built on Bulls Power indicator.
 Renko Charts
The Renko charting method is thought to have acquired its name from "renga" which is the Japanese word for bricks.
 Three Line Break
Three Line Break - a raw of vertical rectangle, the height of which is determined by the value of price changes.