Rejoignez notre page de fans
- Vues:
- 13490
- Note:
- Publié:
- 2010.03.26 10:08
- Mise à jour:
- 2016.11.22 07:32
-
Besoin d'un robot ou d'un indicateur basé sur ce code ? Commandez-le sur Freelance Aller sur Freelance
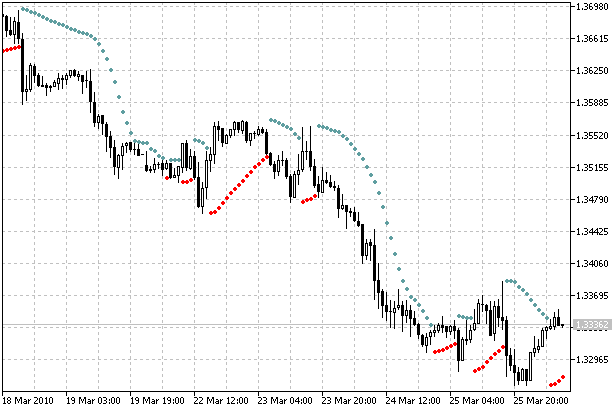
Added colors to Parabolic SAR.
Parabolic SAR Technical Indicator was developed for analyzing the trending markets. The indicator is constructed on the price chart. This indicator is similar to Moving Average with the only difference that Parabolic SAR moves with higher acceleration and may change its position in terms of the price. The indicator is below the prices on the bull market (Up Trend), when it’s bearish (Down Trend), it is above the prices.
If the price crosses Parabolic SAR lines, the indicator turns, and its further values are situated on the other side of the price. When such an indicator turn does take place, the maximum or the minimum price for the previous period would serve as the starting point. When the indicator makes a turn, it gives a signal of the trend end (correction stage or flat), or of its turn.

Traduit du russe par MetaQuotes Ltd.
Code original : https://www.mql5.com/ru/code/90
 Up and Down Indicator
This indicator allows to see the activity of the market.
 DemoBufferPattern
To demo buffer-pattern: Candles + Fractals + ZigzagColor + ColorMaLine.
 WoodiesCCI
Indicator for Woodie’s CCI trading strategy.
 AdoSuite v 1.0
Classes for working with databases through ODBC and OLE DB interfaces