Rejoignez notre page de fans
- Vues:
- 27492
- Note:
- Publié:
- 2008.04.26 10:23
- Mise à jour:
- 2016.11.22 07:32
-
Besoin d'un robot ou d'un indicateur basé sur ce code ? Commandez-le sur Freelance Aller sur Freelance
Author: ug

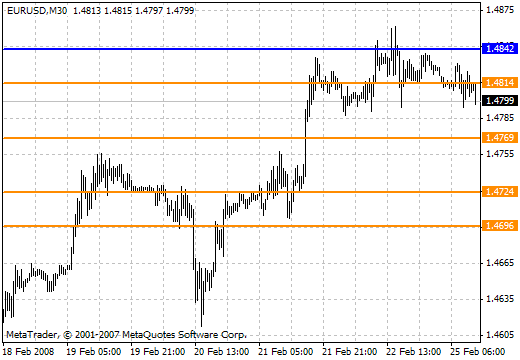
The indicator uses the construction method described by Vladislav Antonov (you can see his session reviews at Viak or Alpari). I failed to find such an indicator in the internet, so I decided to create it by myself. Below is a short extract from his description:
I shouldn't explain you what support and resistance are. There are many methods to detect price levels. However, I apply my own calculations. The dynamic support/resistance lines are determined by MA lines, whereas the static ones are calculated on the basis of a larger timeframe.
1. To calculate intraday levels for one hour, you should take High, Low and Close values from the preceding one-hour candlestick.
2. To calculate intraday levels for one day, you should take High, Low and Close values from the preceding one-day candlestick.
3. To calculate intraday levels for one week, you should take High, Low and Close values from the preceding one-week candlestick.
In my review, I calculate the price levels of support/resistance on the basis of the one-day candlestick of the preceding day. Thus, the price levels will be valid all day long, but we should recalculate them the next day. For example, if we take a one-day candlestick 02.11.06: High = 1.2786 Low = 1.2736 Close = 1.2780 and obtain the levels for the current day and use them on all charts for the timeframes smaller than one-day timeframe. On the next day, we will have to calculate the new levels.
There are 3 calculation methods according to the size of the preceding candlestick:
Reduced – support/resistance levels for a weak market. If the market was closed with a large candlestick of more than 200 points, it is better to use this method, since a correction is expected, so the market will be flat.
Normal – support/resistance levels for a market with average volatility. Daily candlesticks range from 100 to
200 points. Normal method is good in use when a stable growth or sinking is being observed, candlesticks being approximately of the same size.
Extended (Расширенный) – support/resistance levels for a volatile market. Црут the market shrinks into a triangle and becomes flat, we expect a strong movement to start soon and use the levels with an expanded price range. What method should be applied here, this depends on your own research and level statistics collected. As to me, I don't keep up with the items described above (this is averagely for the pound). So far, I choose methods guided by my intuition and by the expected price pattern.
For those who want to read about this in more details, see: http://www.viac.ru/ds/21950
Traduit du russe par MetaQuotes Ltd.
Code original : https://www.mql5.com/ru/code/7905
 RZI
RZI
An indicator for viewing turning shapes.
 buy_sell
A trend-following indicator. It's simple as a coign.
 Filter over WPR
Indicator Filter over WPR. It is based on indicator Stochastic.
 T3MA
T3MA
I'm waiting for your opinions.