Rejoignez notre page de fans
- Vues:
- 9753
- Note:
- Publié:
- 2024.02.16 04:24
- Mise à jour:
- 2024.02.19 10:48
-
Besoin d'un robot ou d'un indicateur basé sur ce code ? Commandez-le sur Freelance Aller sur Freelance
Historical Levels are prices over life time of a symbol which technically believed as most repeated prices. From financial point of view, these prices are important limits of economical conditions of a financial environment which is shadowed over dedicated symbol chart. There are scientific materials shows these levels has linkage to financial limits/phases which price/rate can not easily pass those levels unless financial phase changes for considered symbol. These are strong reasons that a trader has to empower their market analyses with Historical Levels.
I tried to create a structural view on these levels from candle formation analyses point of view. Price/rate behavior over these levels most probably has strong effect on candle shape. As an example, if there is a strong level for a price, we should have a PRICE JUMP because of high amount of money sleeping on that price/rate or its around.
Considering this concept, two rules are developed:
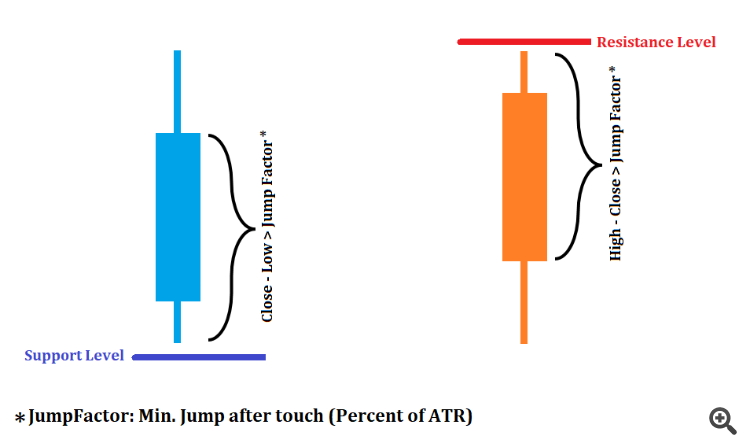
- Rule 1(bull candle on sup. level): if close - low > Jump Factor
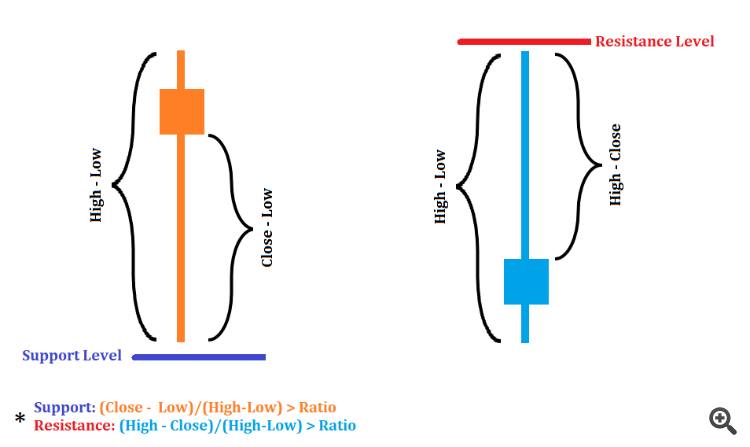
- Rule 2(bull candle on res. level): if close - low > Jump Factor & (close-low)/(high-low)>ratio
To make rules more clear two images are prepared.
Image1: jumping from S/R levels with same action (like bull candle on support)
Image 2: jumping from S/R levels but in reverse (like Bull candle under resistance)
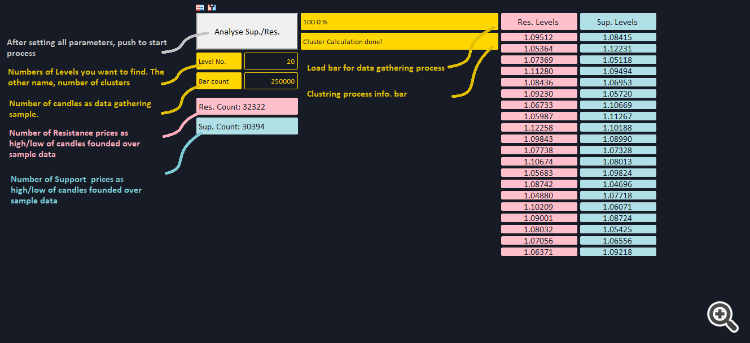
Based on these rules (rules are selectable) an indicator developed which gathers data in two different matrix (sup_mat and res_mat). Number of S/R levels obeying selected rules are shown on screen during gathering data. Hense, AlgLib(dataanalysis.mqh) library used to make a clustering process over gathered data through K-means method. Results illustrated as columns of Support and Resistance Levels data.
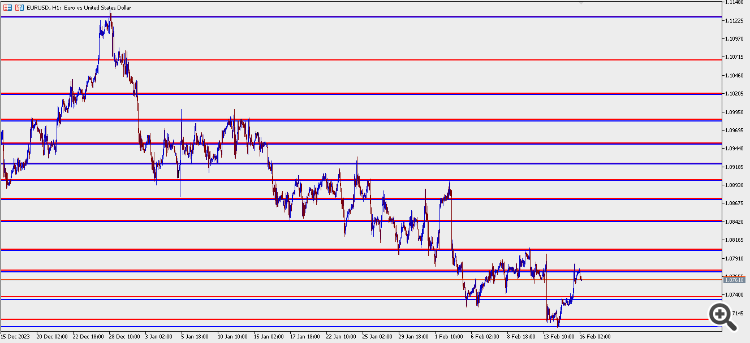
After enhancing levels, its open a chart with same symbol analysed and then draws all levels(clusters) over that chart according clustering process. Some parameters of indicator can be changed from screen to make it more user-friendly. Here is a brief illustration od screen graphics of tool and its results.
Image 3: indicator screen
Image 4: auto drawing of results of Levels on chart
As conclusion, tool is very powerful even if we have to very basic rules and levels are showing strong support and resistance behavior. Adding more rules is possible and code is in an easy mode to make more rules to enhance it. Adding to extra rules, dividing clustering areas and make more dedicated clustering for those areas, searching for max distance taken before retouching levels can be further improvements for tool. Anyone who like to have more, please contact me.
 Indices Testing
The EA only trades buy positions and does not use SL and TP.
 Frog Jump
Hides Alone Candlesticks
 SAR ADX Signal
SAR ADX Signal with mobile notification, rewritten from MT4 version (source no longer found). This is a repaintable indicator, please be careful when using it.
 KA-Gold Bot MT5
KA-Gold Bot is an advanced trading advisor specifically designed for gold, utilizing the powerful combination of the Keltner channel strategy and two exponential moving averages (EMAs) - the 10-period EMA and the 200-period EMA. Principle of Operation: The 10-period EMA represents the average price cutting above/below the Keltner band, confirming an uptrend/downtrend. The price being above the 200-period EMA supports the uptrend/downtrend. This indicates that the uptrend/downtrend has been stronger than the previous 10 periods, considering the volatility over the last 50 periods. - Time frame: M15


