Rejoignez notre page de fans
- Publié par:
- Nikolay Kositsin
- Vues:
- 9294
- Note:
- Publié:
- 2011.09.27 13:08
- Mise à jour:
- 2016.11.22 07:32
-
Besoin d'un robot ou d'un indicateur basé sur ce code ? Commandez-le sur Freelance Aller sur Freelance
Real author:
John Tirone
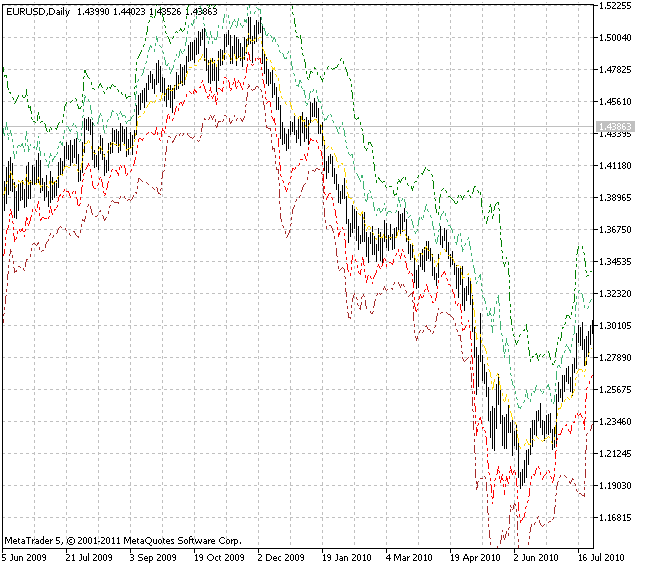
Tirone Levels are a series of several successively decreasing horizontal lines used to determine possible support and resistance areas on a price chart.
This technical analysis method is developed by John Tirone in his book "Classical Technical Analysis as a Powerful Trading Methodology". The system based on five Tirone levels is constructed using the Adjusted Mean method.
This method generates 5 often non-symmetrical lines.
- Adjusted average value (Adjusted Mean) is found at first;
- The next line is found by deducting the minimum from the Adjusted Mean multiplied by 2;
- The third line is the Adjusted mean itself (adjusted average);
- The next line is calculated by deducting the maximum from the Adjusted Mean multiplied by 2;
- The lowest line is calculated by deducting the minimum from the maximum and deducting this result from the Adjusted Mean.
The levels are calculated the following way:
Adjusted mean = (Hhigh+Llow+Close)/3
Tirone Level 1 = Adjusted Mean + (Hhigh-Llow)
Tirone Level 2 = 2 x Adjusted Mean - Llow
Tirone Level 3 = Adjusted mean
Tirone Level 4 = 2 x Adjusted Mean - Hhigh
Tirone Level 5 = Adjusted Mean - (Hhigh-Llow)
where:
- Hhigh (Highest High) - the highest price for a certain period, for example, 20 bars;
- Llow (Lowest Low) - the lowest value for a certain period, for example, 20 bars;
- Close - close price of a current bar.

Traduit du russe par MetaQuotes Ltd.
Code original : https://www.mql5.com/ru/code/458
 Three Tirone Levels
The indicator consists of support and resistance levels based on a trading range for a certain period of time.
 MyComment - new comments added without deleting existing ones.
New comments added to a chart without deleting existing ones.
 Variation Index
Variation Index shows if a trend or a flat movement is prevailing in the time series or random behaviour.
 DailyPivotPoints
The DailyPivot Points indicator helps to compose a picture of market future movements, in distinct from the other tools that hang behind the market.