Rejoignez notre page de fans
- Vues:
- 18326
- Note:
- Publié:
- 2020.11.29 00:27
- Mise à jour:
- 2020.11.29 01:06
-
Besoin d'un robot ou d'un indicateur basé sur ce code ? Commandez-le sur Freelance Aller sur Freelance
MT4 version=https://www.mql5.com/en/code/29748
Draws Pivot Points Level Lines for formula's
- Floor
- Fibonacci
- Camarilla
- Woodie
ALL Pivot Points Time-Frames
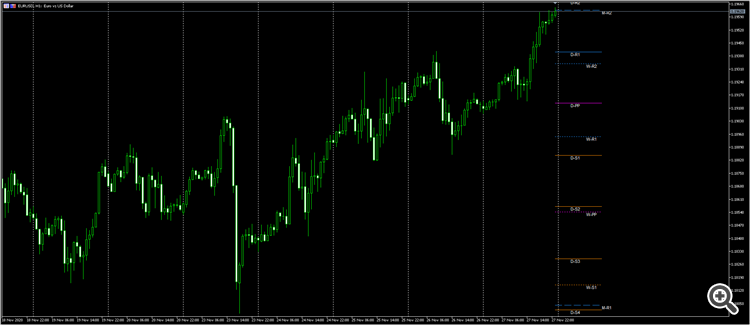
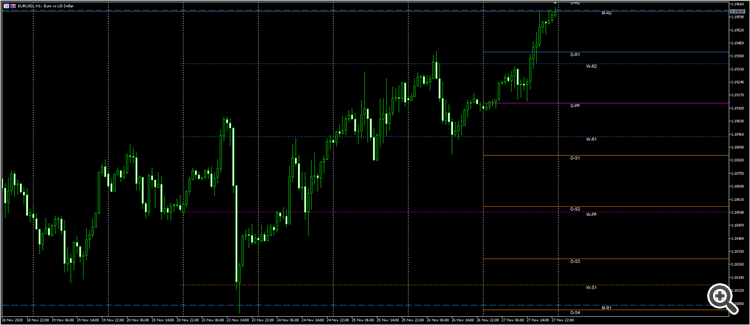
Draw long or short lines.
Option to Show floor mid pivot points
Option to show pivot point price in label
Can have many Instance of indicator on same chart just use different time-frame period.
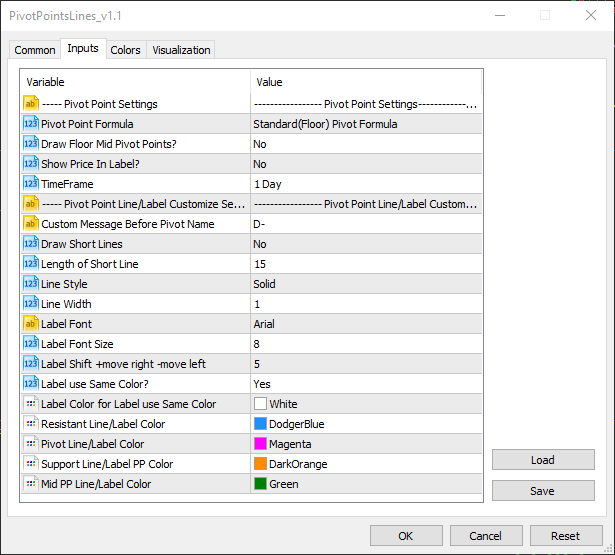
Many customization settings feel free to change to your liking.
Inputs/Example Pictures
 Stoch RSI MT5
The Stochastic RSI indicator (Stoch RSI) is essentially an indicator of an indicator. It is used in technical analysis to provide a stochastic calculation to the RSI indicator. This means that it is a measure of RSI relative to its own high/low range over a user defined period of time. The Stochastic RSI is an oscillator that calculates a value between 0 and 1 which is then plotted as a line. This indicator is primarily used for identifying overbought and oversold conditions.
 Fibonacci Potential Entry - MT5
The 8 effective steps to build a robust day trading plan using Fibonacci retracement
 Swing trading 3 EMA Crossover MQL5
Hassane Zibara
 Reflex and Trendflex
Reflex and Trendflex was created by John Ehlers ("Stocks & Commodities Feb. 2020 (6-8)").


