Rejoignez notre page de fans
- Vues:
- 17934
- Note:
- Publié:
-
Besoin d'un robot ou d'un indicateur basé sur ce code ? Commandez-le sur Freelance Aller sur Freelance
Indicator MACD Overlay displays the chart as colored candles according to the data from oscillator MACD.
It has five adjustable parameters:
- Data MACD Compare mode - MACD data comparison mode
- MACD and signal Lines - MACD line and signal line
- MACD vs zero line - MACD line referred to zero
- Current and previous MACD values - comparing the current and previous values of the MACD line
- MACD fast EMA period - MACD indicator's fast EMA calculation period
- MACD slow EMA period - MACD indicator's slow EMA calculation period
- MACD period signal line - MACD indicator's signal line calculation period
- MACD applied price - MACD indicator's calculation price
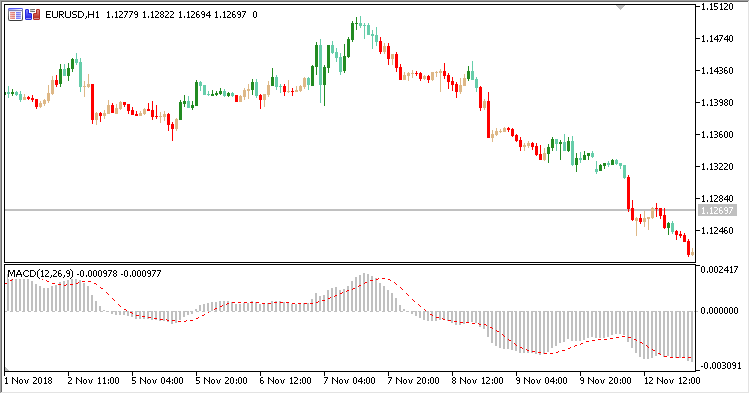
MACD and signal Lines:
- If the MACD line is above the signal line,
then the bullish candle is displayed in green
the bearish candle is displayed in light-green
- If the MACD line is below the signal line,
then the bearish candle is displayed in red
the bullish candle is displayed in light-red
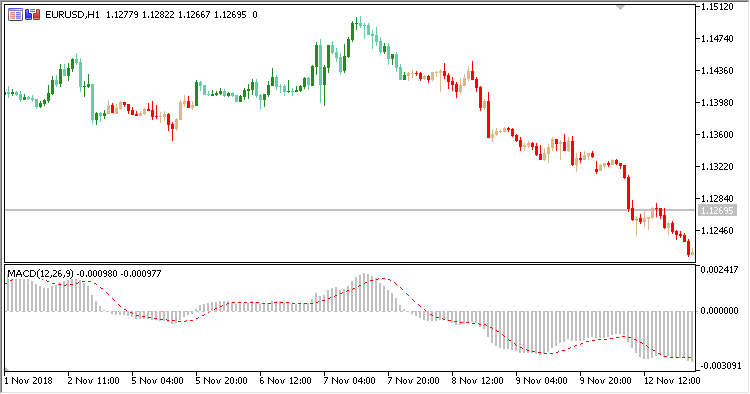
MACD vs zero line:
- If the MACD line is above zero,
then the bullish candle is displayed in green
the bearish candle is displayed in light-green
- If the MACD line is below zero,
then the bearish candle is displayed in red
the bullish candle is displayed in light-red
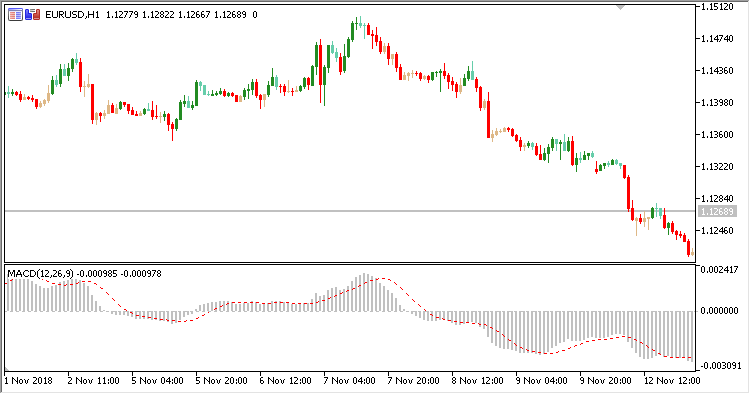
Current and previous MACD values:
- If the MACD line values grow,
then the bullish candle is displayed in green
the bearish candle is displayed in light-green
- If the MACD line values fall,
then the bearish candle is displayed in red
the bullish candle is displayed in light-red

Fig. 1. MACD Overlay + MACD. Data MACD Compare mode = MACD and signal Lines

Fig. 2. MACD Overlay + MACD. Data MACD Compare mode = MACD vs zero line

Fig. 3. MACD Overlay + MACD. Data MACD Compare mode = Current and previous MACD values
Traduit du russe par MetaQuotes Ltd.
Code original : https://www.mql5.com/ru/code/23427
 ColorPEMA_Digit
A five-fold exponential moving average that displays the most recent value as a price label with the possibility to round the indicator levels to the required number of orders
 Advanced_Fractal_Envelopes
Indicator Advanced Fractal Envelopes
 ColorPEMA_Digit_r
A moving ColorPEMA_Digit with the limitation of the computer resources used for its calculations on the entire chart and on the current bar
 RSI_Overlay
Indicator RSI Overlay