Rejoignez notre page de fans
- Vues:
- 3584
- Note:
- Publié:
- 2018.09.14 14:47
-
 Vous manquez des opportunités de trading :
- Applications de trading gratuites
- Plus de 8 000 signaux à copier
- Actualités économiques pour explorer les marchés financiers
Inscription Se connecterVous acceptez la politique du site Web et les conditions d'utilisation
Si vous n'avez pas de compte, veuillez vous inscrire -
 Besoin d'un robot ou d'un indicateur basé sur ce code ? Commandez-le sur Freelance
Aller sur Freelance
Besoin d'un robot ou d'un indicateur basé sur ce code ? Commandez-le sur Freelance
Aller sur Freelance
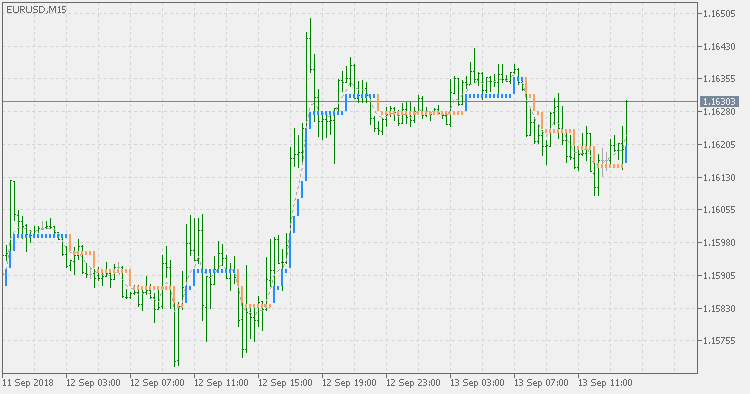
Basic theory :
Step chart indicator, in its basic form, is made as a way to filter out insignificant price changes. Price changes are specified in pips and all the changes smaller than the desired are ignored. When drawing such values we are getting that characteristic step like chart and that is where the name of the indicator came from
This version :
Here we have added a choice of moving averages that can be used for additiona filtering too. That way we are having a sort of "double filtering"
Usage :
Experiment a bit with the parameters, but it seems that with a mild average price filtering, step chart is becoming lest sensitive to some false signals
 Support and Resistance Trader
Expert adviser scans past 500 closing bars and looks for common closing regions as entries.
 Kaufman ama - with floating levels
Kaufman ama - with floating levels