Rejoignez notre page de fans
- Vues:
- 4229
- Note:
- Publié:
- 2018.07.13 15:51
-
 Vous manquez des opportunités de trading :
- Applications de trading gratuites
- Plus de 8 000 signaux à copier
- Actualités économiques pour explorer les marchés financiers
Inscription Se connecterVous acceptez la politique du site Web et les conditions d'utilisation
Si vous n'avez pas de compte, veuillez vous inscrire -
 Besoin d'un robot ou d'un indicateur basé sur ce code ? Commandez-le sur Freelance
Aller sur Freelance
Besoin d'un robot ou d'un indicateur basé sur ce code ? Commandez-le sur Freelance
Aller sur Freelance
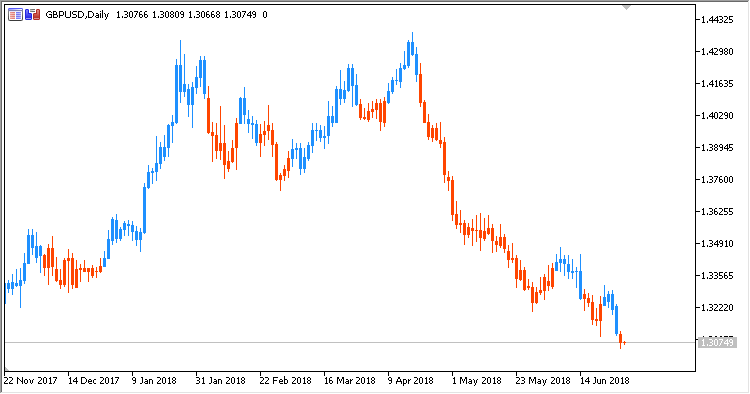
Indicator CMC (Clear Method Candles) displays colored candlesticks, based on the existing market trend. It is calculated by the "pure" method (without using any other indicators, only price) and has no configurable parameters. It is based on indicator Clear Method Histogram.
Calculations:
-
If Swing > 0, then candlesticks are blue
-
If Swing < 0, then candlesticks are red
where:
HH = Maximum(High, PrevHH)
LH = Minimum(High, PrevLH)
HL = Maximum(Low, PrevHL)
LL = Minimum(Low, PrevLL)
-
If Swing > 0 and High < HL:
Swing = -1
LL = Low
LH = High
-
If Swing < 0 and Low > LH:
Swing = 1
HH = High
HL = Low
-
Otherwise, if High < HL:
Swing = -1
LL = Low
LH = High
-
Otherwise, if Low > HL:
Swing = 1
HH = High
HL = Low
Traduit du russe par MetaQuotes Ltd.
Code original : https://www.mql5.com/ru/code/21274
 CMH
CMH
Indicator CMH (Clear Method Histogram) displays a color histogram of the current market trend.
VC
Indicator VC (Volatility Channel by Larry Williams).
CRF
Indicator CRF (Cumulative Rotation Factor) displays the states of the market: Uptrends/downtrends/consolidation.
JB_Volatility
JB Volatility - market volatility oscillator marking its state in color.