Rejoignez notre page de fans
- Vues:
- 5874
- Note:
- Publié:
- 2018.06.14 13:53
-
 Vous manquez des opportunités de trading :
- Applications de trading gratuites
- Plus de 8 000 signaux à copier
- Actualités économiques pour explorer les marchés financiers
Inscription Se connecterVous acceptez la politique du site Web et les conditions d'utilisation
Si vous n'avez pas de compte, veuillez vous inscrire -
 Besoin d'un robot ou d'un indicateur basé sur ce code ? Commandez-le sur Freelance
Aller sur Freelance
Besoin d'un robot ou d'un indicateur basé sur ce code ? Commandez-le sur Freelance
Aller sur Freelance
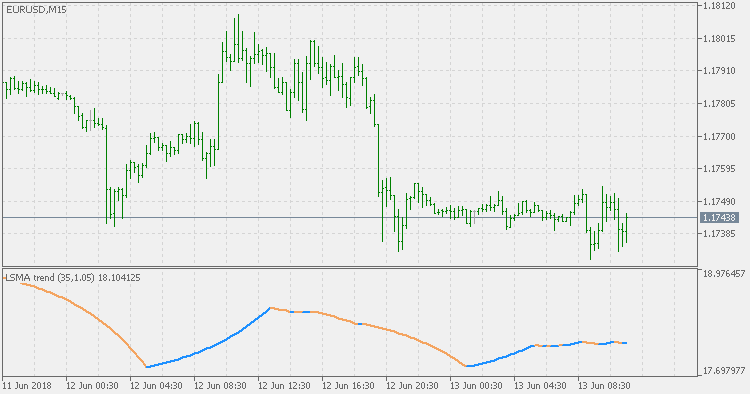
Indicator based on linear regression value or, as it is sometimes known - LSMA (Least Squares Moving Average).
It shows the trend of the used average and displays it as a sort of an oscillator.
 Quadratic Regression MA
Quadratic Regression MA is a sort of a linear regression value variation, but faster in response to market changes.
Historical Volatility Bands - High/Low
Historical Volatility bands constructed using average as the middle line, and upper and lower bands using the Historical Volatility high/low (instead of "regular" Historical Volatility) for bands calculation.
Trend Envelopes of Averages
Trend Envelopes with an option to chose smoothed/filtered price in calculation instead of using "raw" prices.
Historical Volatility - Parkinson
An important use of the Parkinson's number is the assessment of the distribution prices during the day as well as a better understanding of the market dynamics. Comparing the Parkinson's number and periodically sampled volatility helps traders understand the tendency towards mean reversion in the market as well as the distribution of stop-losses.