Rejoignez notre page de fans
- Vues:
- 8637
- Note:
- Publié:
- 2017.03.02 12:29
-
Besoin d'un robot ou d'un indicateur basé sur ce code ? Commandez-le sur Freelance Aller sur Freelance
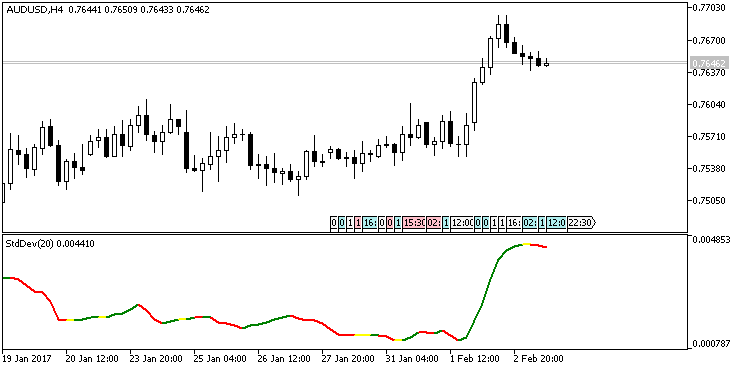
The idea of revising the standard StdDev indicator is to improve the visibility of moments when the indicator values change to growing or falling.
The values can be interpreted as follows.
- The moment when the line color changes from red to green indicates the beginning of the trend movement.
- When the line color changes from green to red, the trend movement is weakening.
The indicator is traditionally used along with Bollinger Bands. If the price touches the upper Bollinger Band or is close to it, and the color of Modified Standard Deviation changes from red to green, it can be interpreted as the beginning of the uptrend movement. If the price is near the bottom Bollinger Band and Modified Standard Deviation begins to grow, it indicates the beginning of a downward trend.

Traduit du russe par MetaQuotes Ltd.
Code original : https://www.mql5.com/ru/code/17538
 MFICandleKeltner
A Keltner Channel drawn relative to the average value of the MFI oscillator as a sequence of candlesticks
 Exp_WeightOscillator_Direct
The trading system is based on direction changes of the wighted oscillator WeightOscillator
 Order Escort
The Expert Advisor solves the problem of position trailing along a given curve by moving its Stop Loss and Take Profit.
 MFI_price_HTF
The MFI_price indicator with the timeframe selection option available in the input parameters.