Rejoignez notre page de fans
- Vues:
- 16529
- Note:
- Publié:
- 2016.10.20 16:18
- Mise à jour:
- 2016.11.22 07:32
-
 Vous manquez des opportunités de trading :
- Applications de trading gratuites
- Plus de 8 000 signaux à copier
- Actualités économiques pour explorer les marchés financiers
Inscription Se connecterVous acceptez la politique du site Web et les conditions d'utilisation
Si vous n'avez pas de compte, veuillez vous inscrire -
 Besoin d'un robot ou d'un indicateur basé sur ce code ? Commandez-le sur Freelance
Aller sur Freelance
Besoin d'un robot ou d'un indicateur basé sur ce code ? Commandez-le sur Freelance
Aller sur Freelance
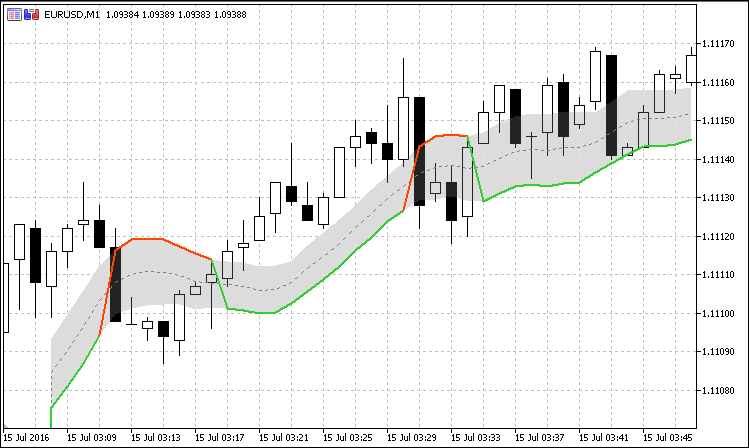
The Gann High Low Activator Indicator was described by Robert Krausz in a 1998 issue of Stocks & Commodities Magazine. It is a simple moving average SMA of the previous n period's highs or lows.
The indicator tracks both curves (of the highs and the lows). The close of the bar defines which of the two gets plotted.
This version is showing the channel that needs to be broken if the trend is going to be changed, and it allows you to chose from the 4 basic averages type for calculation (by definition, Gann High Low Activator uses only simple moving average, but some other averages can give you results that are probably more acceptable for trading in some conditions).
Multi time frame example :
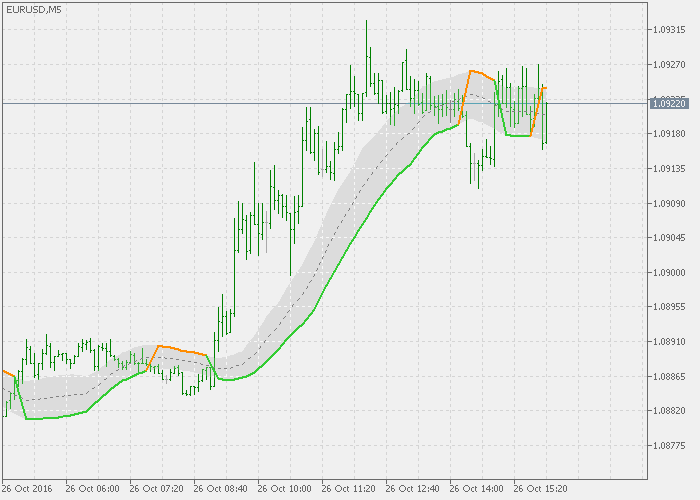
 Daily Data
The indicator displays in chart window the important data on current symbol.
XVolume
Simple volume indicator that has two coloring mode options.
One More Average
The idea of this one is simple: it should "imitate" as much other moving averages as it can.
Jurik Filter
This is an improved Jurik Filter with the option to be applied to any indicator not only to prices.