Rejoignez notre page de fans
- Vues:
- 9423
- Note:
- Publié:
- 2012.10.10 13:00
- Mise à jour:
- 2016.11.22 07:32
-
Besoin d'un robot ou d'un indicateur basé sur ce code ? Commandez-le sur Freelance Aller sur Freelance
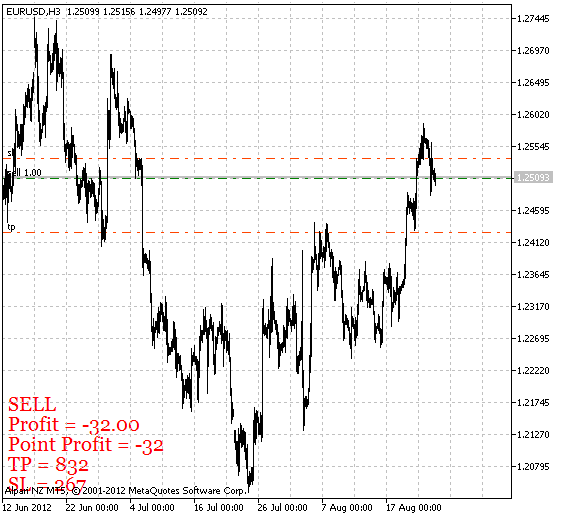
The simple indicator for displaying some relevant information about a position opened on the current chart right in that chart window. The data includes position direction, profit in points and distances to Stop Loss and Take Profit from the current price in points. If the position is currently in a loss-making state, the text is colored in red. Otherwise, it is colored in green.
This indicator can be quite useful in multicurrency strategies when the use of Toolbox panel is not appropriate.
Indicator input parameters:
//+----------------------------------------------+
//| Indicator input parameters                   |
//+----------------------------------------------+
input color  UpColor=Lime;//color of profitable position
input color  DnColor=Red;//color of unprofitable position
input color  ZrColor=Gray;//color of position without profit
input int    FontSize=15; //font size
input type_font FontType=Font14; //font type
input ENUM_BASE_CORNER  WhatCorner=CORNER_LEFT_LOWER; //location corner
input uint Y_=1; //vertical location
input uint X_=5; //horizontal location
Place GetFontName.mqh to the terminal_directory\MQL5\Include.

PositionInfo
Traduit du russe par MetaQuotes Ltd.
Code original : https://www.mql5.com/ru/code/1017
 Exp_ATR_Trailing
The Expert Advisor moves Stop Loss of the open position along the border of the channel built using ATR_Trailing.
 i-AnyRange2
The indicator of two unspecified time intervals.
 ColorStochastic_HTF
Standard Stochastic oscillator displayed as a cloud that can be located by setting the indicator timeframe value different from the chart one.
 iMACD±ATR
MACD shifted for the trading range is used to determine a trend and overbought/oversold areas.