
|
8+ años
experiencia
|
60
productos
|
208
versiones demo
|
|
589
trabajos
|
0
señales
|
0
suscriptores
|

Taras Slobodyanik

· 2
khanatd
2020.06.08
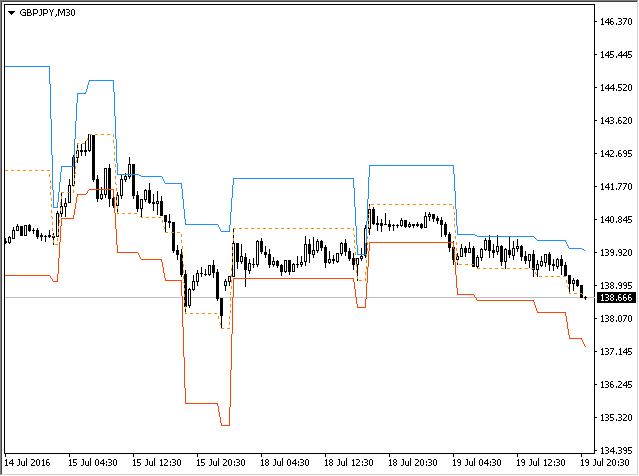
hi sir, does it shall show PRICE LEVELS where to buy and stop loss and take profit? thanks