ALFRED MURIITHI / Perfil
- Información
|
10+ años
experiencia
|
20
productos
|
270
versiones demo
|
|
0
trabajos
|
0
señales
|
0
suscriptores
|
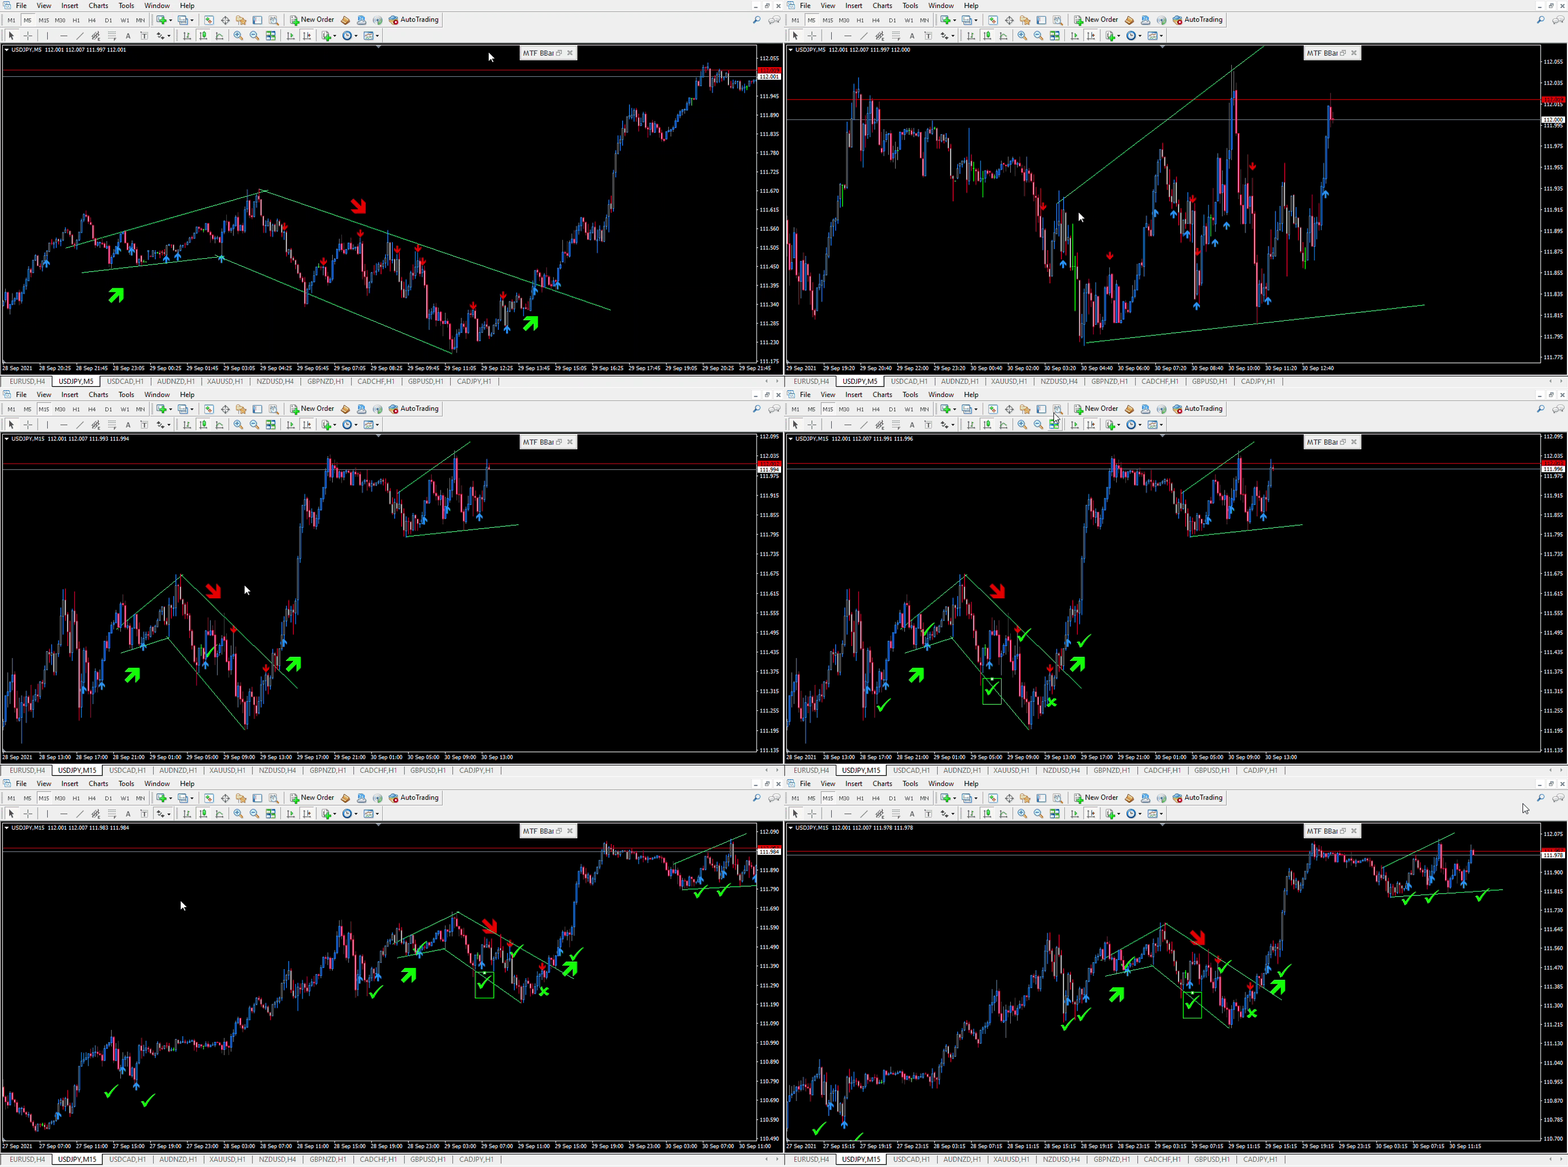
Doesn't matter whether the market is ranging within channels or trending. Retracement Feeder with default settings got your back.
👍🏻Retracement Feeder (MT4) : https://www.mql5.com/en/market/product/67443
👍🏻Retracement Feeder (MT5) : https://www.mql5.com/en/market/product/71340

Doesn't matter whether the market is ranging within channels or trending. Retracement Feeder with default settings got your back.
👍🏻Retracement Feeder (MT4) : https://www.mql5.com/en/market/product/67443
👍🏻Retracement Feeder (MT5) : https://www.mql5.com/en/market/product/71340

Indicators to use
Bollinger Band (Period:500, Shift: 0, Deviations:2)
True Oversold Overbought (mt4):: https://www.mql5.com/en/market/product/68396
Timeframe to trade: 1H Chart
Buy Rule: -
Make sure the price on 4H chart is above the main band (middle line)
On 1H chart, make sure the price is below the lower band.
Buy when the True Oversold Overbought mt4 indicator crosses -5000 from below. This way, you buy only when the price exits oversold state.
Sell Rule: -
Make sure the price on 4H chart is below the main band (middle line)
On 1H chart, make sure the price is above the upper band.
Sell when the True Oversold Overbought mt4 indicator crosses 5000 from above. This way, you sell only when the price exits overbought state.
✔️Get all retracements on time
✔️Works with all timeframes.
✔️Does NOT repaint.
🚀 Retracement Feeder MT5 :https://www.mql5.com/en/market/product/71340

✔️Get all retracements on time
✔️Works with all timeframes.
✔️Does NOT repaint.
🚀 Retracement Feeder MT5 :https://www.mql5.com/en/market/product/71340
🚀 Retracement Feeder MT4 : https://www.mql5.com/en/market/product/67443

✔️Get all retracements on time
✔️Works with all timeframes.
✔️Does NOT repaint.
🚀 Retracement Feeder MT5 :https://www.mql5.com/en/market/product/71340
🚀 Retracement Feeder MT4 : https://www.mql5.com/en/market/product/67443

👉Ranging Market Detector >> https://www.mql5.com/en/market/product/66062
🏛 ALL EA https://www.mql5.com/en/users/pipmontra/seller

👉 Here is the link» https://www.mql5.com/en/market/product/71340
The Retracement Feeder checks for retracement opportunities after the first move has occurred. Basically it scans for the second wave of trend. Works with any financial instrument, It does not repaint/change color or cancel arrows, Easy to set and use. Works great with Renko Charts MT4 version: https://www.mql5.com/en/market/product/67443 How it works The indicator is based on RSI and Stochastics. The algorithm used in the Retracement Feeder allows the
Trendy Stock is a price following indicator that uses Stochastic to show when the price is out of the oversold or overbought areas. The algorithm allows you to stay longer in a trend where the bulls or bears are in control. The indicator changes color immediately the price exits oversold/overbought state. In short, the downtrend [red] bars start to paint when the buying pressure decreases while the uptrend [green] bars form as the buy pressure kicks in. For MT4 version, follow
Follow: https://www.mql5.com/en/blogs/post/745521
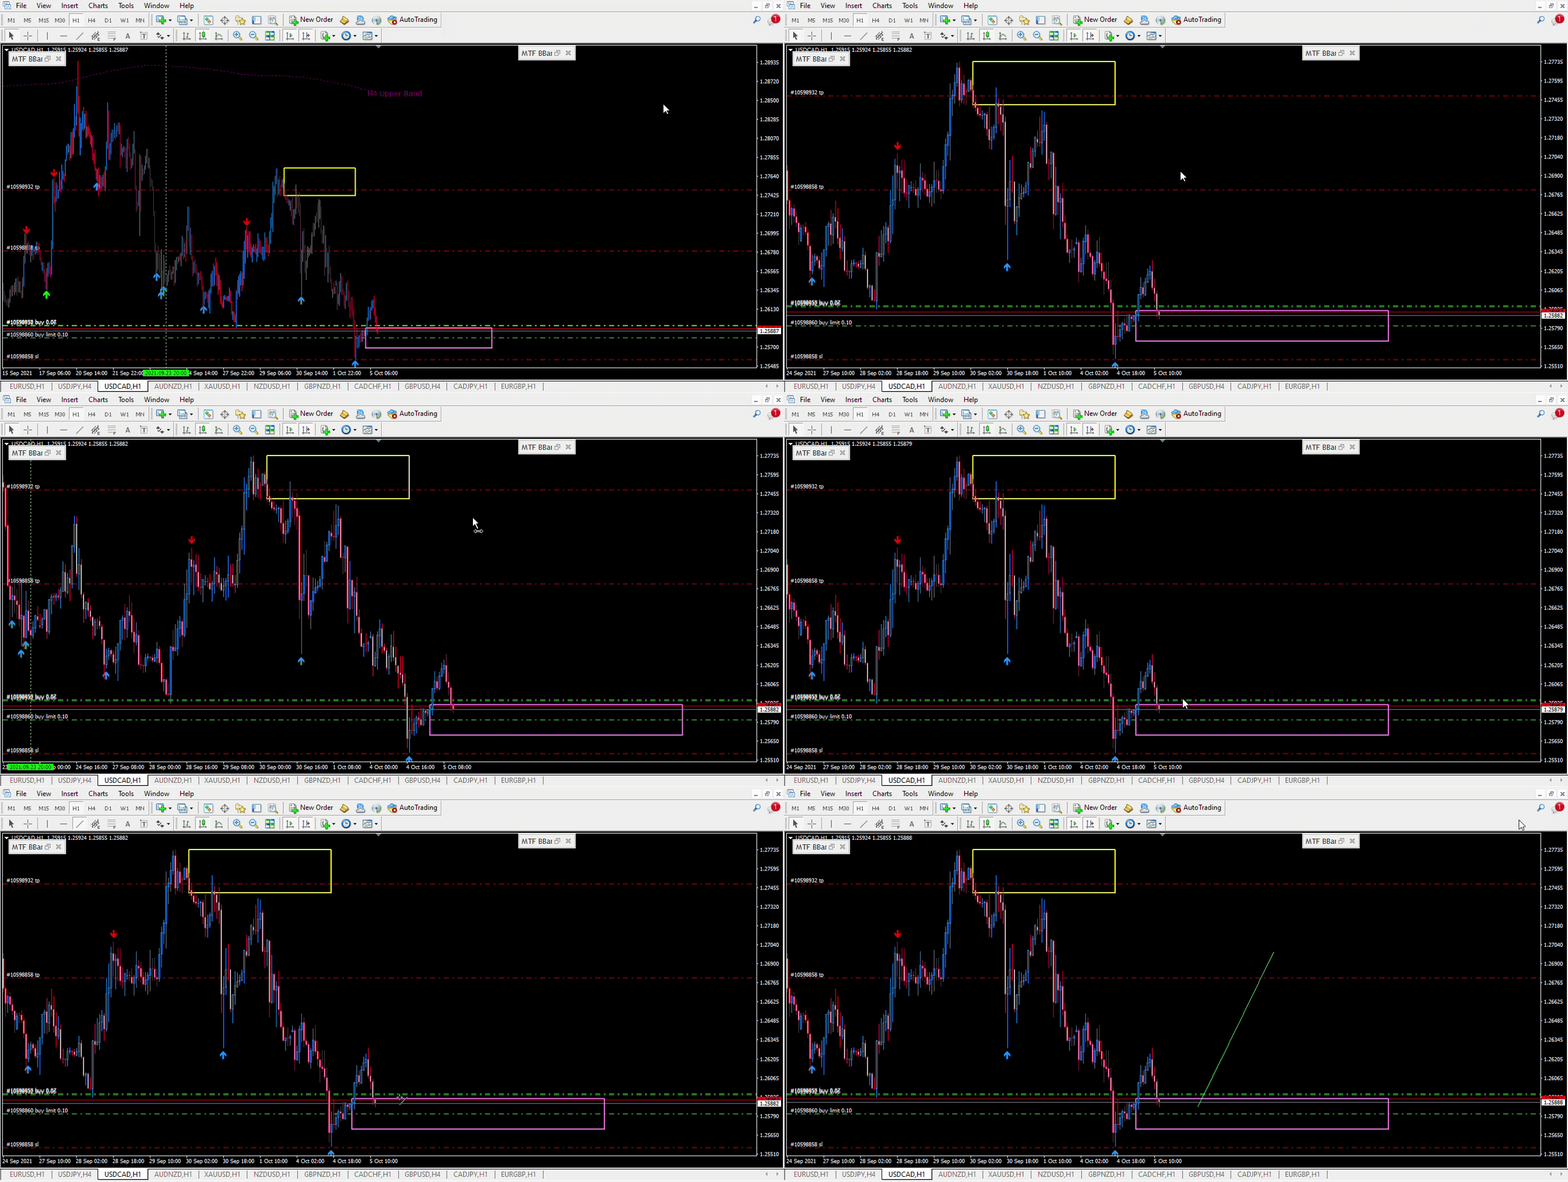
The Ranging Market Detector yellow green signal line is above 0.✔️
On the Chart, the candle has closed above previous high (Yellow Box).✔️
Since the preceding candle is more than 100 pips, wait for the price to touch the yellow box or candle to close in the box and then BUY ✔️
https://www.mql5.com/en/blogs/post/745437
👉Open buy trades after the indicator line crosses -5000 and sell when the line drops below 5000: These methods allow you to open trade early. The best results are in higher timeframes. As you probably already know, the best place to check for oversold or overbought status is in the higher timeframes.
See the example below.
Download your copy today.
👉True Oversold Overbought: https://www.mql5.com/en/market/product/68396
True Oversold Overbought in action
👉Secondly, if you want to re-enter the trend:
Buy when the candle opens above the previous high (where the positive spike was last formed)
Sell when the candle opens below the previous low (where the negative spike was last formed)
Just Subscribe to our @rangingmarket Telegram group | @rangingmarkets Telegram Channel for community support
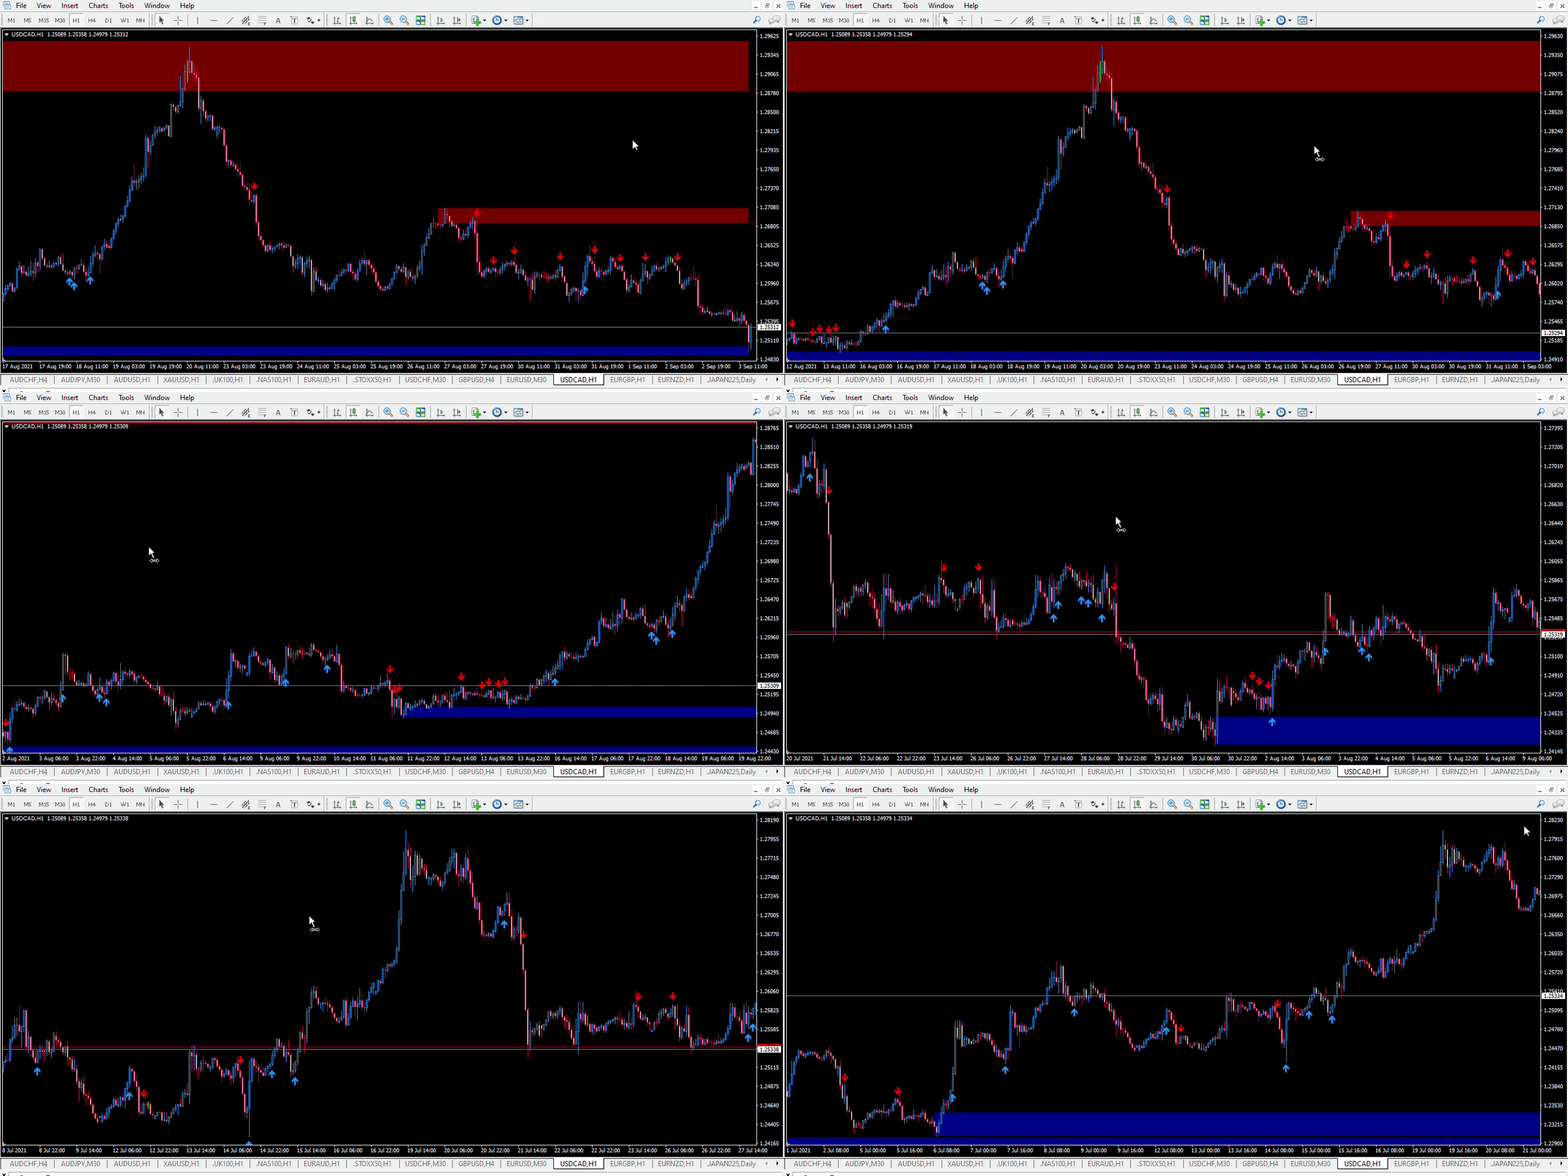
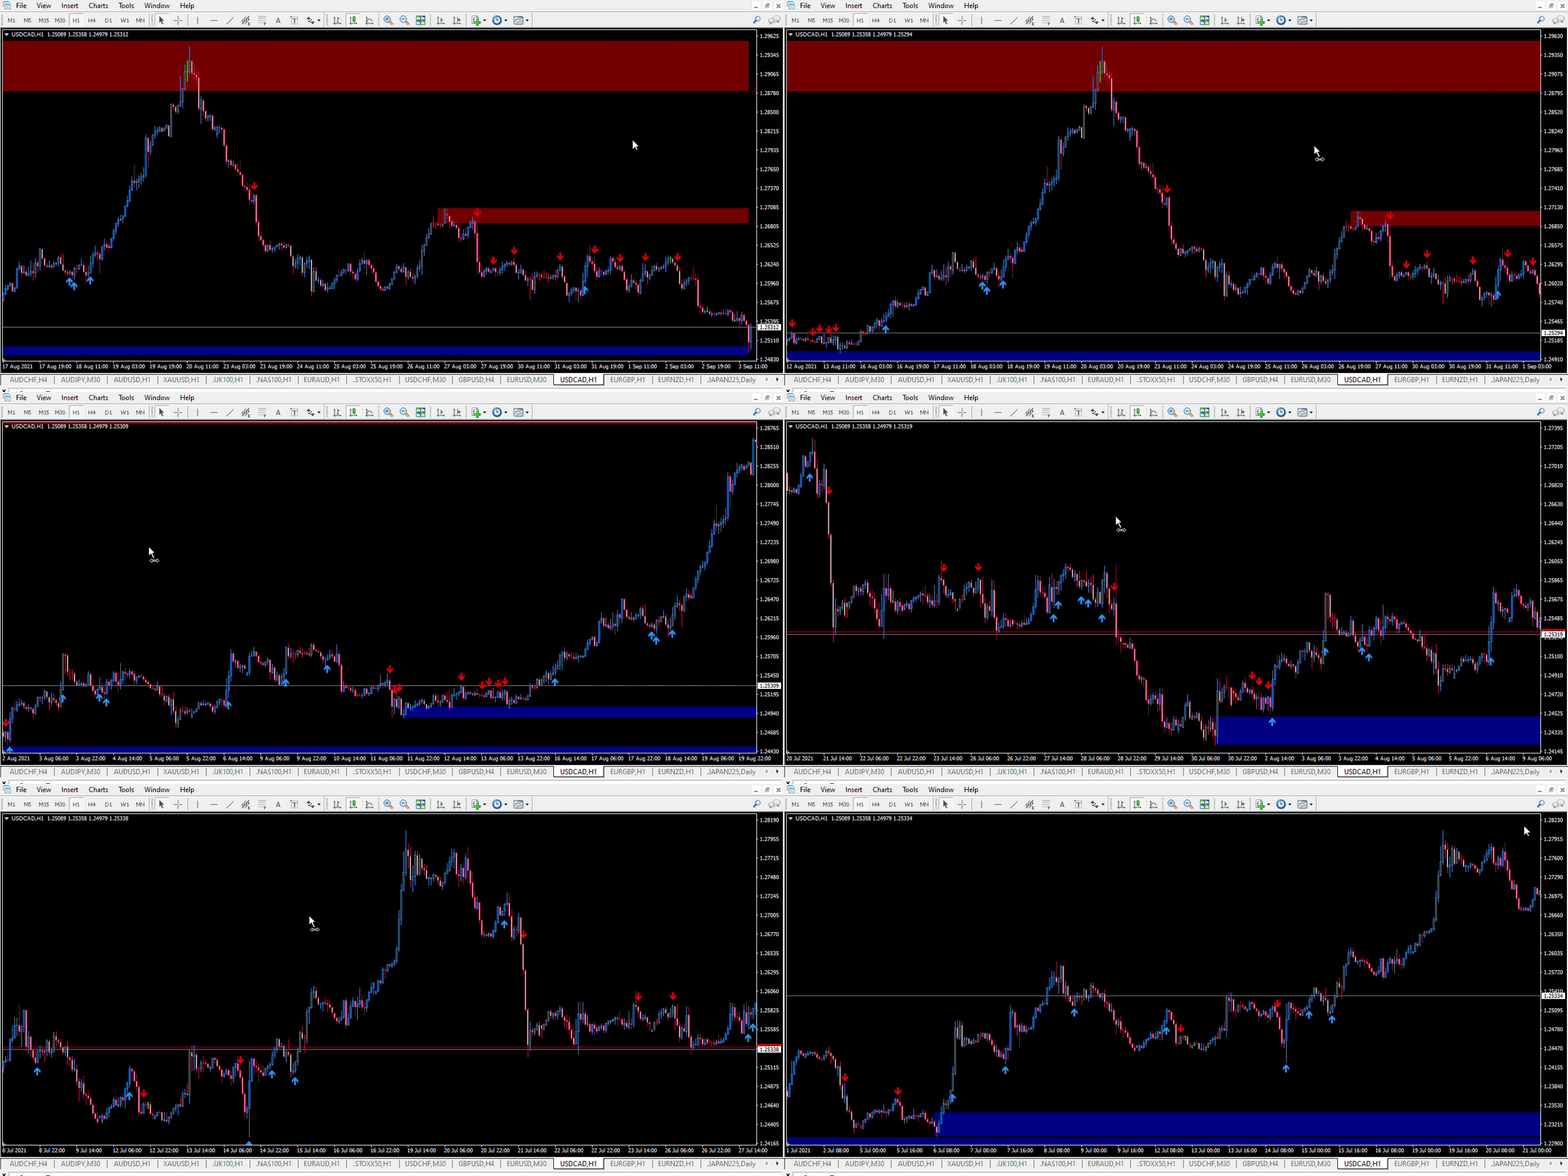
This indicator is now able to give accurate oversold/overbought levels. 👉True Oversold Overbought: https://www.mql5.com/en/market/product/68396
https://www.mql5.com/en/market/product/68396
🔺 When the "Super Charge" feature is enabled, the areas where the price is in oversold/overbought status are amplified to give you a clear state of the market,therefore, you will not miss the moment to prepare for a reversal/retracement (over 5000 is overbought and below -5000 is oversold ; buy when indicator closes above -5000 and sell when it closes below 5000).
🔺 Alternatively, when the "Super Charge" feature is disabled, the indicator still shows the oversold and overbought levels but this time you get a broader view of the market (over 80 is overbought and below -80 is oversold; buy when indicator closes above -80 and sell when it closes below 80).
Step 1: Enable Draw Convergence/Divergence Lines
Step 2: Leave MFI, RSI & Stochastic in default settings
Step 3: Select option Averaged MFI & RSI & Stoc in the drop down.
BUY
1. Buy Convergence or Divergence lines appear when the indicator is Below 50
2. Open buy order when the indicator crosses above 50
Closing positions
a. close loss: when indicator moves back below 50
b. close profit: when the sell divergence /convergence appears
SELL
1. Sell Convergence or Divergence lines appear when the indicator is Above 50
2. Open sell order when the indicator crosses below 50
Closing positions
a. close loss: when indicator moves back above 50
b. close profit: when the buy divergence /convergence appears
https://www.mql5.com/en/market/product/69003#!tab=comments&page=1&comment=23472601
Introduction The Convergence Divergence Suite contains 17 indicators , built-in MT4 technical indicators and custom ones . The list will be increased in subsequent versions as per users' requests. Any selected indicator is loaded on your chart then automatic Convergence and Divergence trend lines are drawn on the chart and indicator. This tool is important if you use any of the listed indicators or convergence/divergence in your strategy. Advantages With the Convergence Divergence


