ALFRED MURIITHI / Perfil
- Información
|
10+ años
experiencia
|
20
productos
|
270
versiones demo
|
|
0
trabajos
|
0
señales
|
0
suscriptores
|
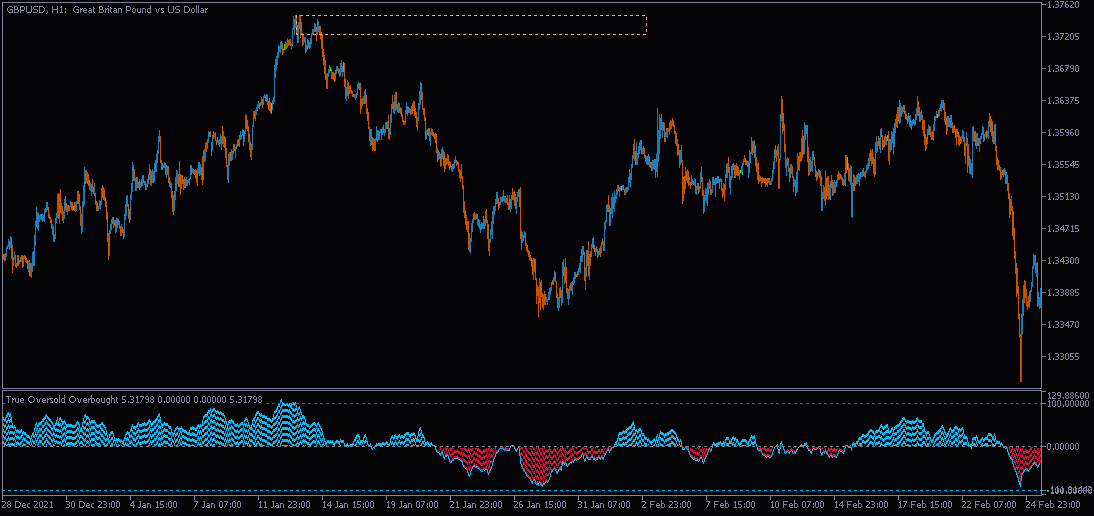
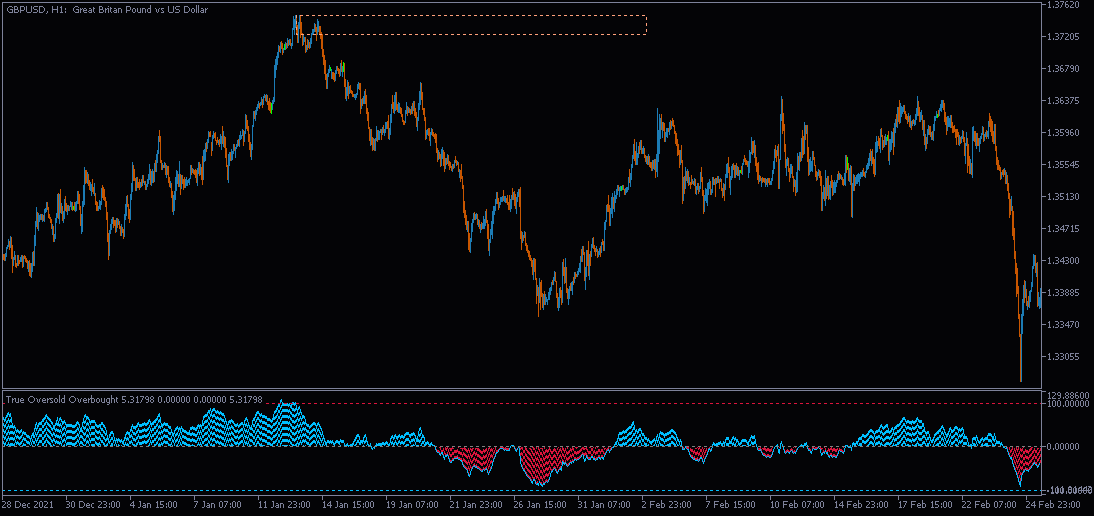
The True Oversold Overbought indicator provides you with ability to swiftly check whether the asset is oversold or overbought.
Other than complementing your trading with True Oversold Overbought, you can use the indicator as your only trading system.
It works with all forex instruments and will save you the headache of estimating when the market is due for a reversal or retracement.
When the "Super Charge" feature is enabled, the areas where the price is in oversold/overbought status are amplified to give you a clear state of the market,therefore, you will not miss the moment to prepare for a reversal/retracement.
Alternatively, when the "Super Charge" feature is disabled, the indicator still shows the oversold and overbought levels but this time you get a broader view of the market.
Advantages
✔️It is not overly sensitive or keep touching oversold/overbought levels.
✔️Open trades early when the price is exiting overbought / oversold levels and close trades at the right time.
✔️Trade when there is noise and when the market is silent.
✔️No complex settings since the default settings work perfectly.
✔️The indicator displays on the separate window and also show rectangles on the main chart.
✔️When the overbought and oversold rectangles draw, it is time to buy if price opens above the rectangles and sell if the candle opens below.
Note: If the overbought rectangle is formed but a candle open above it, its an indication the trend will continue surging for a while before breaking below.
Similarly, the continued drop in price below the oversold rectangle indicates the price might continue in the same direction before bulls takes control.
⭐️⭐️⭐️⭐️⭐️True Oversold Overbought MT5: https://www.mql5.com/en/market/product/79336
⭐️⭐️⭐️⭐️⭐️True Oversold Overbought MT4: https://www.mql5.com/en/market/product/68396
🔥🔥🔥🔥🔥 Download other indicators: https://www.mql5.com/en/users/pipmontra/seller
Trend Re-entry
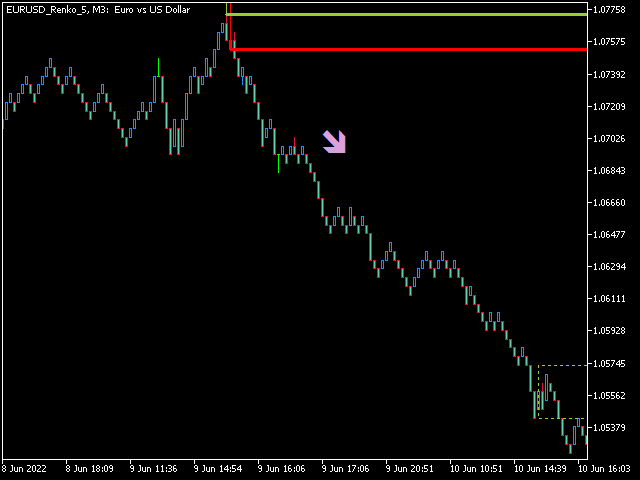
In this case you would plan your buy entries above the green dotted box (make sure to set the Buy / Sell Retracement Floor=30). The SL should be placed below the immediate low. Sell when the red dotted box appears below the red separator and place the SL above the previous high. You can also use any other indicator or Fibonacci for your re-entry.
If you use Fibonacci, 100% retracement should be on the red /green separator line. If you want to open sells using fibo wait for the price to hit 50% mark, and then draw a rectangle between 61.8 and 38.2 lines. Go short if the price falls below the rectangle and place SL above the rectangle. Same logic applies when opening buys but your base line is the greed separator.
Trend Exhaustion
Alternatively if you want to know when the trend is almost coming to exhaustion, set the Buy / Sell Retracement Floor=80 to 95. Price will most likely retreat after pushing higher above the green dotted box or below the red dotted box.
The Price Elevator indicator is best suited to work with Renko Charts where the noise is greatly reduced.
🔥🔥🔥🔥🔥 Price Elevator MT5 >https://www.mql5.com/en/market/product/82757
🔥🔥🔥🔥🔥 Price Elevator MT4 >https://www.mql5.com/en/market/product/82760
👉 Download other indicators: https://www.mql5.com/en/users/pipmontra/seller
New Update: It now draws Critical Boxes as support/resistance areas.
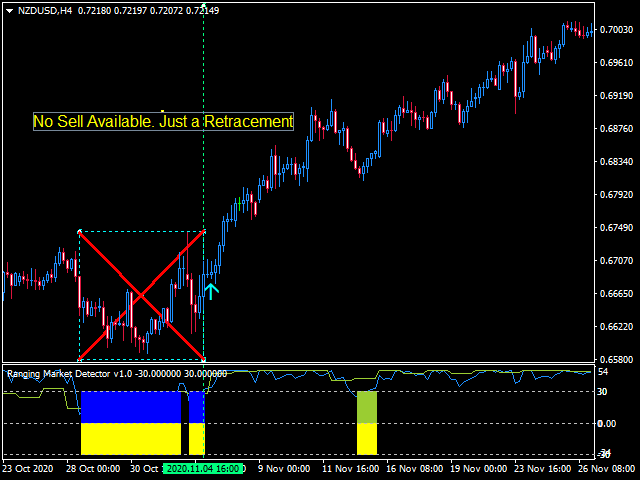
It works with all the all assets and visually shows you the instances when the market is either ranging or trending.
Informs when the price has finished a retracement, an opportune time to re-enter the trend early. This will help you in position management.
It works very well for Scalping, Day trading, and Swing trading. Helpful in all timeframes
Great tool for every trader.
Features:
If Disable Histograms=true. This disables the Histograms.
The indicator then displays only the Short-term/Fast Signal lines, the Multi-timeframe Long-term Signal lines, and levels -20, 0, 20, and colored Dots.
BUY: After the LightGreen dot forms, but wait for the candle to open above the YellowGreen box on the chart.
OR After the Red dot forms, but a candle open above the Red box on the chart.
SELL: After the Red dot forms, but wait for the candle to open below the Red box on the chart.
OR After the YellowGreen dot forms, but a candle open below the YellowGreen box on the chart.
If Disable Histograms=false. This displays the Histograms, both signal lines and levels -30, 0, and 30
When the Histograms are drawn on a section of the indicator, the market is either entering ranging state or changing direction.
If there are no histograms being drawn, the market has started to trend.
BUY:
If both the short-term and the Long-term signal lines are above 0 , but wait for the candle to open above the YellowGreen box on the chart.
OR If both the short-term and the Long-term signal lines are below 0 , but a candle open above the Red box on the chart.
SELL:
If both the short-term and the Long-term signal lines are below 0 , but wait for the candle to open below the Red box on the chart.
OR If both the short-term and the Long-term signal lines are above 0 , but a candle open below the YellowGreen box on the chart.
👉 Ranging Market Detector: https://www.mql5.com/en/market/product/66062
🔥🔥🔥🔥🔥 Download other indicators: https://www.mql5.com/en/users/pipmontra/seller
Trend Re-entry
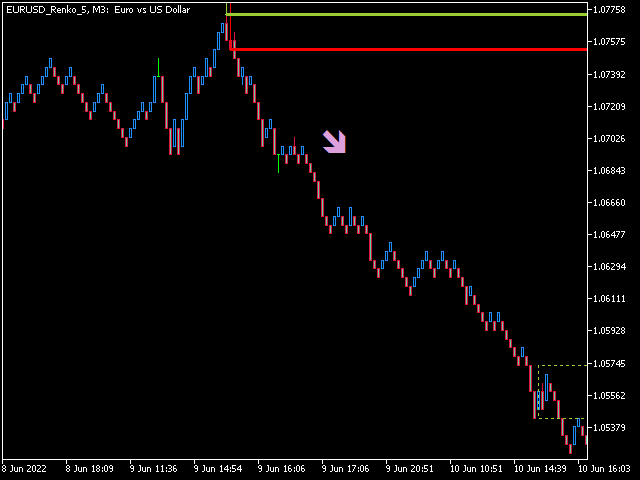
In this case you would plan your buy entries above the green dotted box (make sure to set the Buy / Sell Retracement Floor=30). The SL should be placed below the immediate low. Sell when the red dotted box appears below the red separator and place the SL above the previous high. You can also use any other indicator or Fibonacci for your re-entry.
If you use Fibonacci, 100% retracement should be on the red /green separator line. If you want to open sells using fibo wait for the price to hit 50% mark, and then draw a rectangle between 61.8 and 38.2 lines. Go short if the price falls below the rectangle and place SL above the rectangle. Same logic applies when opening buys but your base line is the greed separator.
Trend Exhaustion
Alternatively if you want to know when the trend is almost coming to exhaustion, set the Buy / Sell Retracement Floor=80 to 95. Price will most likely retreat after pushing higher above the green dotted box or below the red dotted box.
The Price Elevator indicator is best suited to work with Renko Charts where the noise is greatly reduced.
🔥🔥🔥🔥🔥 Price Elevator MT5 >https://www.mql5.com/en/market/product/82757
🔥🔥🔥🔥🔥 Price Elevator MT4 >https://www.mql5.com/en/market/product/82760
👉 Download other indicators: https://www.mql5.com/en/users/pipmontra/seller

The Price Elevator indicator is developed to help you figure out the general long-term trend of the market. If the price is above the Green separator line, this is a clear indication the bulls are in control. Similarly, the bears are in control if the price continues to trend below the red separator line. Download Price Elevator MT4 Trend Re-entry In this case you would plan your buy entries above the green dotted box (make sure to set the Buy / Sell Retracement Floor=30). The SL
The Price Elevator indicator is developed to help you figure out the general long-term trend of the market. If the price is above the Green separator line, this is a clear indication the bulls are in control. Similarly, the bears are in control if the price continues to trend below the red separator line. Download Price Elevator MT5 Trend Re-entry In this case you would plan your buy entries above the green dotted box (make sure to set the Buy / Sell Retracement Floor=30). The SL
New Update: It now draws Critical Boxes as support/resistance areas.
It works with all the all assets and visually shows you the instances when the market is either ranging or trending.
Informs when the price has finished a retracement, an opportune time to re-enter the trend early. This will help you in position management.
It works very well for Scalping, Day trading, and Swing trading. Helpful in all timeframes
Great tool for every trader.
Features:
If Disable Histograms=true. This disables the Histograms.
The indicator then displays only the Short-term/Fast Signal lines, the Multi-timeframe Long-term Signal lines, and levels -20, 0, 20, and colored Dots.
BUY: After the LightGreen dot forms, but wait for the candle to open above the YellowGreen box on the chart.
OR After the Red dot forms, but a candle open above the Red box on the chart.
SELL: After the Red dot forms, but wait for the candle to open below the Red box on the chart.
OR After the YellowGreen dot forms, but a candle open below the YellowGreen box on the chart.
If Disable Histograms=false. This displays the Histograms, both signal lines and levels -30, 0, and 30
When the Histograms are drawn on a section of the indicator, the market is either entering ranging state or changing direction.
If there are no histograms being drawn, the market has started to trend.
BUY:
If both the short-term and the Long-term signal lines are above 0 , but wait for the candle to open above the YellowGreen box on the chart.
OR If both the short-term and the Long-term signal lines are below 0 , but a candle open above the Red box on the chart.
SELL:
If both the short-term and the Long-term signal lines are below 0 , but wait for the candle to open below the Red box on the chart.
OR If both the short-term and the Long-term signal lines are above 0 , but a candle open below the YellowGreen box on the chart.
👉 Ranging Market Detector: https://www.mql5.com/en/market/product/66062
🔥🔥🔥🔥🔥 Download other indicators: https://www.mql5.com/en/users/pipmontra/seller

The True Oversold Overbought indicator provides you with ability to swiftly check whether the asset is oversold or overbought.
Other than complementing your trading with True Oversold Overbought, you can use the indicator as your only trading system.
It works with all forex instruments and will save you the headache of estimating when the market is due for a reversal or retracement.
When the "Super Charge" feature is enabled, the areas where the price is in oversold/overbought status are amplified to give you a clear state of the market,therefore, you will not miss the moment to prepare for a reversal/retracement.
Alternatively, when the "Super Charge" feature is disabled, the indicator still shows the oversold and overbought levels but this time you get a broader view of the market.
Advantages
✔️It is not overly sensitive or keep touching oversold/overbought levels.
✔️Open trades early when the price is exiting overbought / oversold levels and close trades at the right time.
✔️Trade when there is noise and when the market is silent.
✔️No complex settings since the default settings work perfectly.
✔️The indicator displays on the separate window and also show rectangles on the main chart.
✔️When the overbought and oversold rectangles draw, it is time to buy if price opens above the rectangles and sell if the candle opens below.
Note: If the overbought rectangle is formed but a candle open above it, its an indication the trend will continue surging for a while before breaking below.
Similarly, the continued drop in price below the oversold rectangle indicates the price might continue in the same direction before bulls takes control.
⭐️⭐️⭐️⭐️⭐️True Oversold Overbought MT5: https://www.mql5.com/en/market/product/79336
⭐️⭐️⭐️⭐️⭐️True Oversold Overbought MT4: https://www.mql5.com/en/market/product/68396
🔥🔥🔥🔥🔥 Download other indicators: https://www.mql5.com/en/users/pipmontra/seller
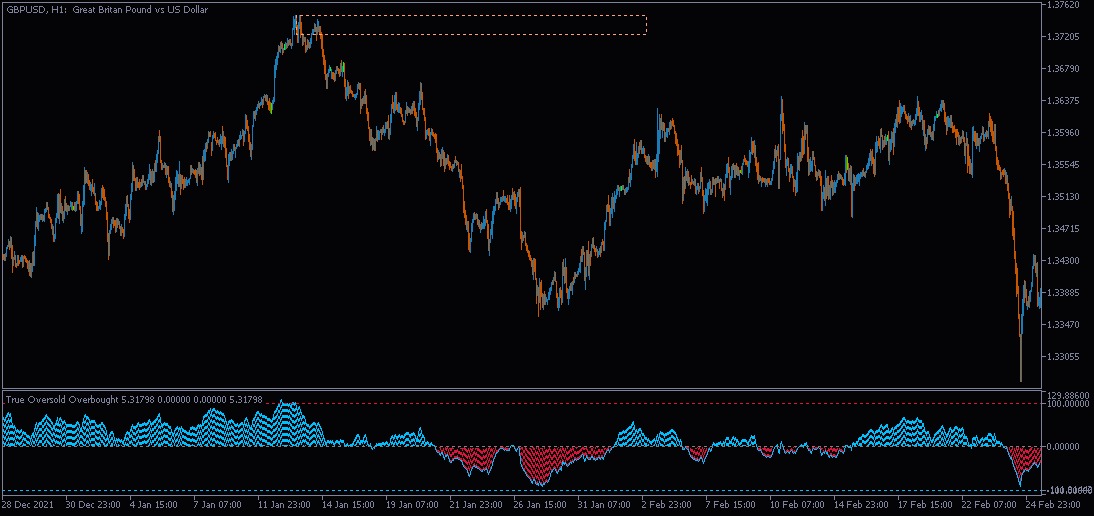
Don't follow the market blindly. The True Oversold Overbought indicator (mt4/5) indicates for you when the truly oversold or overbought. Besides, it gives allows you to trade breakouts if the market is about to break or obey these levels.
The True Oversold Overbought indicator provides you with ability to swiftly check whether the asset is oversold or overbought.
Other than complementing your trading with True Oversold Overbought, you can use the indicator as your only trading system.
It works with all forex instruments and will save you the headache of estimating when the market is due for a reversal or retracement.
When the "Super Charge" feature is enabled, the areas where the price is in oversold/overbought status are amplified to give you a clear state of the market,therefore, you will not miss the moment to prepare for a reversal/retracement.
Alternatively, when the "Super Charge" feature is disabled, the indicator still shows the oversold and overbought levels but this time you get a broader view of the market.
Advantages
✔️It is not overly sensitive or keep touching oversold/overbought levels.
✔️Open trades early when the price is exiting overbought / oversold levels and close trades at the right time.
✔️Trade when there is noise and when the market is silent.
✔️No complex settings since the default settings work perfectly.
✔️The indicator displays on the separate window and also show rectangles on the main chart.
✔️When the overbought and oversold rectangles draw, it is time to buy if price opens above the rectangles and sell if the candle opens below.
Note: If the overbought rectangle is formed but a candle open above it, its an indication the trend will continue surging for a while before breaking below.
Similarly, the continued drop in price below the oversold rectangle indicates the price might continue in the same direction before bulls takes control.
⭐️⭐️⭐️⭐️⭐️True Oversold Overbought MT5: https://www.mql5.com/en/market/product/79336
⭐️⭐️⭐️⭐️⭐️True Oversold Overbought MT4: https://www.mql5.com/en/market/product/68396
🔥🔥🔥🔥🔥 Download other indicators: https://www.mql5.com/en/users/pipmontra/seller

Don't follow the market blindly. The True Oversold Overbought indicator (mt4/5) indicates for you when the truly oversold or overbought. Besides, it gives allows you to trade breakouts if the market is about to break or obey these levels.
The True Oversold Overbought indicator provides you with ability to swiftly check whether the asset is oversold or overbought.
Other than complementing your trading with True Oversold Overbought, you can use the indicator as your only trading system.
It works with all forex instruments and will save you the headache of estimating when the market is due for a reversal or retracement.
When the "Super Charge" feature is enabled, the areas where the price is in oversold/overbought status are amplified to give you a clear state of the market,therefore, you will not miss the moment to prepare for a reversal/retracement.
Alternatively, when the "Super Charge" feature is disabled, the indicator still shows the oversold and overbought levels but this time you get a broader view of the market.
Advantages
✔️It is not overly sensitive or keep touching oversold/overbought levels.
✔️Open trades early when the price is exiting overbought / oversold levels and close trades at the right time.
✔️Trade when there is noise and when the market is silent.
✔️No complex settings since the default settings work perfectly.
✔️The indicator displays on the separate window and also show rectangles on the main chart.
✔️When the overbought and oversold rectangles draw, it is time to buy if price opens above the rectangles and sell if the candle opens below.
Note: If the overbought rectangle is formed but a candle open above it, its an indication the trend will continue surging for a while before breaking below.
Similarly, the continued drop in price below the oversold rectangle indicates the price might continue in the same direction before bulls takes control.
⭐️⭐️⭐️⭐️⭐️True Oversold Overbought MT5: https://www.mql5.com/en/market/product/79336
⭐️⭐️⭐️⭐️⭐️True Oversold Overbought MT4: https://www.mql5.com/en/market/product/68396
🔥🔥🔥🔥🔥 Download other indicators: https://www.mql5.com/en/users/pipmontra/seller

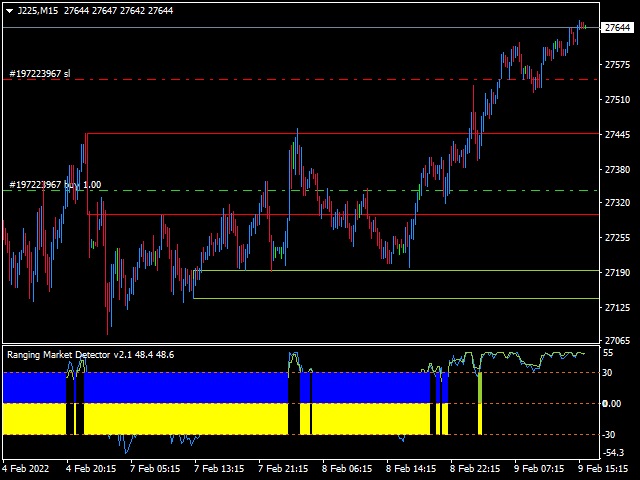
Ranging Market Detector scans the market for momentum and price to check whether the price is range-bound and the direction to which it will breakout.
New Update: It now draws Critical Boxes as support/resistance areas.
It works with all the all assets and visually shows you the instances when the market is either ranging or trending.
Informs when the price has finished a retracement, an opportune time to re-enter the trend early. This will help you in position management.
It works very well for Scalping, Day trading, and Swing trading. Helpful in all timeframes
Great tool for every trader.
Features:
If Disable Histograms=true. This disables the Histograms.
The indicator then displays only the Short-term/Fast Signal lines, the Multi-timeframe Long-term Signal lines, and levels -20, 0, 20, and colored Dots.
BUY: After the LightGreen dot forms, but wait for the candle to open above the YellowGreen box on the chart.
OR After the Red dot forms, but a candle open above the Red box on the chart.
SELL: After the Red dot forms, but wait for the candle to open below the Red box on the chart.
OR After the YellowGreen dot forms, but a candle open below the YellowGreen box on the chart.
If Disable Histograms=false. This displays the Histograms, both signal lines and levels -30, 0, and 30
When the Histograms are drawn on a section of the indicator, the market is either entering ranging state or changing direction.
If there are no histograms being drawn, the market has started to trend.
BUY:
If both the short-term and the Long-term signal lines are above 0 , but wait for the candle to open above the YellowGreen box on the chart.
OR If both the short-term and the Long-term signal lines are below 0 , but a candle open above the Red box on the chart.
SELL:
If both the short-term and the Long-term signal lines are below 0 , but wait for the candle to open below the Red box on the chart.
OR If both the short-term and the Long-term signal lines are above 0 , but a candle open below the YellowGreen box on the chart.
👉 Ranging Market Detector: https://www.mql5.com/en/market/product/66062
🔥🔥🔥🔥🔥 Download other indicators: https://www.mql5.com/en/users/pipmontra/seller
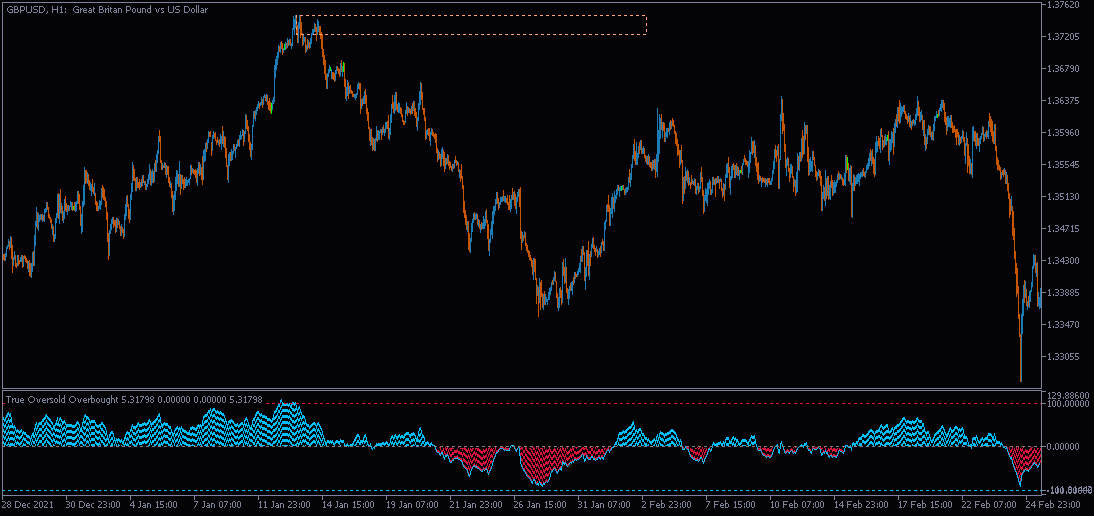
The True Oversold Overbought indicator provides you with ability to swiftly check whether the asset is oversold or overbought.
Other than complementing your trading with True Oversold Overbought, you can use the indicator as your only trading system.
It works with all forex instruments and will save you the headache of estimating when the market is due for a reversal or retracement.
When the "Super Charge" feature is enabled, the areas where the price is in oversold/overbought status are amplified to give you a clear state of the market,therefore, you will not miss the moment to prepare for a reversal/retracement.
Alternatively, when the "Super Charge" feature is disabled, the indicator still shows the oversold and overbought levels but this time you get a broader view of the market.
Advantages
✔️It is not overly sensitive or keep touching oversold/overbought levels.
✔️Open trades early when the price is exiting overbought / oversold levels and close trades at the right time.
✔️Trade when there is noise and when the market is silent.
✔️No complex settings since the default settings work perfectly.
✔️The indicator displays on the separate window and also show rectangles on the main chart.
✔️When the overbought and oversold rectangles draw, it is time to buy if price opens above the rectangles and sell if the candle opens below.
Note: If the overbought rectangle is formed but a candle open above it, its an indication the trend will continue surging for a while before breaking below.
Similarly, the continued drop in price below the oversold rectangle indicates the price might continue in the same direction before bulls takes control.
⭐️⭐️⭐️⭐️⭐️True Oversold Overbought MT5: https://www.mql5.com/en/market/product/79336
⭐️⭐️⭐️⭐️⭐️True Oversold Overbought MT4: https://www.mql5.com/en/market/product/68396
🔥🔥🔥🔥🔥 Download other indicators: https://www.mql5.com/en/users/pipmontra/seller
The True Oversold Overbought indicator provides you with ability to swiftly check whether the asset is oversold or overbought.
Other than complementing your trading with True Oversold Overbought, you can use the indicator as your only trading system.
It works with all forex instruments and will save you the headache of estimating when the market is due for a reversal or retracement.
When the "Super Charge" feature is enabled, the areas where the price is in oversold/overbought status are amplified to give you a clear state of the market,therefore, you will not miss the moment to prepare for a reversal/retracement.
Alternatively, when the "Super Charge" feature is disabled, the indicator still shows the oversold and overbought levels but this time you get a broader view of the market.
Advantages
✔️It is not overly sensitive or keep touching oversold/overbought levels.
✔️Open trades early when the price is exiting overbought / oversold levels and close trades at the right time.
✔️Trade when there is noise and when the market is silent.
✔️No complex settings since the default settings work perfectly.
✔️The indicator displays on the separate window and also show rectangles on the main chart.
✔️When the overbought and oversold rectangles draw, it is time to buy if price opens above the rectangles and sell if the candle opens below.
Note: If the overbought rectangle is formed but a candle open above it, its an indication the trend will continue surging for a while before breaking below.
Similarly, the continued drop in price below the oversold rectangle indicates the price might continue in the same direction before bulls takes control.
⭐️⭐️⭐️⭐️⭐️True Oversold Overbought MT5: https://www.mql5.com/en/market/product/79336
⭐️⭐️⭐️⭐️⭐️True Oversold Overbought MT4: https://www.mql5.com/en/market/product/68396
🔥🔥🔥🔥🔥 Download other indicators: https://www.mql5.com/en/users/pipmontra/seller

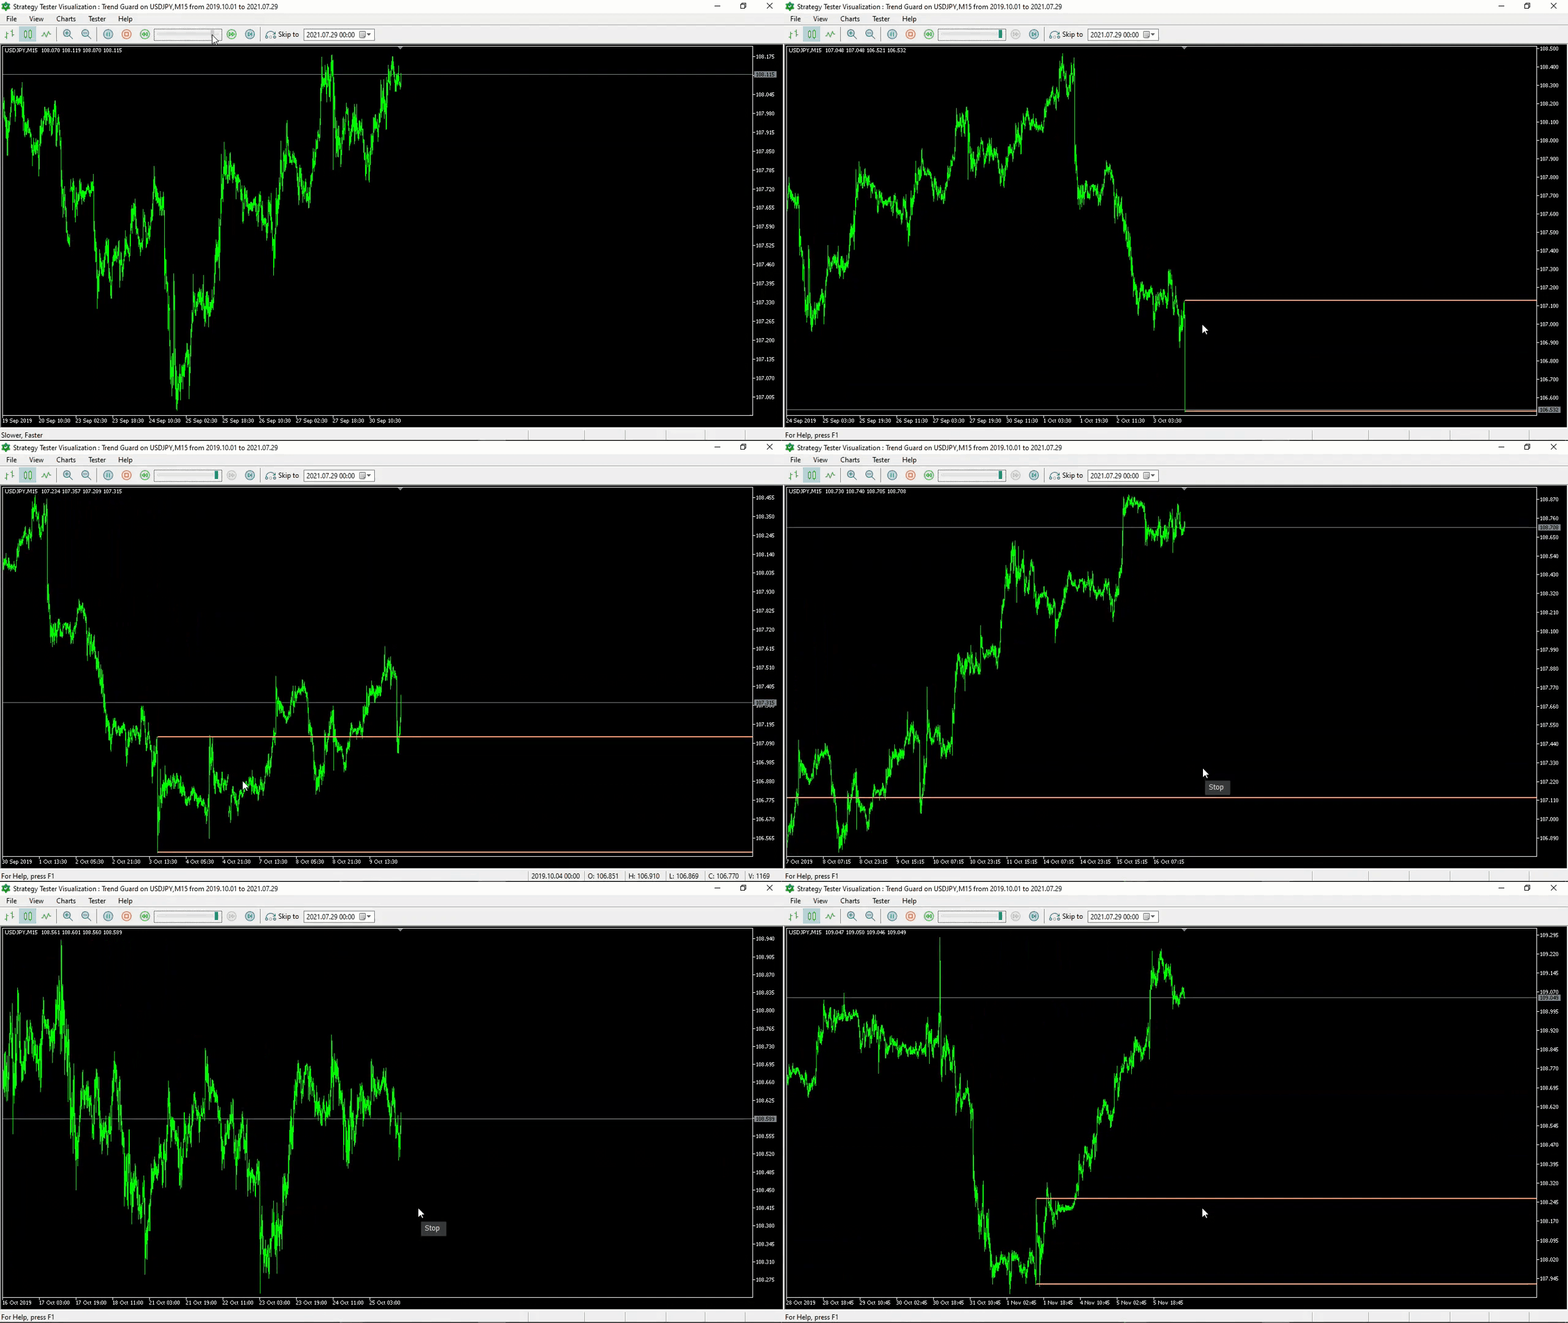
The indicator is useful to all traders since it checks for retracements and changing trend direction. With this indicator, you get the opportunity to open trades early and also lock your profits based on the dotted trend lines that form after a certain level of Bollinger band.
We have simplified the indicator be eliminating most input details for any trader to experience the benefits.
Advantages
✔️ Shows you when to enter a trade and lock your profit
✔️ Allows you to add tight stop loss. You just add the SL just above the trendline if you have an active sell or below the trendline if it is a buy.
✔️ Exit your trades early incase of ranging market. If the trade lock trendlines form close to the trade entry areas, the market has started to range,therefore, exit early.
✔️ Can act as Support/Resistance
⭐️⭐️⭐️⭐️⭐️ Trend Guard MT5:https://www.mql5.com/en/market/product/77842
⭐️⭐️⭐️⭐️⭐️ Trend Guard MT4: https://www.mql5.com/en/market/product/77841
🔥🔥🔥🔥🔥 Download other indicators: https://www.mql5.com/en/users/pipmontra/seller
The True Oversold Overbought indicator provides you with ability to swiftly check whether the asset is oversold or overbought.
Other than complementing your trading with True Oversold Overbought, you can use the indicator as your only trading system.
It works with all forex instruments and will save you the headache of estimating when the market is due for a reversal or retracement.
When the "Super Charge" feature is enabled, the areas where the price is in oversold/overbought status are amplified to give you a clear state of the market,therefore, you will not miss the moment to prepare for a reversal/retracement.
Alternatively, when the "Super Charge" feature is disabled, the indicator still shows the oversold and overbought levels but this time you get a broader view of the market.
Advantages
✔️It is not overly sensitive or keep touching oversold/overbought levels.
✔️Open trades early when the price is exiting overbought / oversold levels and close trades at the right time.
✔️Trade when there is noise and when the market is silent.
✔️No complex settings since the default settings work perfectly.
✔️The indicator displays on the separate window and also show rectangles on the main chart.
✔️When the overbought and oversold rectangles draw, it is time to buy if price opens above the rectangles and sell if the candle opens below.
Note: If the overbought rectangle is formed but a candle open above it, its an indication the trend will continue surging for a while before breaking below.
Similarly, the continued drop in price below the oversold rectangle indicates the price might continue in the same direction before bulls takes control.
⭐️⭐️⭐️⭐️⭐️True Oversold Overbought MT5: https://www.mql5.com/en/market/product/79336
⭐️⭐️⭐️⭐️⭐️True Oversold Overbought MT4: https://www.mql5.com/en/market/product/68396
🔥🔥🔥🔥🔥 Download other indicators: https://www.mql5.com/en/users/pipmontra/seller


