• Información general
  • Comentarios
  • Discusión

Trend Enthusiasm Indicator

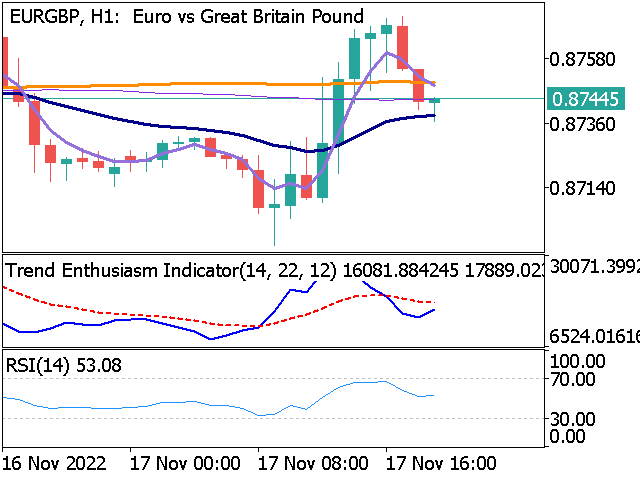
Presentamos el indicador Trend Enthusiasm (TEI), la herramienta definitiva para maximizar las ganancias en el parqué.

Este indicador innovador combina el poder del análisis de tendencias con la emoción del sentimiento del mercado, brindando a los operadores una ventaja única en los mercados financieros en constante cambio.

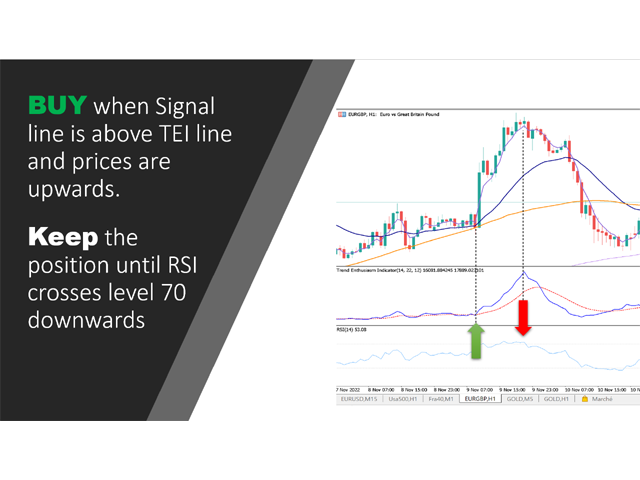
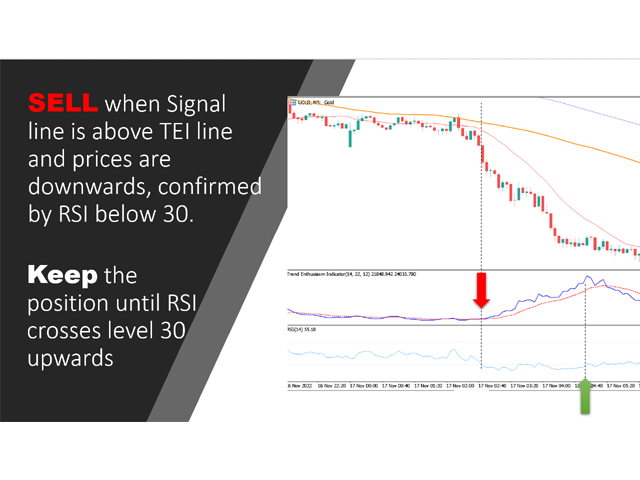
El TEI utiliza algoritmos avanzados para analizar la tendencia subyacente de un instrumento financiero y el entusiasmo de los comerciantes para identificar oportunidades de alto beneficio. Esto permite a los operadores capitalizar la fuerza combinada de la tendencia y el sentimiento de los operadores, lo que garantiza ganancias constantes con un riesgo mínimo.

Tanto si es un profesional experimentado como si acaba de empezar, el TEI es la herramienta ideal para cualquiera que busque maximizar sus ganancias y mantenerse a la vanguardia. ¡Pruébelo hoy y comience a realizar operaciones más inteligentes y rentables!

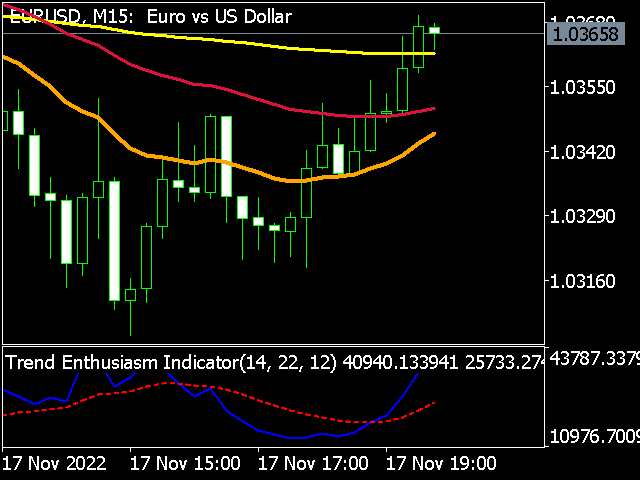
El indicador funciona en todos los marcos de tiempo y no se vuelve a pintar.
Productos recomendados
The new update makes this indicator a complete tool for studying, analyzing and operating probabilistic patterns. It includes: On-chart Multi-asset percentage monitor. Configurable martingales. Twenty-one pre-configured patterns, including Mhi patterns and C3. An advanced pattern editor to store up to 5 custom patterns. Backtest mode to test results with loss reports. Trend filter. Hit operational filter. Martingale Cycles option. Various types of strategies and alerts. Confluence between patter
Mean Reversal Heikin Ashi Indicator calculates special trade reversal points based on Heikin Ashi candlesticks patterns. This indicator can be used on all symbols, even in Forex or B3 Brazillian Markets. You can configure just the position of each arrow. Then, after include the indicator on the graphic, pay attention on each arrow that indicates a long or short trade.
CoioteCandlePVA
Alexandre Moraes De Souza Lima
Candle com coloração de Volume Price Analysis  (VPA) segundo as definições da Anna Coulling, é possível configurar períodos de  climax e rising, fator de extreme e fator de rising. Pode-se usar volume real ou volume de ticks. O VPA considera a variação de preço por volume do período, indicando se um movimento está recebendo ignição, está em seu climax ou se já não existe mais interesse.
FREE
Xtrade Trend Detector
Dago Elkana Samuel Dadie
Xtrade Trend Detector is an indicator capable of finding the best opportunities to take a position in any stock market. Indeed, it is a great tool for scalpers but also for Daytraders. You could therefore use it to identify areas to trade, it fits easily on a chart. I use it to detect trends on Big timeframes and take positions on Small timeframes. Don't hesitate to give me a feedback if you test it.
Niubility Trend  Niubility Trend  displays the trend direction for all time frames in real time. You'll see at a glance at which direction the trends are running, how long they last and how powerful they are. All this makes it an easy-to-use trend trading system for beginners, advanced and professional traders. Features Easy to trade Customizable colors and sizes It is non-repainting and non-backpainting It is fantastic as a trailing stop method It implements alerts of all kinds
A useful scanner/dashboard that shows the RSI values for multiple symbols and Time-frames. It can be easily hidden/displayed with a simple click on the scanner man top left of the dashboard. You can input upper and lower RSI values and the colours can be set to show when above/below these values. The default values are 70 and 30. There are also input colours for when the RSI is above or below 50 (but not exceeding the upper/lower levels Symbols and time-frames are input separated by commas.
TilsonT3
Jonathan Pereira
La media móvil T3 de Tillson se introdujo al mundo del análisis técnico en el artículo '' A Better Moving Average '', publicado en la revista estadounidense Technical Analysis of Stock Commodities. Desarrollada por Tim Tillson, los analistas y operadores de los mercados de futuros pronto quedaron fascinados con esta técnica que suaviza las series de precios al tiempo que disminuye el retraso (lag) típico de los sistemas de seguimiento de tendencias.
FREE
QuantumAlert Stoch Navigator is a free indicator available for MT4/MT5 platforms, its work is to provide "alerts" when the market is inside "overbought and oversold" regions in the form of "buy or sell" signals. This indicator comes with many customization options mentioned in the parameter section below, user can customise these parameters as needful. Join our   MQL5 group , where we share important news and updates. You are also welcome to join our private channel as well, contact me for the p
FREE
INDICADOR basado en INTELIGENCIA ARTIFICIAL que genera posibles entradas de compra y venta de opciones binarias. El indicador funciona con 3 estrategias diferentes: 1) al leer volúmenes, envía una señal cuando el precio debería revertirse 2) a través de la divergencia entre precio y volumen, envía una señal de cuándo la tendencia debe continuar o revertirse 3) a través de la convergencia entre precio y volumen, envía una señal de cuándo debe continuar la tendencia. el indicador fu
Adaptive Trend Lines
Henri Salvatore Bigatti
4.74 (27)
This indicator shows the TLH and TLL and some trendlines that allow us to estimate the trend of market.  It also shows the values of the angles of the lines in percentage in points (pip) , the standard deviation, and the trend of each line, and when it breaks the lines of support and resistance (TLH and TLL). And finally, it also shows the points identified as supports and resistances through the fractal algorithm in the graph. The high and low trend lines are supported by the highs and lows, th
FREE
Introduction to Fractal Pattern Scanner Fractal Indicator refers to the technical indicator that makes use of the fractal geometry found in the financial market. Fractal Pattern Scanner is the advanced Fractal Indicator that brings the latest trading technology after the extensive research and development work in the fractal geometry in the financial market. The most important feature in Fractal Pattern Scanner is the ability to measure the turning point probability as well as the trend probabil
The Antique Trend Indicator is a revolutionary trend trading and filtering solution with all the important features of a trend tool built into one tool! The Antique Trend indicator is good for any trader, suitable for any trader both for Forex and binary options. There is no need to configure anything, everything has been perfected by time and experience, it works great during flats and trends. The Antique Trend indicator is a tool for technical analysis of financial markets, reflecting curre
Follow The Line MT5
Oliver Gideon Amofa Appiah
4.42 (31)
This indicator obeys the popular maxim that: "THE TREND IS YOUR FRIEND" It paints a GREEN line for BUY and also paints a RED line for SELL. (you can change the colors). It gives alarms and alerts of all kinds. IT DOES NOT REPAINT and can be used for all currency pairs and timeframes. Yes, as easy and simple as that. Even a newbie can use it to make great and reliable trades. NB: For best results, get my other premium indicators for more powerful and reliable signals. Get them here: https://www.m
FREE
The best time to trade Using this Indicator is when the time reach exactly hour,half,45 minutes,15 minutes and sometimes 5 minutes.. This indicators is helpful to those who trade boom and crash indecies.How to read this indicator first you'll see Blue allow and Red allow all these allows used to indicate or to detect the spike which will happen so the allow happens soon before the spike happen.This indicator works properly only in boom and crash trading thing which you have to consider when
Super Trend eu
Emin Ulucanli
4.75 (4)
SUPERTREND; Es un indicador de seguimiento de tendencias basado en el SuperTrend ATR creado por Olivier Seban. Se puede utilizar para detectar cambios en la dirección de la tendencia y localizar paradas. Cuando el precio cae por debajo de la curva del indicador, se vuelve rojo e indica una tendencia bajista. Por el contrario, cuando el precio se mueve por encima de la curva, el indicador se vuelve verde, lo que indica una tendencia alcista. Al igual que otros indicadores, funciona bien en SuperT
FREE
El indicador ayuda a entrar en una operación siguiendo la tendencia, al mismo tiempo, después de alguna corrección. Encuentra fuertes movimientos de tendencia de un par de divisas en un número determinado de barras y también encuentra niveles de corrección para esta tendencia. Si la tendencia es lo suficientemente fuerte y la corrección se vuelve igual a la especificada en los parámetros, entonces el indicador lo señala. Puede establecer diferentes valores de corrección, 38, 50 y 62 (niveles de
This indicator will draw patterns based on   Rob Smith's   The Strat   as they emerge in real time on your chart. As price evolves,   TheStrat   offers 18 distinct price action patterns that can help you get good entries in the market. Each pattern involves two or three candles, and this indicator will draw a bounding box around the candles and name the pattern. The indicator also shows when a potential setup is forming, known by stratters as an Actionable signal. Candles Each candle is de
Go Binary
Fabio Oliveira Magalhaes
The main idea of this product is to generate statistics based on signals from 5 different strategies for the Binary Options traders, showing how the results would be and the final balance based on broker's payout. Strategy 1: The calculation is secret. Strategy 2: The signal is based on a sequence of same side candles (same color). Strategy 3: The signal is based on a sequence of interspersed candles (opposite colors). Strategy 4: The signal consists of the indicators bollinger (we have 3 typ
The   Bullish Harami candlestick pattern   is formed by two candles. Here’s how to identify the Bullish Harami candlestick pattern: The first candle must be bearish and have a big body The second candle must be small and bullish The second candle is inside the body of the first candle This 2-candle bullish candlestick pattern is a reversal pattern, meaning that it’s used to find bottoms. For this reason, we want to see this pattern after a move to the downside, showing that bulls are starting to
Best SAR MT5
Ashkan Hazegh Nikrou
5 (1)
Descripción :  nos complace presentar nuestro nuevo indicador gratuito basado en uno de los indicadores profesionales y populares en el mercado de divisas (PSAR). Este indicador es una nueva modificación del indicador Parabolic SAR original. En el indicador pro SAR puede ver el cruce entre puntos y el gráfico de precios. el cruce no es una señal, pero habla sobre el final del potencial de movimiento, puede comenzar a comprar con un nuevo punto azul y colocar un límite de pérdidas un atr antes
FREE
Trade Extractor MT5
Philip Pankaj Suthagar
2 (1)
TRADE EXTRACTOR   is the fastest self-learning AI Algorithm, which will learn any market situation with ease.As a Manual trader, I came across the difficulty of finding the right parameter and the right condition to trade. There are infinite combinations of indicators and objects(trendlines, gann grid, fibo levels etc) which as an human, I can’t decide their winning rate or performance. Many claim to have a winning strategy but won’t have enough statistical support to prove their claims. Due to
The indicator for trading on the signals of the harmonic pattern AB=CD. It gives signals and shows the levels of entry into the market, as well as levels for placing stop orders, which allows the trader to make timely decisions on entering the market, as well as effectively manage positions and orders. It supports sending push notifications to a mobile device, e-mail, as well as alerts. This indicator has been ported from the version for MetaTrader 4. For more information, as well as a detailed
Quarter EMA
Jithin Sajan Sajan
5 (1)
Kindly rate and comment about the product for upgradation & Support The 5 EMA is plotted in green color ( Lime ). The 14 EMA is plotted in red color ( Red ). The 20 EMA is plotted in blue color ( Blue ). The 200 EMA is plotted in yellow color ( Yellow ). The Quarter EMA that provided calculates and plots four Exponential Moving Averages (EMAs) on the chart using different periods: 5, 14, 20, and 200. Each EMA is represented by a different color on the chart. Here's a description of each
FREE
Quintet EMA
Jithin Sajan Sajan
Kindly rate and comment about the product for upgradation & Support The   5 EMA   is plotted in   green   color ( Lime ). The  14 EMA  is plotted in  red  color ( Red ). The   20 EMA   is plotted in   blue   color ( Blue ). The  200 EMA  is plotted in  black  color ( Black ). The   200 EMA   is plotted in   yellow   color ( Yellow ). The Quarter EMA that provided calculates and plots four Exponential Moving Averages (EMAs) on the chart using different periods: 5, 14, 20, and 200. Each EMA
FREE
The Rocket Trend indicator is trending. The indicator draws two-color points connected by lines along the chart. This is a trend indicator, it is an algorithmic indicator. It is easy to work and understand when a blue circle appears, you need to buy, when a red one appears, sell. The indicator is used for scalping and pipsing, and has proven itself well. Rocket Trend is available for analyzing the direction of the trend for a specific period of time. Ideal for novice traders learning the laws o
KT Horizontal Lines MT5
KEENBASE SOFTWARE SOLUTIONS
In MetaTrader, plotting multiple   horizontal lines   and then tracking their respective price levels can be a hassle. This indicator automatically plots multiple horizontal lines at equal intervals for setting price alerts, plotting support and resistance levels, and other manual purposes. This indicator is suitable for Forex traders who are new and looking for chances to make quick profits from buying and selling. Horizontal lines can help traders find possible areas to start trading when the
Impulse fractals indicator - is counter-trend oriented complex market fractal pattern.  Market creates bull/bear impulse, trend starts, fractals on impulsed wave are an agressive pullback signals. Buy arrow is plotted when market is bearish and it's impulse showed up-side fractal, and sell arrow is plotted when market is bullish and it's impulse showed dn-side fractal. Main indicator's adjustable inputs : impulsePeriod - main period of impulse histogram  filterPeriod  - smoothes impulse accordi
Fibrillar
Vitalii Zakharuk
It is very easy to use the Fibrillar indicator, since the simplest is to look at the chart and act according to the indications of the colored arrows. The algorithm takes into account the measurement of prices, and this method also focuses on measuring each of the price drops (H / C, H / O, LC, LO) - which gives more detailed information, but also more averaged. When calculating this indicator, logarithmic gains are first calculated at the closing price, which allows you to filter out the tre
This is the famous Sunflower indicator for Metatrader5. This indicator marks possible tops and bottoms on price charts. The indicator identifies tops and bottoms in the asset's price history, keep in mind that the current sunflower of the last candle repaints, as it is not possible to identify a top until the market reverses and it is also not possible to identify a bottom without the market stop falling and start rising. If you are looking for a professional programmer for Metatrader5, please
Tops and Bottoms Indicator
Josue De Matos Silva
4.83 (6)
Tops & Bottoms Indicator FREE   Tops abd Bottoms:   An effective indicator for your trades The tops and bottoms indicator helps you to find  ascending and descending channel formations with indications of ascending and/or descending tops and bottoms. In addition, it  show possibles  opportunities with a small yellow circle when the indicator encounters an impulse formation. This indicator provide to you  more security and speed in making entry decisions. Also test our FREE advisor indicator:
FREE
Los compradores de este producto también adquieren
Atomic Analyst MT5
Issam Kassas
5 (15)
En primer lugar, vale la pena enfatizar que este Indicador de Trading no repinta, no redibuja y no se retrasa, lo que lo hace ideal tanto para el trading manual como para el automatizado. Manual del usuario: configuraciones, entradas y estrategia. El Analista Atómico es un Indicador de Acción del Precio PA que utiliza la fuerza y el impulso del precio para encontrar una mejor ventaja en el mercado. Equipado con filtros avanzados que ayudan a eliminar ruidos y señales falsas, y aumentan el poten
Primero que todo, vale la pena enfatizar que este Sistema de Trading es un Indicador No Repintado, No Redibujado y No Retrasado, lo que lo hace ideal tanto para el trading manual como para el automatizado. Curso en línea, manual y descarga de ajustes preestablecidos. El "Sistema de Trading Inteligente MT5" es una solución completa de trading diseñada para traders nuevos y experimentados. Combina más de 10 indicadores premium y presenta más de 7 estrategias de trading robustas, lo que lo convie
Quantum Trend Sniper
Bogdan Ion Puscasu
5 (46)
Introduciendo       Indicador Quantum Trend Sniper   , el innovador indicador MQL5 que está transformando la forma en que identificas y negocias los cambios de tendencia. Desarrollado por un equipo de comerciantes experimentados con experiencia comercial de más de 13 años,       Indicador de francotirador de tendencia cuántica       está diseñado para impulsar su viaje comercial a nuevas alturas con su forma innovadora de identificar cambios de tendencia con una precisión extremadamente alta.
Este es un genial indicador para MT5 que ofrece señales precisas para entrar en una transacción sin redibujar. Se puede aplicar a cualquier activo financiero: fórex, criptomonedas, metales, acciones, índices. Nos dará valoraciones bastante precisas y nos dirá cuándo es mejor abrir y cerra una transacción. Eche un vistazo  al vídeo  (6:22), ¡contiene un ejemplo de procesamiento de una sola señal que ha amortizado el indicador! La mayoría de los tráders mejoran sus resultados comerciales durante l
Gold Stuff mt5
Vasiliy Strukov
4.9 (181)
Gold Stuff mt5: un indicador de tendencia diseñado específicamente para el oro, también se puede usar en cualquier instrumento financiero. El indicador no se vuelve a dibujar ni se retrasa. El marco de tiempo recomendado es H1. IMPORTANTE! Póngase en contacto conmigo inmediatamente después de la compra para obtener instrucciones y bonificación!   Puede obtener una copia gratuita de nuestro indicador Strong Support y Trend Scanner, por favor envíe un mensaje privado. ¡a mí! PARÁMETROS Draw
AT Forex Indicator MT5
Marzena Maria Szmit
5 (4)
The AT Forex Indicator MT5 is a sophisticated trading tool designed to provide traders with a comprehensive analysis of multiple currency pairs. This powerful indicator simplifies the complex nature of the forex market, making it accessible for both novice and experienced traders. AT Forex Indicator uses advanced algorithms to detect trends, patterns and is an essential tool for traders aiming to enhance their forex trading performance. With its robust features, ease of use, and reliable signal
Reversal First Impulse levels (RFI)      INSTRUCTIONS        RUS       -       ENG              R ecommended to use with an indicator   -   TPSpro  TREND PRO -  Version MT4                 A key element in trading is zones or levels from which decisions to buy or sell a trading instrument are made. Despite attempts by major players to conceal their presence in the market, they inevitably leave traces. Our task was to learn how to identify these traces and interpret them correctly. Main functi
Trend Screener Pro MT5
STE S.S.COMPANY
4.88 (66)
Desbloquee el poder del comercio de tendencias con el indicador Trend Screener: ¡su solución definitiva para el comercio de tendencias impulsada por lógica difusa y un sistema multidivisa!Mejore su comercio de tendencias con Trend Screener, el revolucionario indicador de tendencias impulsado por lógica difusa. Es un poderoso indicador de seguimiento de tendencias que combina más de 13 herramientas y funciones premium y 3 estrategias comerciales, lo que lo convierte en una opción versátil para co
FX Power MT5 NG
Daniel Stein
5 (5)
Obtenga su actualización diaria del mercado con detalles y capturas de pantalla a través de nuestro Morning Briefing aquí en mql5 y en Telegram ! FX Power MT5 NG es la nueva generación de nuestro popular medidor de fuerza de divisas, FX Power. ¿Y qué ofrece este medidor de fuerza de nueva generación? Todo lo que le encantaba del FX Power original PLUS Análisis de fuerza de ORO/XAU Resultados de cálculo aún más precisos Períodos de análisis configurables individualmente Límite de cálculo persona
FX Volume MT5
Daniel Stein
4.94 (17)
Obtenga su actualización diaria del mercado con detalles y capturas de pantalla a través de nuestro Morning Briefing aquí en mql5 y en Telegram ! FX Volume es el PRIMER y ÚNICO indicador de volumen que proporciona una visión REAL del sentimiento del mercado desde el punto de vista de un bróker. Proporciona una visión impresionante de cómo los participantes institucionales del mercado, como los brokers, están posicionados en el mercado Forex, mucho más rápido que los informes COT. Ver esta info
TPSproTREND PrO MT5
Roman Podpora
4.88 (8)
TPSpro TRENDPRO  - is a trend indicator that automatically analyzes the market and provides information about the trend and each of its changes, as well as giving signals for entering trades without redrawing! The indicator uses each candle, analyzing them separately. referring to different impulses - up or down impulse. Exact entry points into transactions for currencies, crypto, metals, stocks, indices!  -  Version MT4               DETAILED DESCRIPTION               R ecommended to use with
XQ Indicator MetaTrader 5
Marzena Maria Szmit
5 (1)
Step into the realm of Forex trading with confidence and precision using XQ, a cutting-edge Forex indicator designed to elevate your trading game to unprecedented heights. Whether you're a seasoned trader or just stepping into the world of currency exchange, XQ Forex Indicator empowers you with the insights and signals needed to make informed trading decisions. The signal conditions are a combination of three indicators, and XQ Forex Indicator only display  medium and long-term trends . The ind
Ante todo, vale la pena enfatizar que esta Herramienta de Trading es un Indicador No Repintado, No Redibujado y No Retrasado, lo que la hace ideal para el trading profesional. Curso en línea, manual del usuario y demostración. El Indicador de Conceptos de Acción del Precio Inteligente es una herramienta muy potente tanto para traders nuevos como experimentados. Combina más de 20 indicadores útiles en uno solo, combinando ideas avanzadas de trading como el Análisis del Trader del Círculo Inte
Introduciendo       Quantum Breakout PRO   , el innovador indicador MQL5 que está transformando la forma en que comercia con Breakout Zones. Desarrollado por un equipo de comerciantes experimentados con experiencia comercial de más de 13 años,       Desglose cuántico PRO       está diseñado para impulsar su viaje comercial a nuevas alturas con su innovadora y dinámica estrategia de zona de ruptura. El indicador de ruptura cuántica le dará flechas de señal en las zonas de ruptura con 5 zonas
TPA True Price Action indicator reveals the true price action of the market makers through 100% non-repainting signals strictly at the close of a candle! TPA shows entries and re-entries, every time the bulls are definitely stronger than the bears and vice versa. Not to confuse with red/green candles. The shift of power gets confirmed at the earliest stage and is ONE exit strategy of several. There are available now two free parts of the TPA User Guide for our customers. The first "The Basics"
Advanced Supply Demand MT5
Bernhard Schweigert
4.53 (15)
¡Actualmente con 33% de descuento! ¡La mejor solución para cualquier tráder principiante o experto! Este indicador es una herramienta comercial única, de alta calidad y asequible, porque incorpora una serie de características patentadas y una nueva fórmula. Con esta actualización, podrá mostrar zonas de doble marco temporal. No solo podrá mostrar un marco temporal más alto, sino también mostrar ambos, el marco temporal del gráfico MÁS el marco temporal más alto: MOSTRANDO ZONAS ANIDADAS. A todos
Conviértase en un Breaker Trader y obtenga beneficios de los cambios en la estructura del mercado a medida que se invierte el precio. El indicador de ruptura de bloque de órdenes identifica cuándo una tendencia o movimiento de precio se acerca al agotamiento y está listo para revertirse. Le alerta sobre cambios en la estructura del mercado que generalmente ocurren cuando una reversión o un retroceso importante están a punto de suceder. El indicador utiliza un cálculo patentado que identific
Was: $249  Now: $99   Market Profile defines a number of day types that can help the trader to determine market behaviour. A key feature is the Value Area, representing the range of price action where 70% of trading took place. Understanding the Value Area can give traders valuable insight into market direction and establish the higher odds trade. It is an excellent addition to any system you may be using. Inspired by Jim Dalton’s book “Mind Over Markets”, this indicator is designed to suit the
ICT, SMC, SMART MONEY CONCEPTS, SMART MONEY, Smart Money Concept, Support and Resistance, Trend Analysis, Price Action, Market Structure, Order Blocks, BOS/CHoCH,   Breaker Blocks ,  Momentum Shift,   Supply&Demand Zone/Order Blocks , Strong Imbalance,   HH/LL/HL/LH,    Fair Value Gap, FVG,  Premium  &   Discount   Zones, Fibonacci Retracement, OTE, Buy Side Liquidity, Sell Side Liquidity, BSL/SSL Taken, Equal Highs & Lows, MTF Dashboard, Multiple Time Frame, BigBar, HTF OB, HTF Market Structure
Matrix Arrow Indicator MT5
Juvenille Emperor Limited
5 (14)
Matrix Arrow Indicator MT5   es una tendencia única 10 en 1 que sigue un indicador   100% sin repintado   de marcos temporales múltiples que se puede usar en todos los símbolos/instrumentos:   divisas ,   materias primas ,   criptomonedas ,   índices ,   acciones .  Matrix Arrow Indicator MT5  determinará la tendencia actual en sus primeras etapas, recopilando información y datos de hasta 10 indicadores estándar, que son: Índice de movimiento direccional promedio (ADX) Índice de canales de prod
IX Power MT5
Daniel Stein
4 (4)
IX Power   lleva por fin la insuperable precisión de FX Power a los símbolos que no son de Forex. Determina con exactitud la intensidad de las tendencias a corto, medio y largo plazo de tus índices, acciones, materias primas, ETF e incluso criptodivisas favoritas. Puede   analizar todo lo   que su terminal le ofrece. Pruébalo y experimenta cómo   tu timing mejora significativamente   a la hora de operar. Características principales de IX Power Resultados de cálculo 100% precisos y sin rep
Blahtech Supply Demand MT5
Blahtech Limited
4.54 (13)
Was: $299  Now: $99   Supply Demand uses previous price action to identify potential imbalances between buyers and sellers. The key is to identify the better odds zones, not just the untouched ones. Blahtech Supply Demand indicator delivers functionality previously unavailable on any trading platform. This 4-in-1 indicator not only highlights the higher probability zones using a multi-criteria strength engine, but also combines it with multi-timeframe trend analysis, previously confirmed swings
Quantum Heiken Ashi PRO MT5
Bogdan Ion Puscasu
4.5 (8)
Presentamos el   Quantum Heiken Ashi PRO Diseñadas para brindar información clara sobre las tendencias del mercado, las velas Heiken Ashi son reconocidas por su capacidad para filtrar el ruido y eliminar las señales falsas. Diga adiós a las confusas fluctuaciones de precios y dé la bienvenida a una representación gráfica más fluida y confiable. Lo que hace que Quantum Heiken Ashi PRO sea realmente único es su fórmula innovadora, que transforma los datos de velas tradicionales en barras de colore
Gartley Hunter Multi
Siarhei Vashchylka
5 (7)
Gartley Hunter Multi - An indicator for searching for harmonic patterns simultaneously on dozens of trading instruments and on all possible timeframes. Manual (Be sure to read before purchasing) | Version for MT4 Advantages 1. Patterns: Gartley, Butterfly, Shark, Crab. Bat, Alternate Bat, Deep Crab, Cypher 2. Simultaneous search for patterns on dozens of trading instruments and on all possible timeframes 3. Search for patterns of all possible sizes. From the smallest to the largest 4. A
Auto Order Block with break of structure based on ICT and Smart Money Concepts (SMC) Futures Break of Structure ( BoS )             Order block ( OB )            Higher time frame Order block / Point of Interest ( POI )    shown on current chart           Fair value Gap ( FVG ) / Imbalance   -  MTF      ( Multi Time Frame )    HH/LL/HL/LH  -  MTF      ( Multi Time Frame )  Choch  MTF      ( Multi Time Frame )  Volume Imbalance     ,  MTF          vIMB Gap’s Power of 3 Equal High
El Oscilador de Índice de Precisión (Pi-Osc) de Roger Medcalf de Precision Trading Systems La versión 2 ha sido cuidadosamente recodificada para cargar rápidamente en su gráfico y se han incorporado algunas otras mejoras técnicas para mejorar la experiencia. El Pi-Osc fue creado para proporcionar señales precisas de temporización de operaciones diseñadas para encontrar puntos de agotamiento extremos, los puntos a los que los mercados se ven obligados a llegar solo para eliminar las órdenes
Legacy of Gann for MT5
Pavel Zamoshnikov
5 (6)
The indicator very accurately determines the levels of the possible end of the trend and profit fixing. The method of determining levels is based on the ideas of W.D.Gann, using an algorithm developed by his follower Kirill Borovsky. Extremely high reliability of reaching levels (according to K. Borovsky  - 80-90%) Indispensable for any trading strategy – every trader needs to determine the exit point from the market! Precisely determines targets on any timeframes and any instruments (forex, met
Bill Williams Advanced
Siarhei Vashchylka
5 (7)
Bill Williams Advanced is designed for automatic chart analysis using Bill Williams' "Profitunity" system. The indicator analyzes four timeframes at once. Manual (Be sure to read before purchasing) Advantages 1. Automatically analyzes the chart using the "Profitunity" system of Bill Williams. The found signals are placed in a table in the corner of the screen. 2. Equipped with a trend filter based on the Alligator indicator. Most of the system signals are recommended to be used only accordi
SMCpro
Arief
5 (1)
Currently Price  20% OFF  ( for unlimited use ) Indicator   USER MANUAL , trade setups, solving issues, etc :  Direct Download Here     (  for users only  ) Hello World! Introducing.. SMCpro tool and Indicator for  MetaTrader 5 , a cutting-edge feature designed to revolutionize your trading experience. With innovative ICT Smart Money Concept, you gain unparalleled insight into market dynamics, empowering you to make informed trading decisions like never before. SMC Indicator built on th
AW Trend Predictor MT5
AW Trading Software Limited
4.78 (58)
La combinación de niveles de tendencia y ruptura en un sistema. Un algoritmo de indicador avanzado filtra el ruido del mercado, determina la tendencia, los puntos de entrada y los posibles niveles de salida. Las señales indicadoras se registran en un módulo estadístico, que le permite seleccionar las herramientas más adecuadas, mostrando la efectividad del historial de señales. El indicador calcula las marcas Take Profit y Stop Loss. Manual e instrucciones ->   AQUÍ   / Versión MT4 ->   AQUÍ Có
Otros productos de este autor
La media móvil ponderada por volumen (VW-MA) es una media móvil ponderada por volumen. Los promedios móviles estándar usan precios y simplemente ignoran los volúmenes negociados. El indicador de media móvil ponderada por volumen responde a esto. Tenga en cuenta que, a diferencia del mercado de valores, el mercado de divisas no está centralizado. Los pedidos y los volúmenes no se comparten entre los corredores. Como consecuencia, los volúmenes utilizados en la media móvil ponderada por volum
MACD ponderado por volumen Volume Weighted MACD (VW-MACD) fue creado por Buff Dormeier y descrito en su libro Investing With Volume Analysis. Representa la convergencia y divergencia de las tendencias de precios ponderadas por volumen. La inclusión de volumen permite que el VW-MACD sea generalmente más receptivo y confiable que el MACD tradicional.   ¿Qué es MACD (Media Móvil Convergencia Divergencia)? La divergencia de convergencia de la media móvil fue creada por Gerald Appel en 1979.
El índice de flujo de dinero de Twiggs fue creado por Collin Twiggs. Se deriva del índice de flujo de dinero de Chaikin, pero utiliza rangos reales en lugar de máximos y mínimos para evitar picos debido a brechas. También está utilizando un promedio móvil exponencial suavizado para evitar picos en los volúmenes para alterar los resultados. La media móvil exponencial es la descrita por Welles Wilder para muchos de sus indicadores. Cuando el índice de flujo de dinero de Twiggs está por encima d
El índice de flujo de dinero es un indicador de múltiples marcos de tiempo que muestra el índice de flujo de dinero de cualquier período de tiempo. Le ayuda a concentrarse en el flujo de dinero a largo plazo antes de utilizar el flujo de dinero del período de tiempo actual. Puede agregar tantos índices de flujo de dinero: múltiples períodos de tiempo como desee. Consulte las capturas de pantalla para ver los índices de flujo de dinero M30 / H1 / H4 en la misma ventana, por ejemplo.
El Patrón Dorado es una configuración de 3 velas basada en la proporción áurea de la secuencia de Fibonacci. La proporción áurea es 1.618. Sus variaciones incluyen 0,618, 2,618 y 3,618. En este indicador los mejores resultados son 2.618. El patrón Dorado se compone de una vela normal, seguida de una más grande, con un precio de cierre de al menos 2,618 veces el tamaño de la primera vela. El patrón dorado alcista está formado por velas alcistas, mientras que el patrón dorado bajista es
Filtro:
No hay comentarios
Respuesta al comentario